
- Contact Us:
-

-

-

-


Daily Market Updates
09 Aug 2023
USDJPY
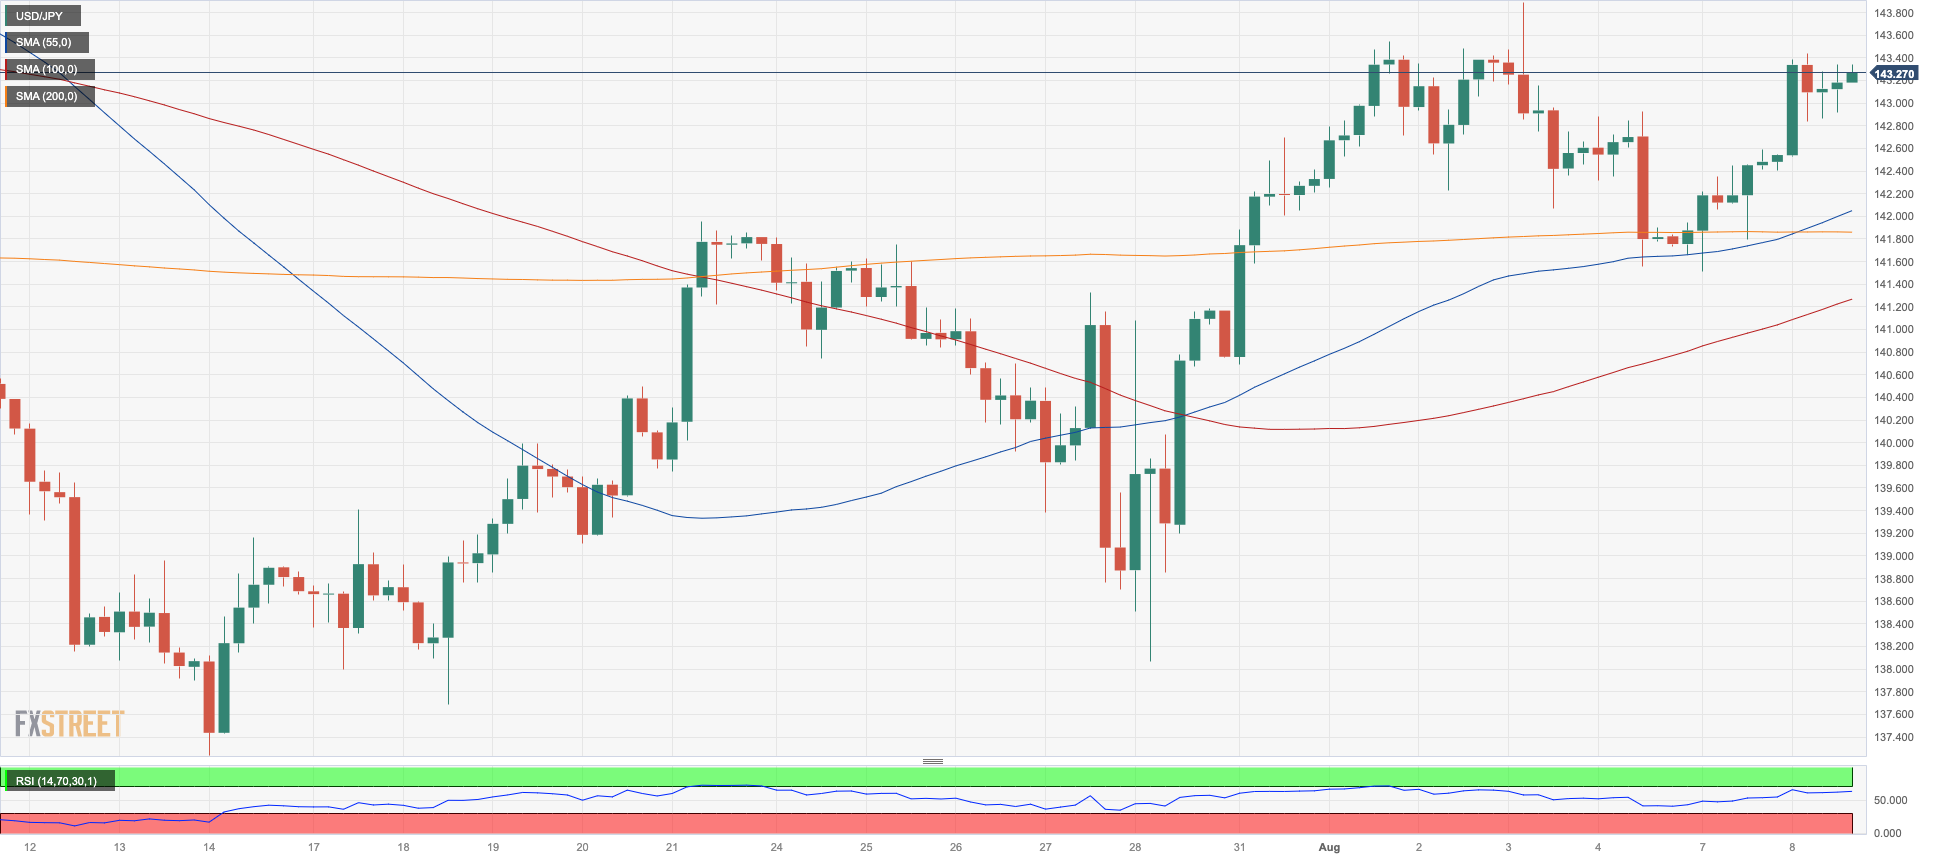
The continuance of the greenback's bullish momentum sent USD/JPY farther north of the 143.00 barrier, or three-day highs, on Tuesday.
Indeed, the pair maintained its positive start to the week and gained further on the back of the dollar's strong performance, despite US yields extending the leg down at the short end of the curve and plunging to multi-session lows in the 10-year/30-year sector.
In the Japanese bond market, JGB 10-year rates fell for the third session in a row, reverting to the 0.60% level.
In Japan, Household Spending fell 4.2% YoY in June, but Bank Lending increased 2.9% in July compared to the same month in 2022. Furthermore, Eco Watchers Survey Current ticked higher to 54.4 in July and Eco Watchers Survey Outlook improved to 54.1 in the same month.
The August high of 143.88 (August 3) is next on the upside for USD/JPY, followed by the 2023 peak of 145.07 (June 30) and the 2022 peak of 151.94 (October 21). The 55-day SMA at 141.24, on the other hand, provides temporary support before the weekly low of 138.05 (July 28) and the July low of 137.23 (July 14). If the latter is breached, a slide to the critical 200-day SMA of 136.50 is possible, before the weekly low of 133.01 (April 26), minor support of 132.01 (April 13), and the round level of 130.00. On the daily chart, the RSI climbed over the 58 yardstick.
Resistance levels: 143.43 143.88 144.65 (4H chart)
Support levels: 141.50 141.15 138.05 (4H chart)
GBPUSD
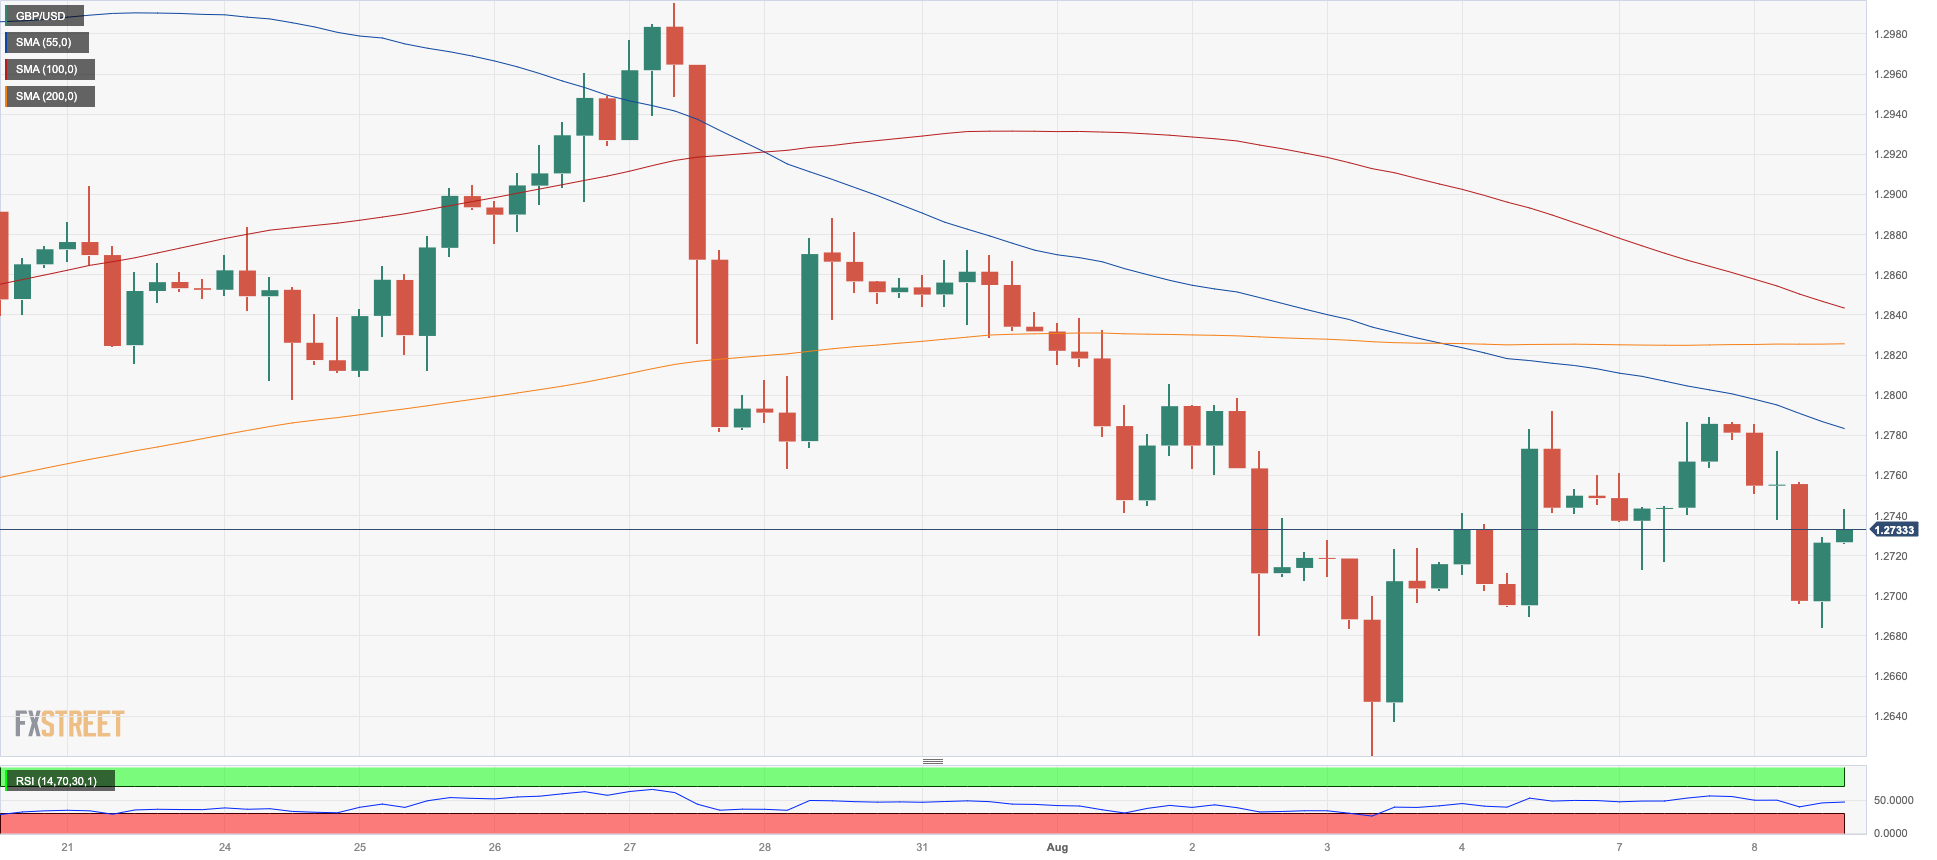
After a hopeful beginning of the week for the British pound, the continued robustness of the US dollar prompted a significant decline in the currency's value. As a result, GBP/USD fell below the crucial 1.2700 support level, revisiting lows not seen in several days on Tuesday.
Once more, underwhelming economic outcomes from China had a negative impact on assets linked to risk, causing Cable to retreat considerably. This retreat came after two successive sessions of gains for the quid.
In the UK, BRC Retail Sales Monitor rose at an annualized 1.8% in July.
If sellers regain control of the sentiment, GBP/USD could revisit the August low of 1.2620 (August 3), followed by the weekly low of 1.2590 (June 29), which appears bolstered by the provisional 100-day SMA of 1.2593. The 2021-2023 trendline emerges around 1.2480, ahead of the June low of 1.2368 (June 5) and the May low of 1.2308 (May 25), both of which appear to be supported by the crucial 200-day line SMA (1.2327). In contrast, immediate up barrier aligns at the weekly high of 1.2995 (July 27) ahead of the 2023 high of 1.3142 (July 14). North from here comes the weekly highs of 1.3146 (April 14 2022) seconded by 1.3298 (March 15 2022). On the daily chart, the RSI dropped below the 45 level.
Resistance levels: 1.2792 1.2821 1.2888 (4H chart)
Support levels: 1.2684 1.2591 1.2368 (4H chart)
AUDUSD
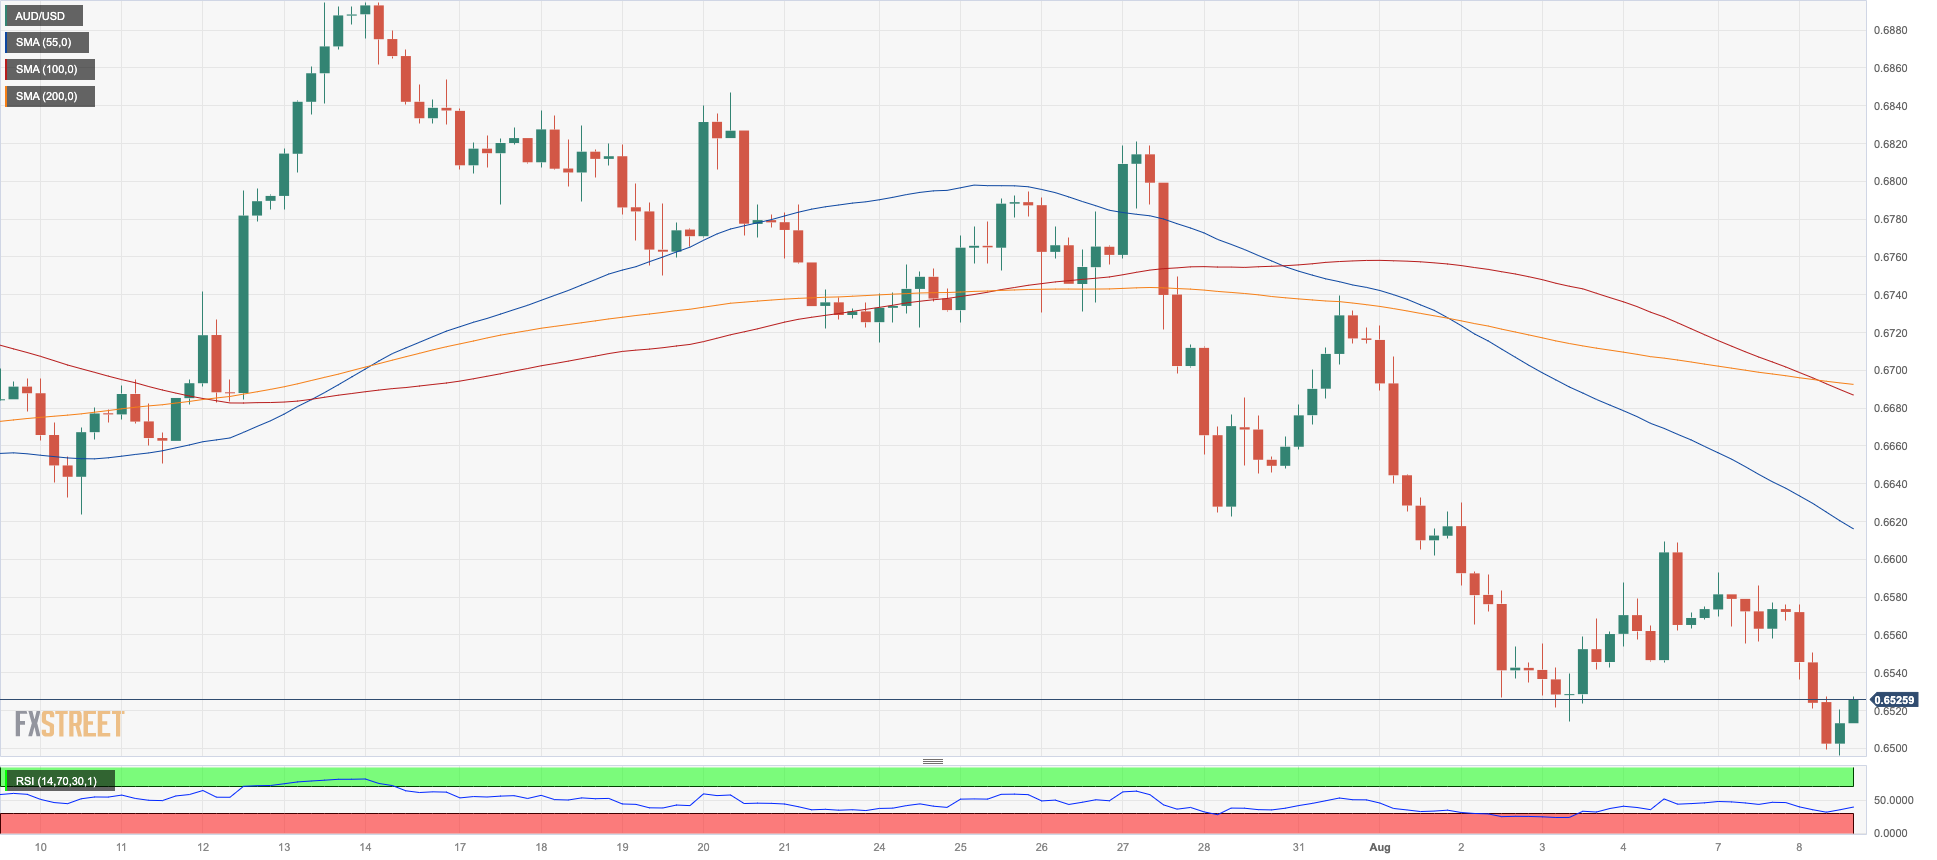
The selling pressure on the Australian dollar persisted throughout Tuesday's trading session.
This time, the strength of the greenback exerted further downward pressure on AUD/USD, causing it to break below the key support level of 0.6500 and trade at levels not seen since early June. This decline marks the fourth consecutive week of negative momentum for the pair.
Furthermore, disappointing economic data from China added to the weight on the Aussie dollar, and the overall weakness in the commodity market contributed to its decline to its lowest level in two weeks.
In Australia, the Westpac Consumer Confidence Index showed a slight decline from 81.3 to 81.0 in August, indicating a marginal decrease in consumer optimism. On the other hand, the NAB Business Confidence Index improved to 2 in July from -1, suggesting a positive shift in business sentiment.
A deeper decline in AUD /USD could pave the way for a possible test of the 2023 low of 0.6458 (May 31) in the not-so-distant future. Below this level, the November 2022 low at 0.6272 occurs (November 3) before reaching the 2022 low at 0.6179 (October 13). Just the opposite, there is an interim hurdle at the 55-day SMA at 0.6684 prior to the important 200-day SMA at 0.6733. Further up emerges the July high of 0.6894 (July 13), just ahead of the June top of 0.6899 (June 16). A breakout from this area would allow the pair to target the key 0.7000 level, ahead of the weekly high of 0.7029 (February 14) and the 2023 peak of 0.7157 (February 2). The everyday RSI slipped back to the 37 region.
Resistance levels: 0.6609 0.6693 0.6739 (4H chart)
Support levels: 0.6496 0.6458 0.6386 (4H chart)
GOLD
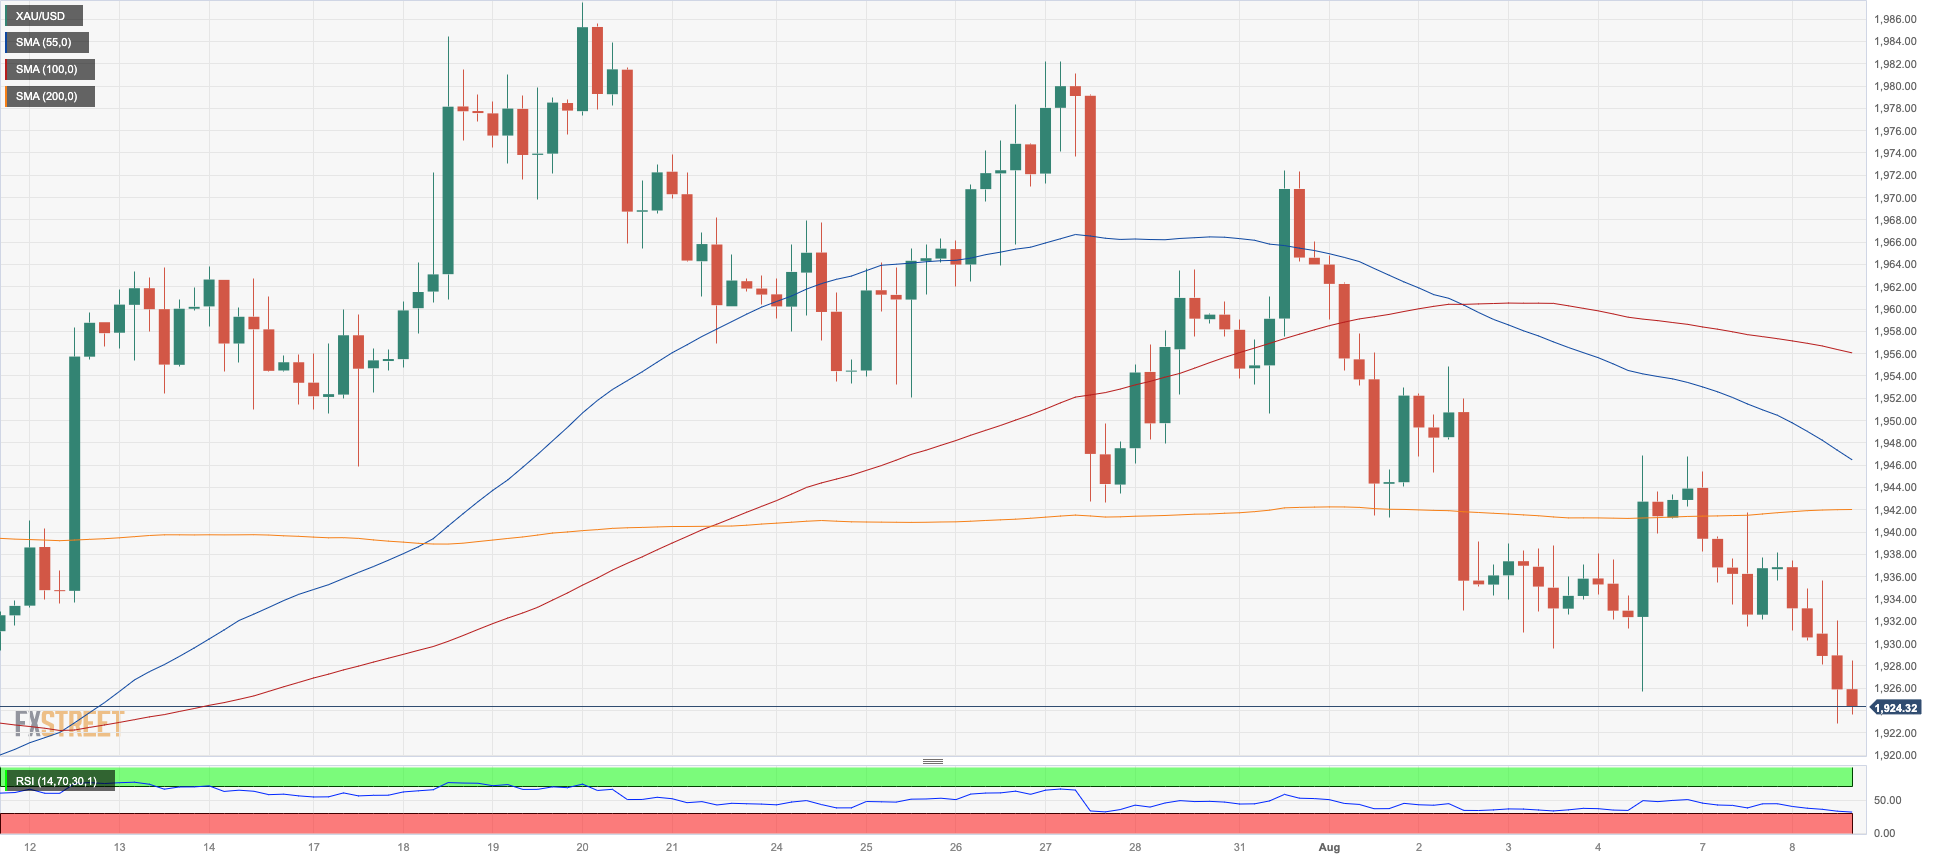
Gold prices fell to a four-week low of around $1920 per troy ounce on Tuesday. The rising momentum behind the US dollar kept prices weak for dollar-denominated assets and wider financial markets.
However, limiting some of bullion’s losses were lower US yields across maturities. This came despite mixed messages so far this week from Fed’s officials about interest rate hikes and the broader health of the US economy.
Looking ahead, gold prices are likely to track US inflation data closely when it's released on August 10. There is increasing speculation that inflation could moderate, leading the Fed to end its rate hike cycle sooner than expected. This could provide support for gold prices.
The potential for further declines in gold prices remains a possibility at present. The immediate focal points are the August 4 low at $1922 (August 8), followed by the significant milestone of $1900, and the June low at $1893 (June 29), which seems to find support from the 200-day SMA at $1896. Below this lies the 2023 bottom at $1804 (February 28), along with the crucial support level at $1800. Conversely, a continuation of the upward trend could propel gold prices towards the July peak of $1987 (July 20). Surpassing this threshold might instigate a surge towards the pivotal mark of $2000. Beyond that lies the potential path towards the 2023 peak of $2067 (May 4) preceding the 2022 pinnacle at $2070 (March 8), and ultimately reaching the all-time zenith of $2075 (August 7, 2020).
Resistance levels: $1946 $1954 $1972 (4H chart)
Support levels: $1922 $1912 $1893 (4H chart)
CRUDE WTI
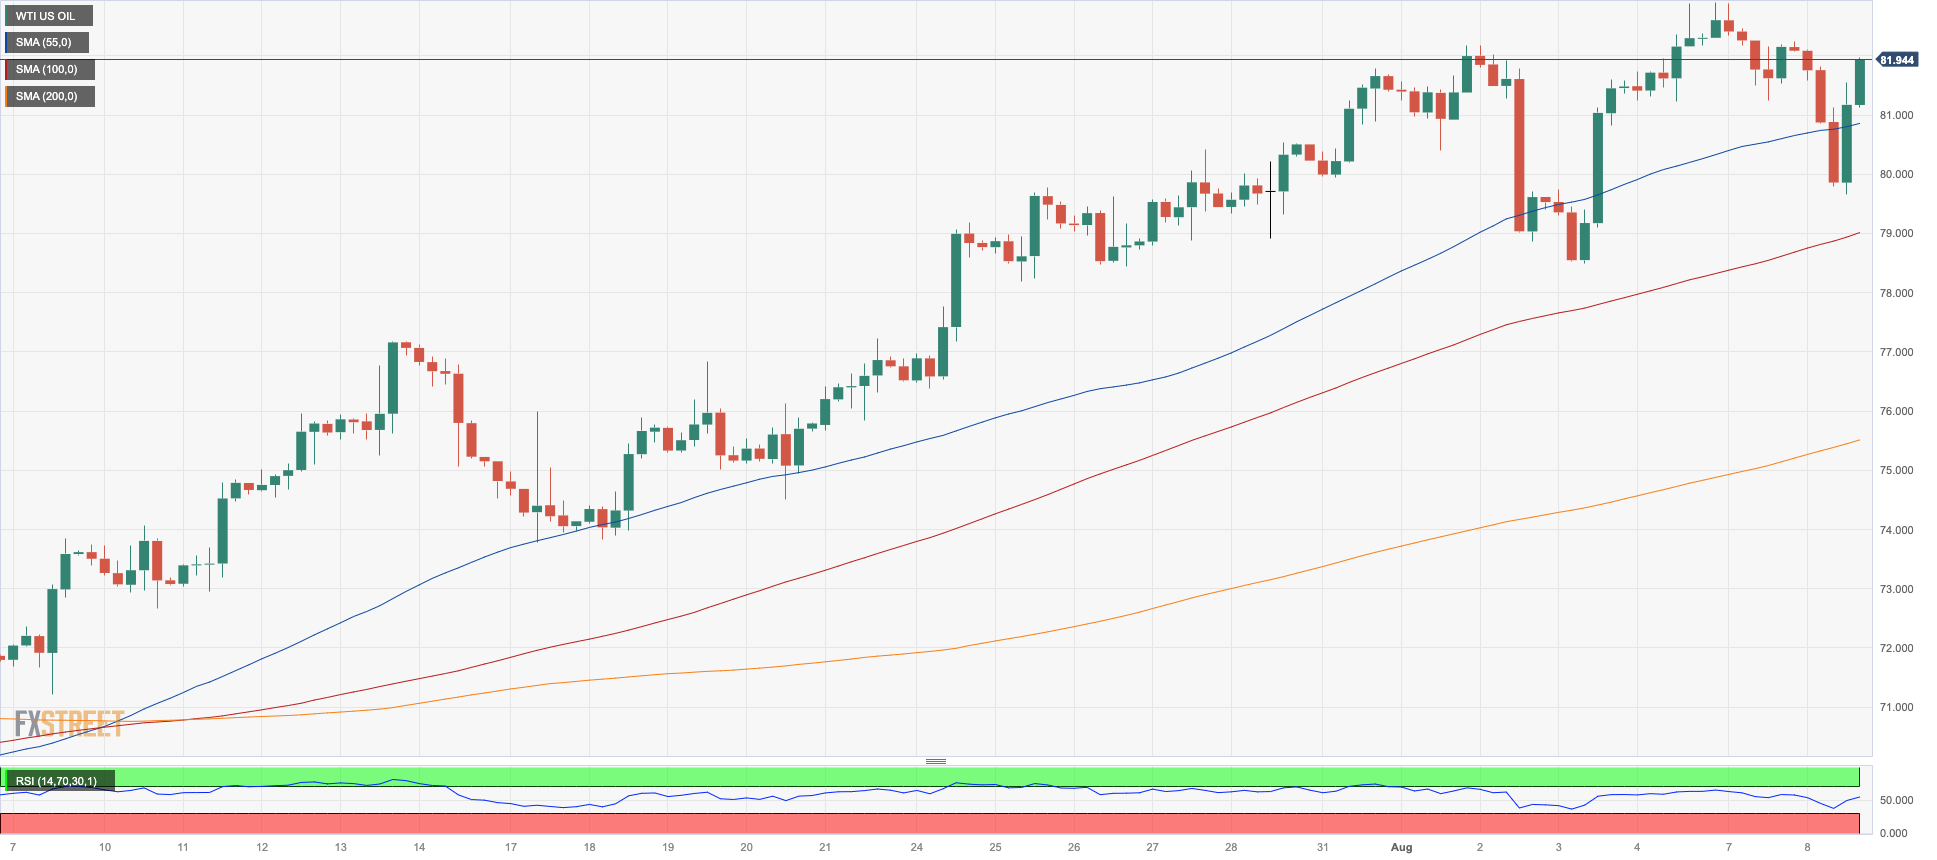
Prices of the American benchmark for sweet light crude oil fell to as low as $80.00 a barrel, or three-day lows, only to recover most of that loss later in the day.
Crude oil prices fell again as a result of fresh fears about the Chinese economy's slow (if any) recovery in the aftermath of the COVID outbreak.
These concerns were heightened on Tuesday by larger-than-expected decreases in Chinese exports and imports, as well as a stronger dollar, which impacted on traders' mood.
The American Petroleum Institute (API) will release data on US crude oil inventories for the week ending August 4 following the closing bell on Wall Street.
Despite the ongoing correction, the upside bias in WTI remains unchanged so far. Against that, the next upside target is the 2023 high of $83.49 (April 12), followed by the November 2022 top of $93.73 (November 7) and the August 2022 peak of $97.65 (August 30). Instead, the pivotal 200-day SMA of $76.50 is regarded as initial support, followed by the weekly low of $73.89 (July 17), which appears to be bolstered by the interim 100-day and 55-day SMAs of $74.27 and $73.75, respectively. If WTI goes below this region, it may challenge the June low of $66.86 (June 12), before dropping to the 2023 low of $63.61 (May 4). Below there, the December 2021 bottom of $62.46 (December 2) may give support before reaching the key round level of $60.
Resistance levels: $83.49 $88.5 $90.08 (4H chart)
Support levels: $79.89 $78.66 $74.47 (4H chart)
GER40
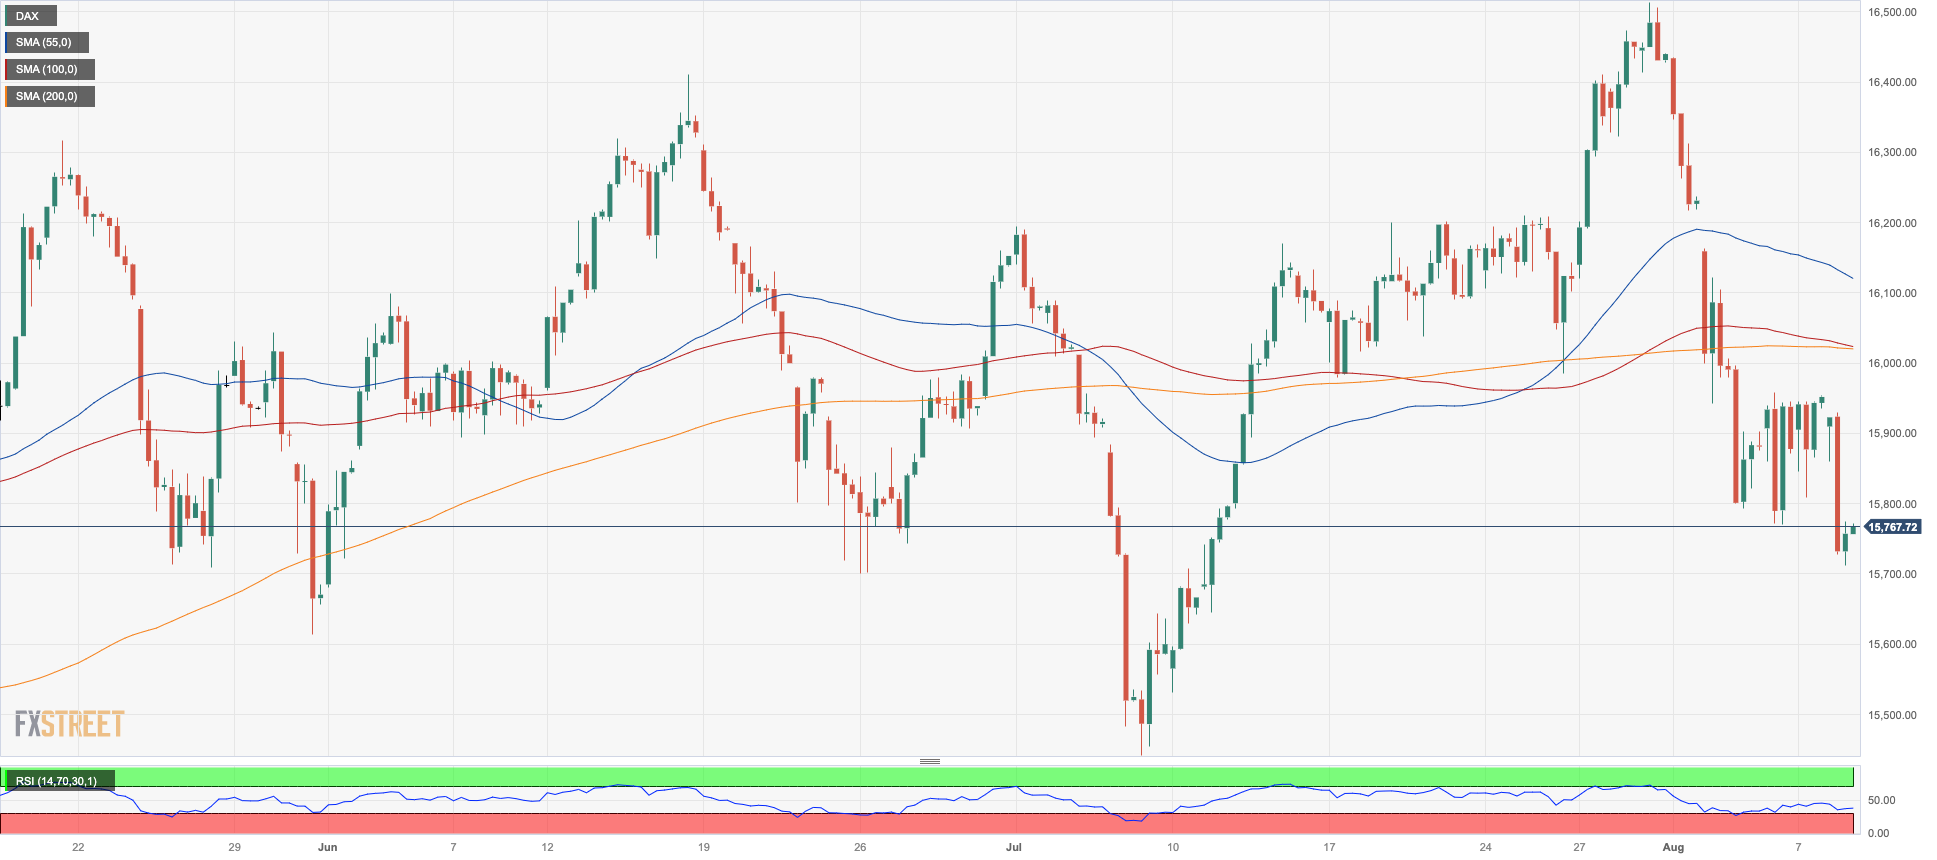
The DAX40, an index which tracks German blue chips, fell to a level last seen in early July around 15,800 on Tuesday.
The decline followed similar drops in other European stock indexes amid a broad-based negative sentiment surrounding the banking industry. Poor economic results from China and their impact on the country’s economic rebound also contributed to the decline in the index to new four-week lows.
The daily drop in the DAX40 was accompanied by an equally strong pullback in 10-year bund yields, which fell to monthly lows near 2.40%.
Extra weakness carries the potential to force the DAX40 to breach the August low at 15706 (August 8) and allow for a potential deeper drop to the July low of 15456 (July 7) ahead of the crucial 200-day SMA of 15270. If this zone is cleared, the index is expected to fall to the March low of 14458 (March 20) before plunging to the December 2022 low of 13791 (December 20) and the 2022 low of 11862 (September 28). On the other hand, there is a provisional barrier at the 55-day SMA at 16024 prior to the record high of 16528 (July 31). The daily RSI dropped further below the 40 mark.
Best Performers: Merck, E.ON SE, Beiersdorf AG
Worst Performers: Deutsche Bank AG, Commerzbank, Infineon
Resistance levels: 16021 16146 16528 (4H chart)
Support levels: 15706 15456 14809 (4H chart)
NASDAQ
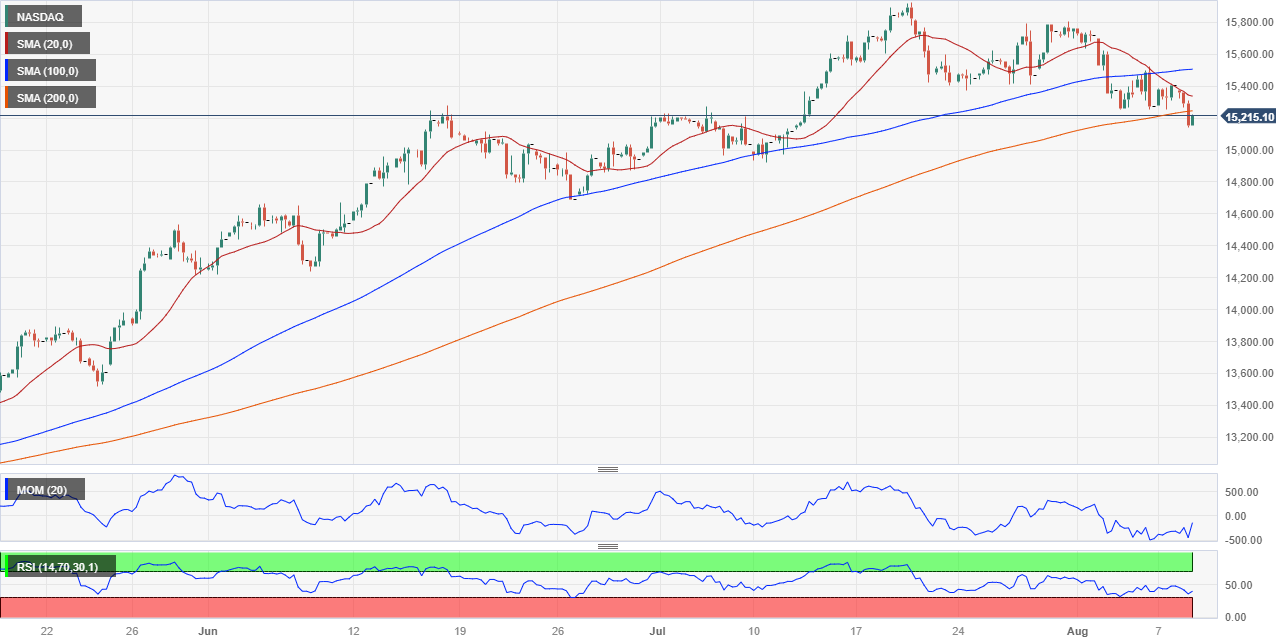
Concerns over the US banking industry drove down US indexes on Tuesday.
In reality, the Nasdaq 100 index followed its peers and fell to fresh four-week lows near the 15100 zone after Moody's downgraded small US lenders and placed six large banks on the radar for a possible downgrade.
Furthermore, the Fed's ambiguous tone earlier in the day appears to have thrown cold water on markets' belief that the Fed is done raising interest rates.
In addition, traders remained nervous ahead of the publication of further earnings reports late Tuesday.
In case losses gather extra impulse and the Nasdaq 100 breaks below the August low at 15148 (August 8), the next support is seen at the transitory 55-day SMA at 14980 prior to the July low of 14924 (July 10). If this area is also lost, the index could decline to the weekly lows of 14687 (June 26), 14283 (June 7) and 13520 (May 24). Further down comes the May low of 12938 (May 4) seconded by the key 200-day SMA at 12895 and the April low of 12724 (April 25). On the flip side, the weekly high of 15803 (July 31) emerges as the next hurdle ahead of the 2023 top of 15932 (July 19) and the round level of 16000. The daily RSI deflated to the vicinity of 45.
Top Gainers: Amgen, Lucid Group, Biogen
Top Losers: Datadog, DexCom, Zscaler
Resistance levels: 15795 15932 16017 (4H chart)
Support levels: 15148 14924 14687 (4H chart)
DOW JONES
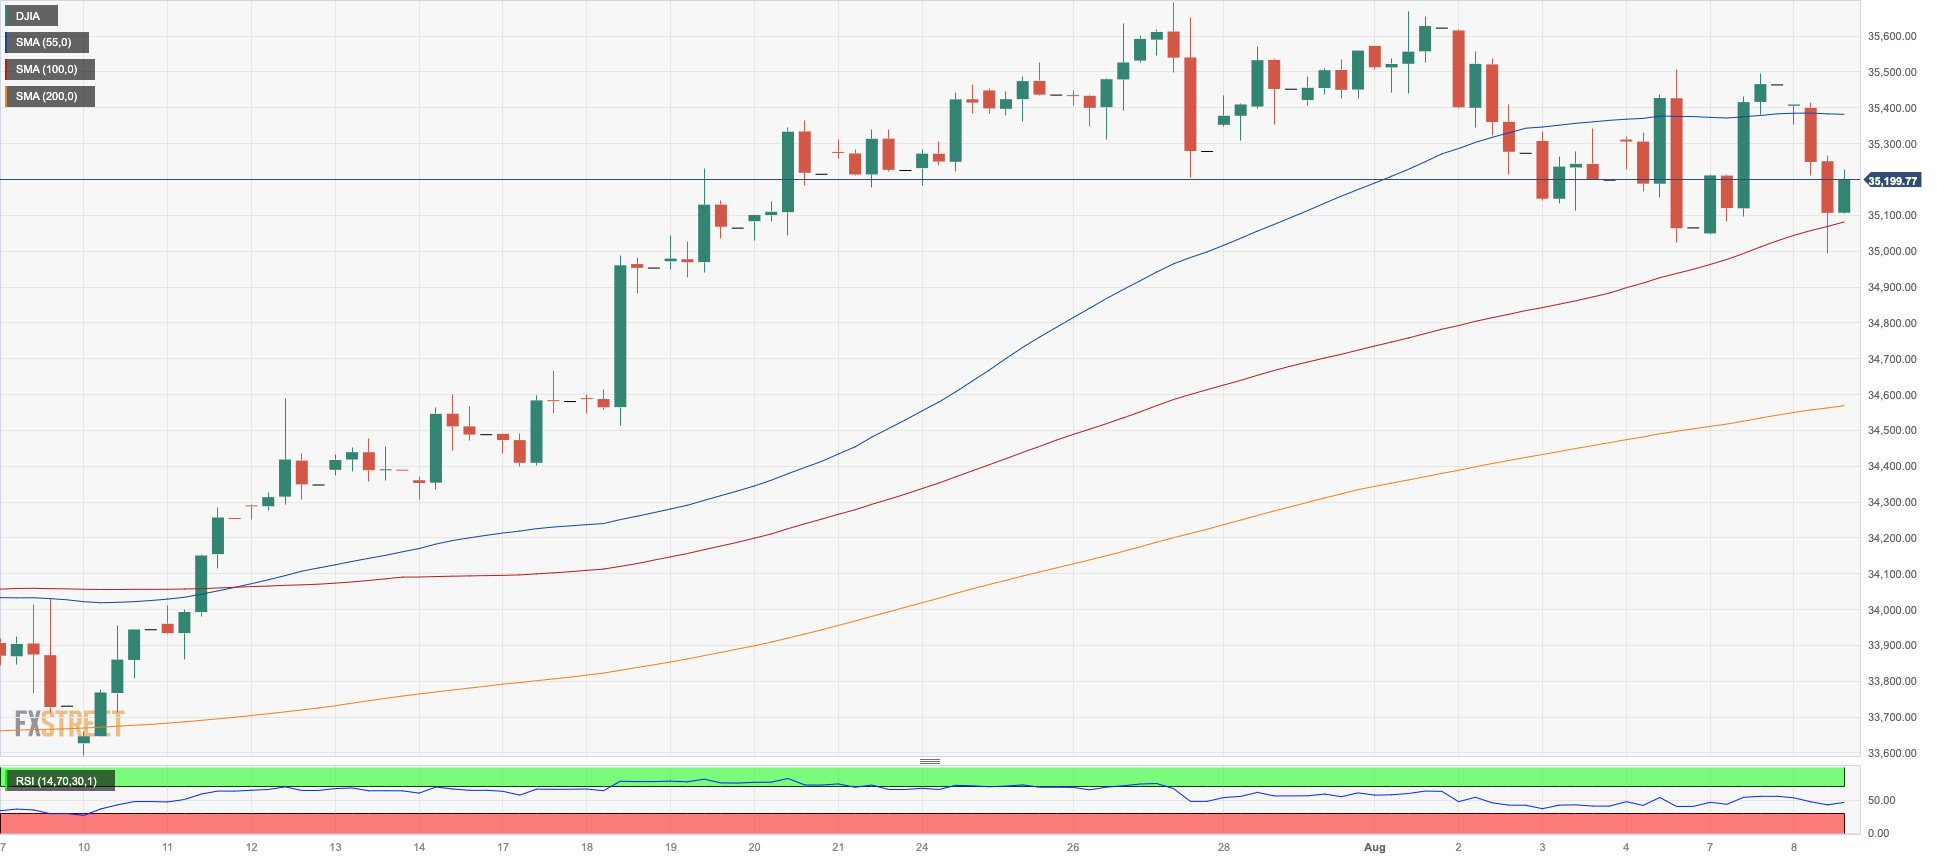
The strong progress made by US stocks, as indicated by the Dow Jones on Monday, lost its momentum on Tuesday.
This was primarily due to renewed apprehensions among investors regarding the US banking sector. These concerns were sparked by the credit agency Moody's decision to lower the credit ratings of several smaller banks. Furthermore, the agency hinted at the possibility of downgrading six major banks in the future.
Adding to the overall sense of caution was the anticipation surrounding forthcoming corporate earnings reports. As the earnings season is coming to an end, investors maintained a high level of vigilance in light of the upcoming financial results.
All in all, the Dow Jones dropped 0.79% to 35191, the S&P500 retreated 0.84% to 4480, and the tech-benchmark Nasdaq Composite lost 1.19% to 13830.
Immediately to the upside for the Dow Jones comes the 2023 high of 35679 (August 1) prior to the February 2022 top of 35824 (February 9) and the all-time high of 36952 (January 5, 2022). Having said that, the initial support level aligns at the transitory 55-day and 100-day SMAs at 34249 and 33821, respectively, ahead of the July low of 33705 (July 10) and the key 200-day SMA at 33559. The breakdown of the latter exposes the May low of 32586 (May 25) seconded by the 2023 low of 31429 (March 15). The day-to-day RSI deflated to the 54 region.
Top Performers: Amgen, Boeing, Verizon
Worst Performers: Goldman Sachs, Walgreen Boots, Nike
Resistance levels: 35679 35824 36513 (4H chart)
Support levels: 35007 34854 33705 (4H chart)
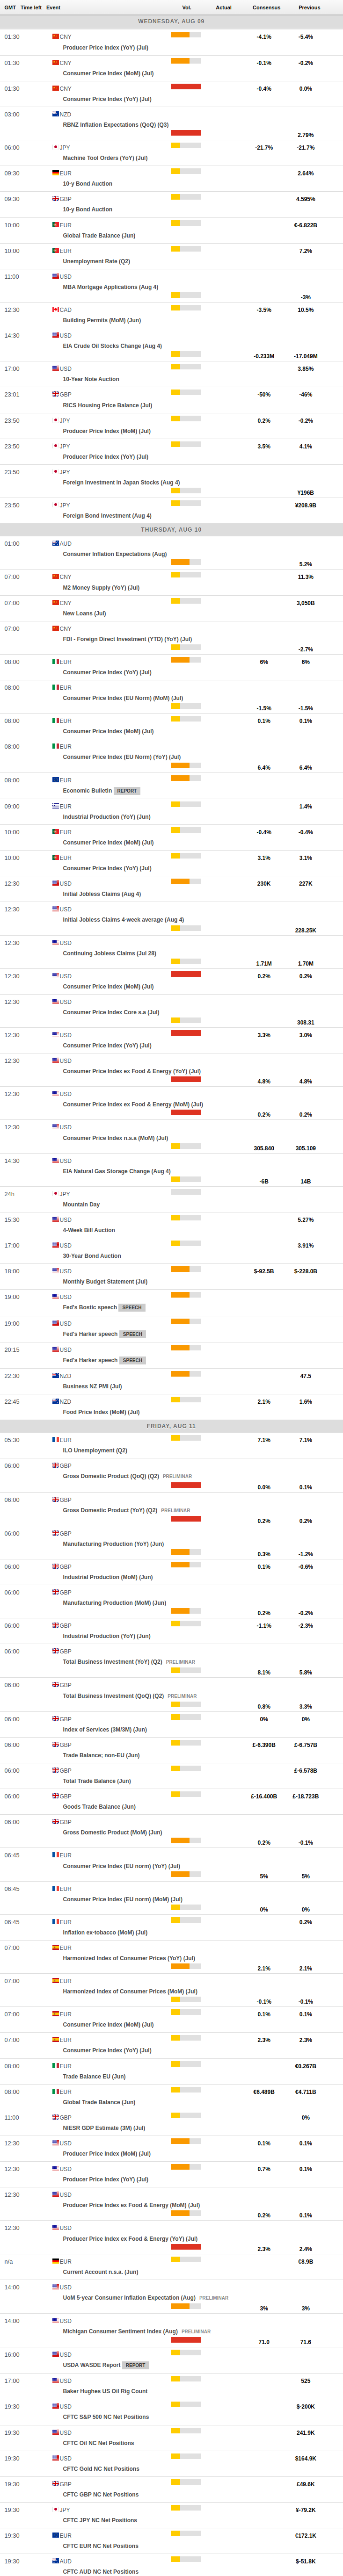
MACROECONOMIC EVENTS
All Information & Updates provided by:

All information relating to the financial markets available on this page has been prepared and issued by FXStreet (Forexstreet SL, Spain, Reg: B62498233) on the basis of publicly available information and all information believed to be reliable and does not conflict with Kuwaiti local laws, and all necessary care has been taken to before the company to ensure that the facts mentioned are correct from the source.
NCM Investment nor any of its directors or employees shall in any way be held responsible for the contents of this news, and the information contained on this page is intended only to provide clients with publicly available information and should not be construed as investment advice, report or analysis and/or constitute an offer or invitation to buy or sell financial instruments of any kind.
RISK WARNING: Forex and CFDs are highly risky leveraged products, as losses can exceed deposits. Please ensure you understand all the risks and take independent advice if necessary. NCM will segregate the clients based on the criteria of the regulator and its bylaws. NCM does not provide any advisory service; the material published does not constitute advice or a recommendation for a transaction in any financial instrument. NCM accepts no responsibility for any use of the content presented and any consequences of that use. Anyone acting on the information provided does so at their own risk.