
- Contact Us:
-

-

-

-


Daily Market Updates
10 Aug 2023
USDJPY
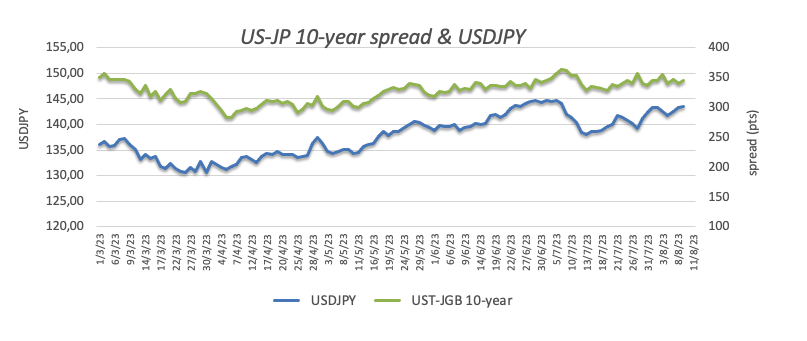
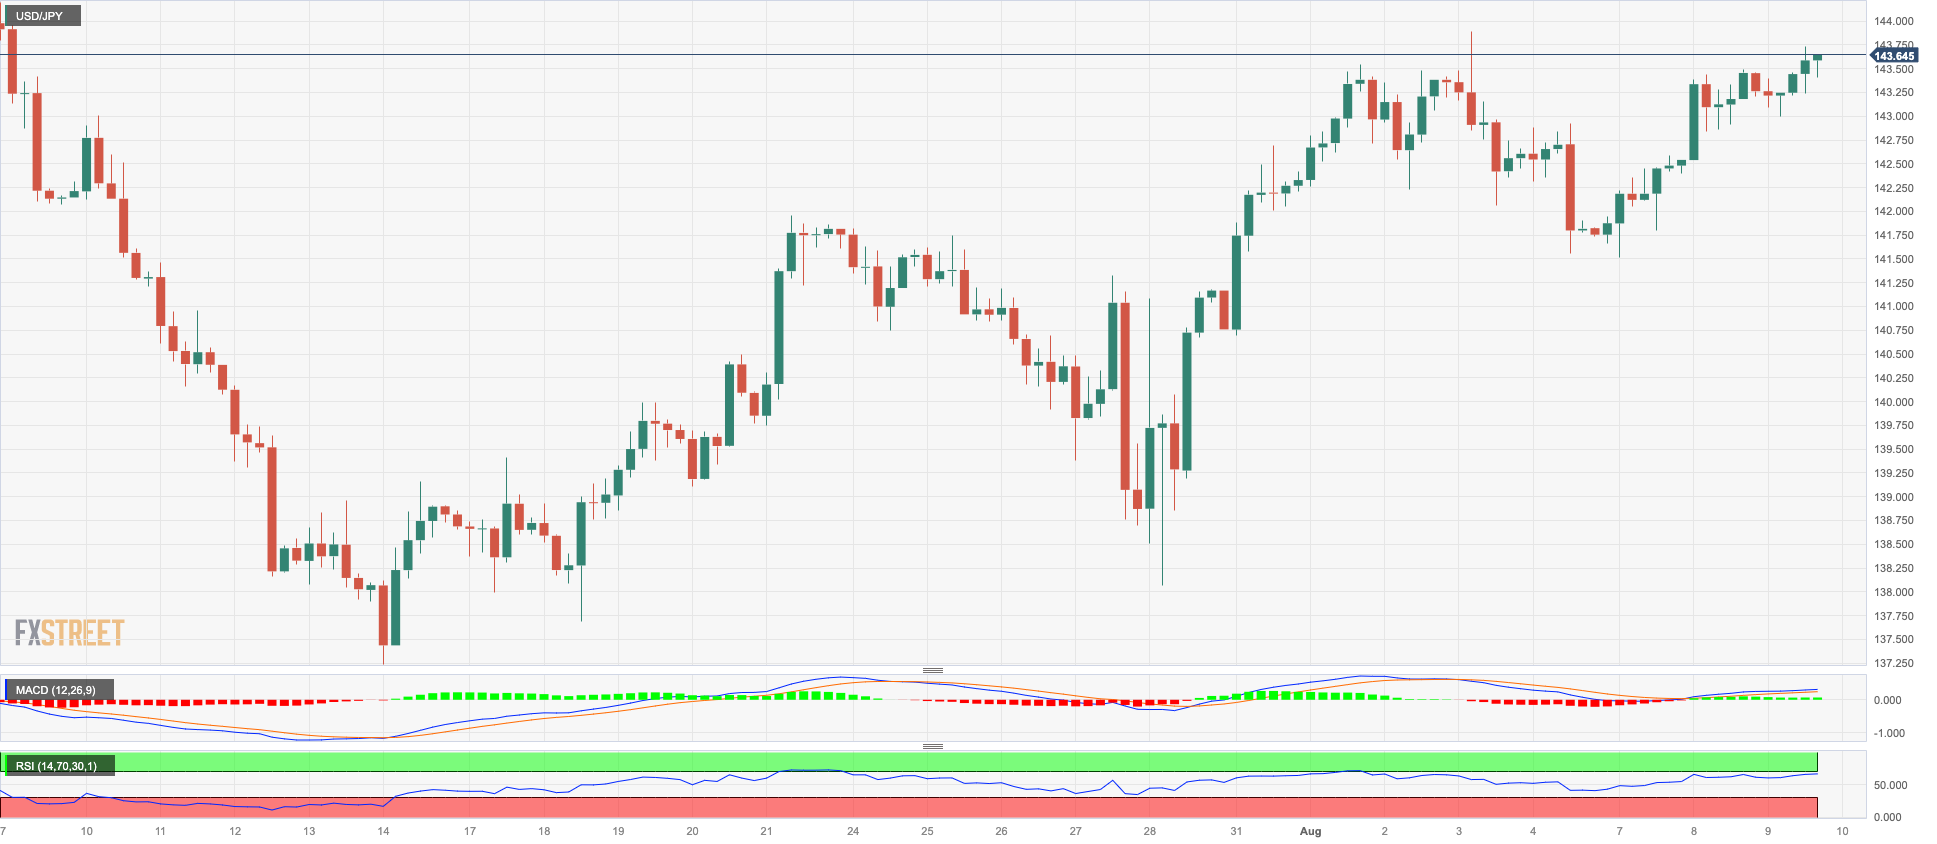
USD/JPY continued its upward trajectory for the third consecutive session this week, reaching heights not seen in several sessions, around 143.60. This progression now presents the possibility of a forthcoming attempt to challenge the monthly highs, positioned near the 144.00 level (August 3).
Interestingly, this climb in the pair unfolded in spite of a setback in the greenback and a lack of notable movement in US bond yields across different time frames. In contrast, Japanese Government Bond (JGB) 10-year benchmark yields declined to multi-day lows, approaching the 0.55% level. The prevailing risk-on trade, instead, appears to have bolstered the selling bias around the Japanese currency on Wednesday.
Switching the focus to economic data from Japan, the singular highlight on Wednesday's domestic calendar was the contraction of Machine Tool Orders by an annualized 19.8% in July.
Next on the upside for USD/JPY is the August high of 143.88 (August 3), followed by the 2023 top of 145.07 (June 30) and the 2022 peak of 151.94 (October 21). The 55-day SMA at 141.33, on the other hand, provides brief support and underpins the August low of 141.50 (August 7) before the weekly lows of 138.05 (July 28) and 137.23 (July 14). If the latter is crossed, a drop to the important 200-day SMA of 136.48 before the weekly low of 133.01 (April 26), minor support of 132.01 (April 13), and the round level of 130.00 is probable. The RSI trespassed the 60 yardstick.
Resistance levels: 143.66 143.88 144.65 (4H chart)
Support levels: 141.91 141.50 141.15 (4H chart)
GBPUSD
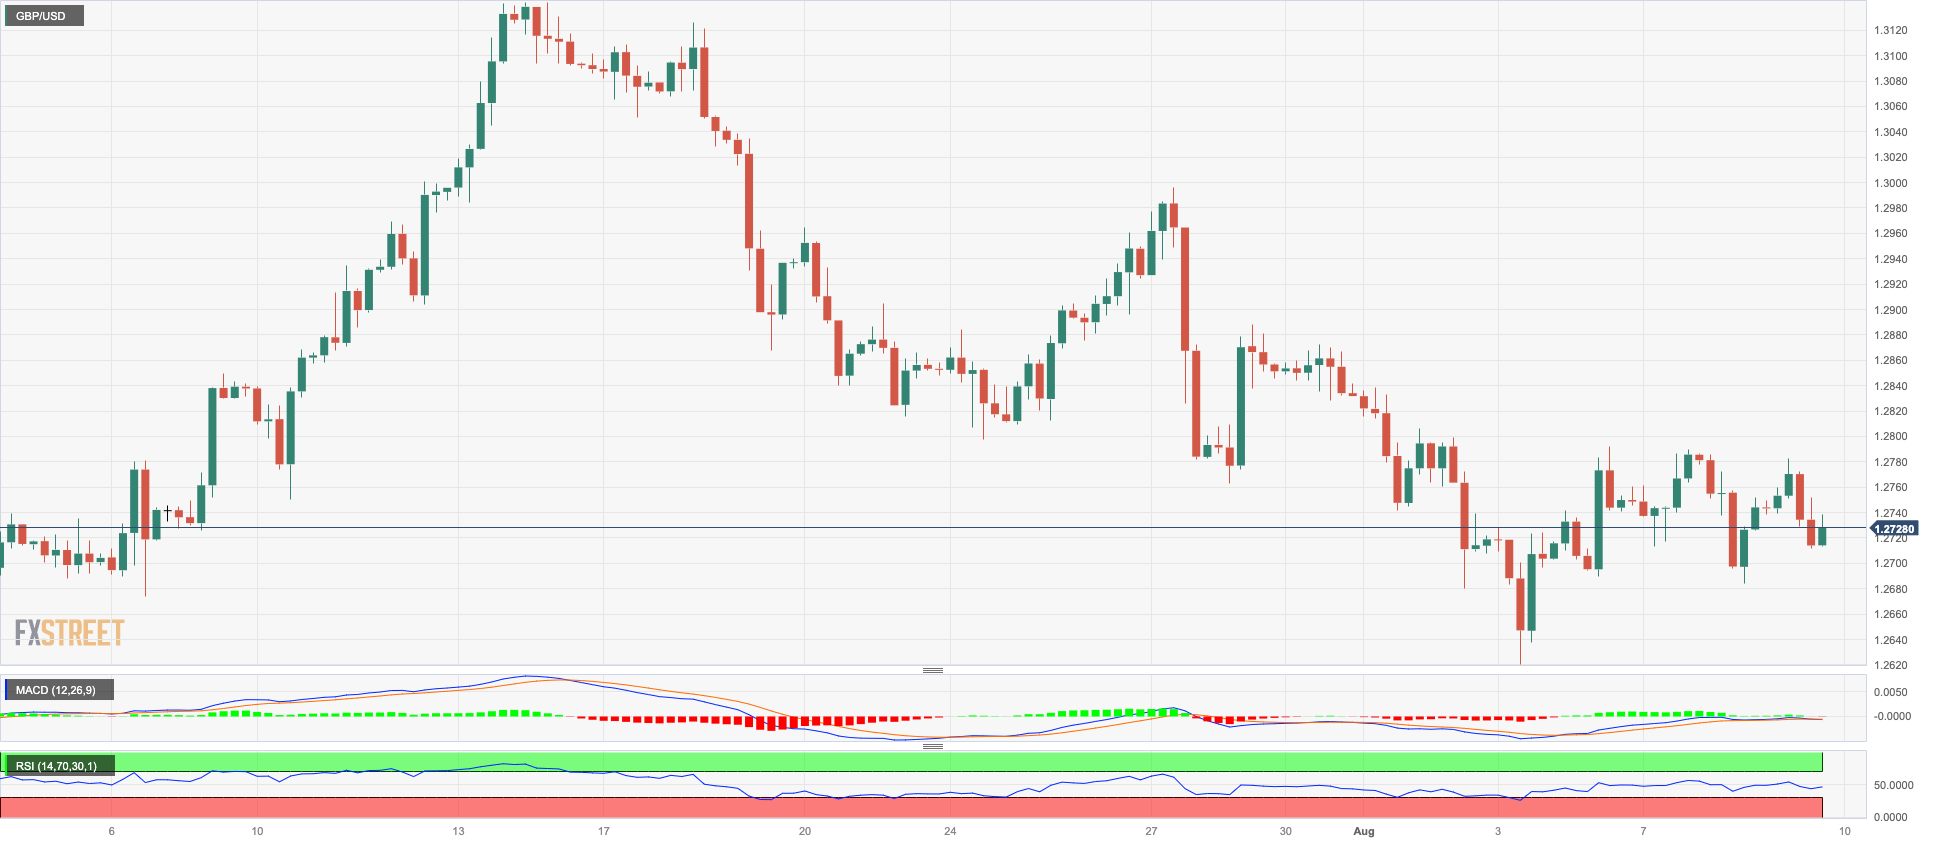
Despite a slight pullback in the greenback, GBP/USD failed to make any meaningful headway and instead retreated to the vicinity of the 1.2700 neighborhood on Wednesday, where some support appears to have turned up.
In fact, the British pound largely ignored the modest improvement in the risk-linked universe and maintained a tight trading range vs. the dollar. However, a disappointing report from the National Institute of Economic and Social Research (NIESR) appears to have weighed on sentiment surrounding the quid.
According to that report, the U.K. economy is on track to experience five years of below-average economic growth. NIESR officials have cautioned that it is unlikely that the country's GDP will recover to pre-pandemic levels before 2024. The think tank has highlighted the combined impact of three major factors, namely Brexit, the COVID-19 pandemic, and the Russian invasion of Ukraine, along with the necessary monetary tightening measures taken to curb inflation, as severe challenges that have adversely affected the U.K. economy. NIESR's projections indicate an inflation rate of 5.2% by the end of 2023, followed by a decrease to 3.9% by the end of 2024. Looking further into the future, NIESR anticipates that inflation will average at 2.3% in 2025, with a slight increase expected in 2026.
The UK calendar was empty on Wednesday.
If sellers regain control of sentiment, GBP/USD could retake the August low of 1.2620 (August 3), followed by the weekly low of 1.2590 (June 29) and supported by the interim 100-day SMA (1.2598). The 2021-2023 trendline is around the 1.2480 area and ahead of the June low of 1.2368 (5 June) and the May low of 1.2308 (25 May), both of which appear to be supported by the crucial 200-day SMA (1.2334). In contrast, the immediate upside barrier is at the weekly high of 1.2995 (July 27) ahead of the 2023 high of 1.3142 (July 14). North of this are the weekly highs of 1.3146 (April 14 2022) and 1.3298 (March 15 2022). On the daily chart, the RSI receded to the sub-45 zone.
Resistance levels: 1.2792 1.2821 1.2888 (4H chart)
Support levels: 1.2684 1.2591 1.2368 (4H chart)
AUDUSD
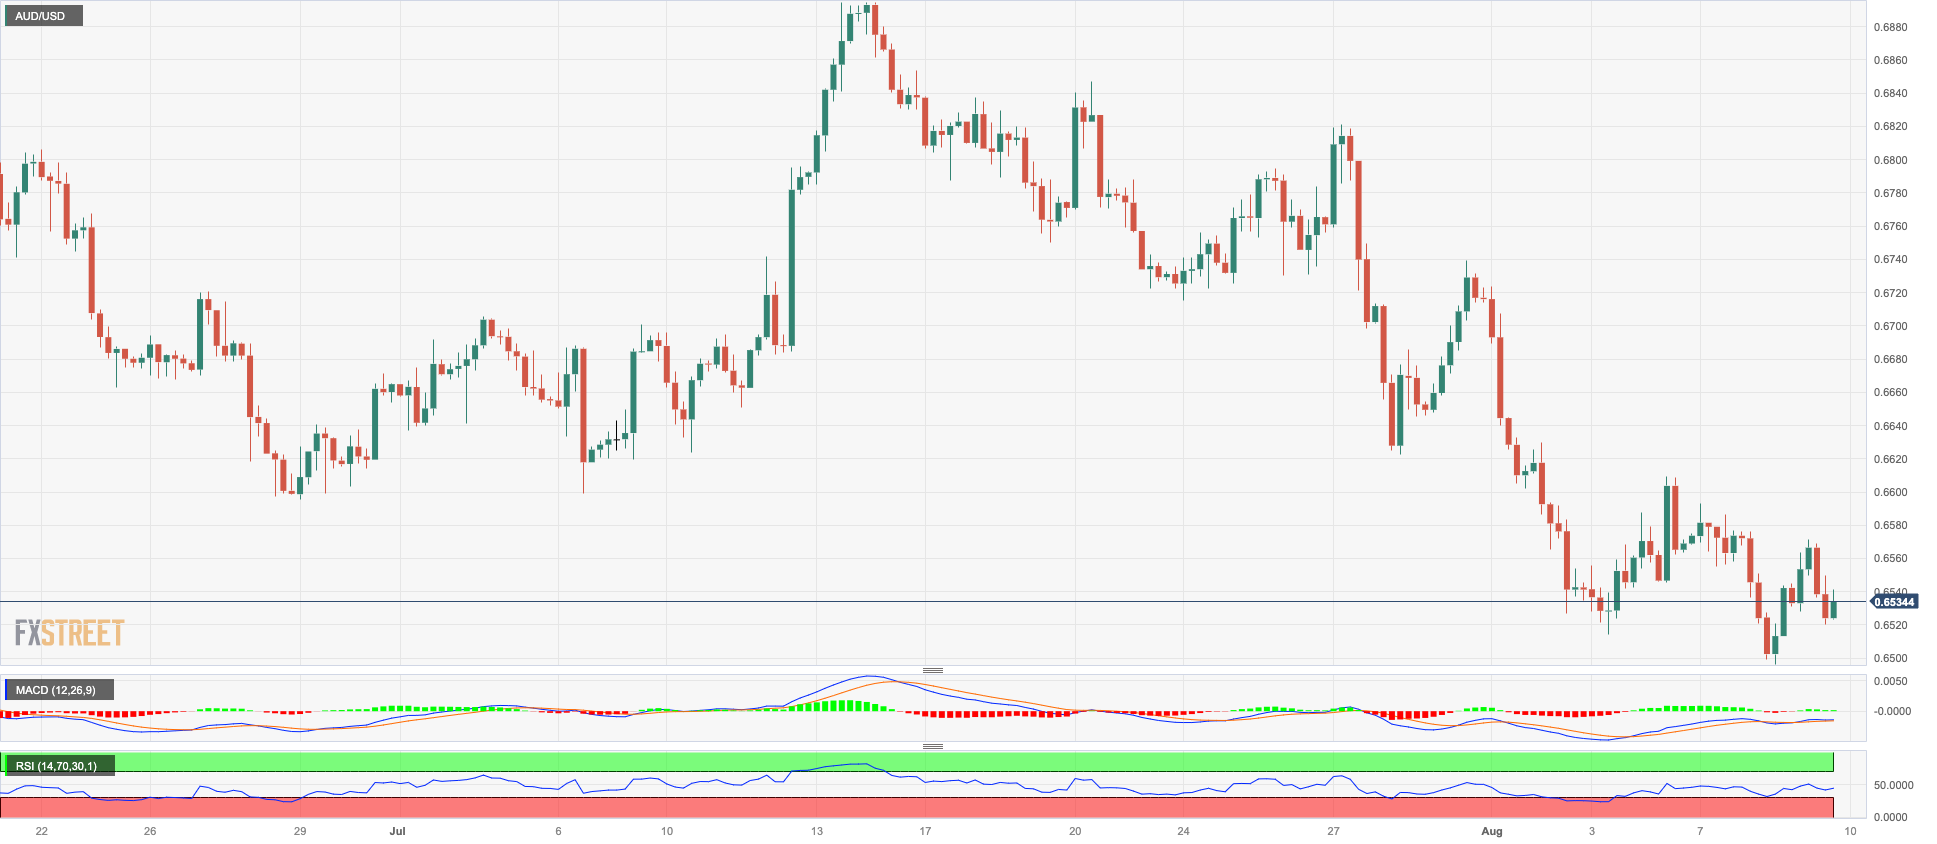
The Australian dollar fell against the greenback on Wednesday, adding to Tuesday’s losses despite the dollar’s renewed offer tone.
In the meantime, the Aussie dollar continued to draw weakness from Chinese headlines, this time following the 0.3% annualized drop in consumer prices, which only adds to the persistently deteriorating outlook for the country’s economy.
The next noteworthy event in the Australian calendar will be the release of August’s Consumer Inflation Expectations on Thursday.
A further decrease in the AUD/USD faces the immediate target at the August low of 0.6496 (August 8). The breach of this level might pave the way for a test of the 2023 low of 0.6458 (May 31) prior to the November 2022 bottom of 0.6272 (November 3), and the 2022 low of 0.6179 (October 13). On the contrary, there is an intermediate barrier at the 55-day SMA of 0.6685 before the crucial 200-day SMA of 0.6734. The July high of 0.6894 (July 13) appears further up, barely ahead of the June top of 0.6899 (June 16). If the pair breaks out of this range, it will be able to target the key 0.7000 yardstick ahead of the weekly high of 0.7029 (February 14) and the 2023 peak of 0.7157 (February 2). The day-to-day RSI slipped back below 37.
Resistance levels: 0.6571 0.6609 0.6693 (4H chart)
Support levels: 0.6496 0.6458 0.6386 (4H chart)
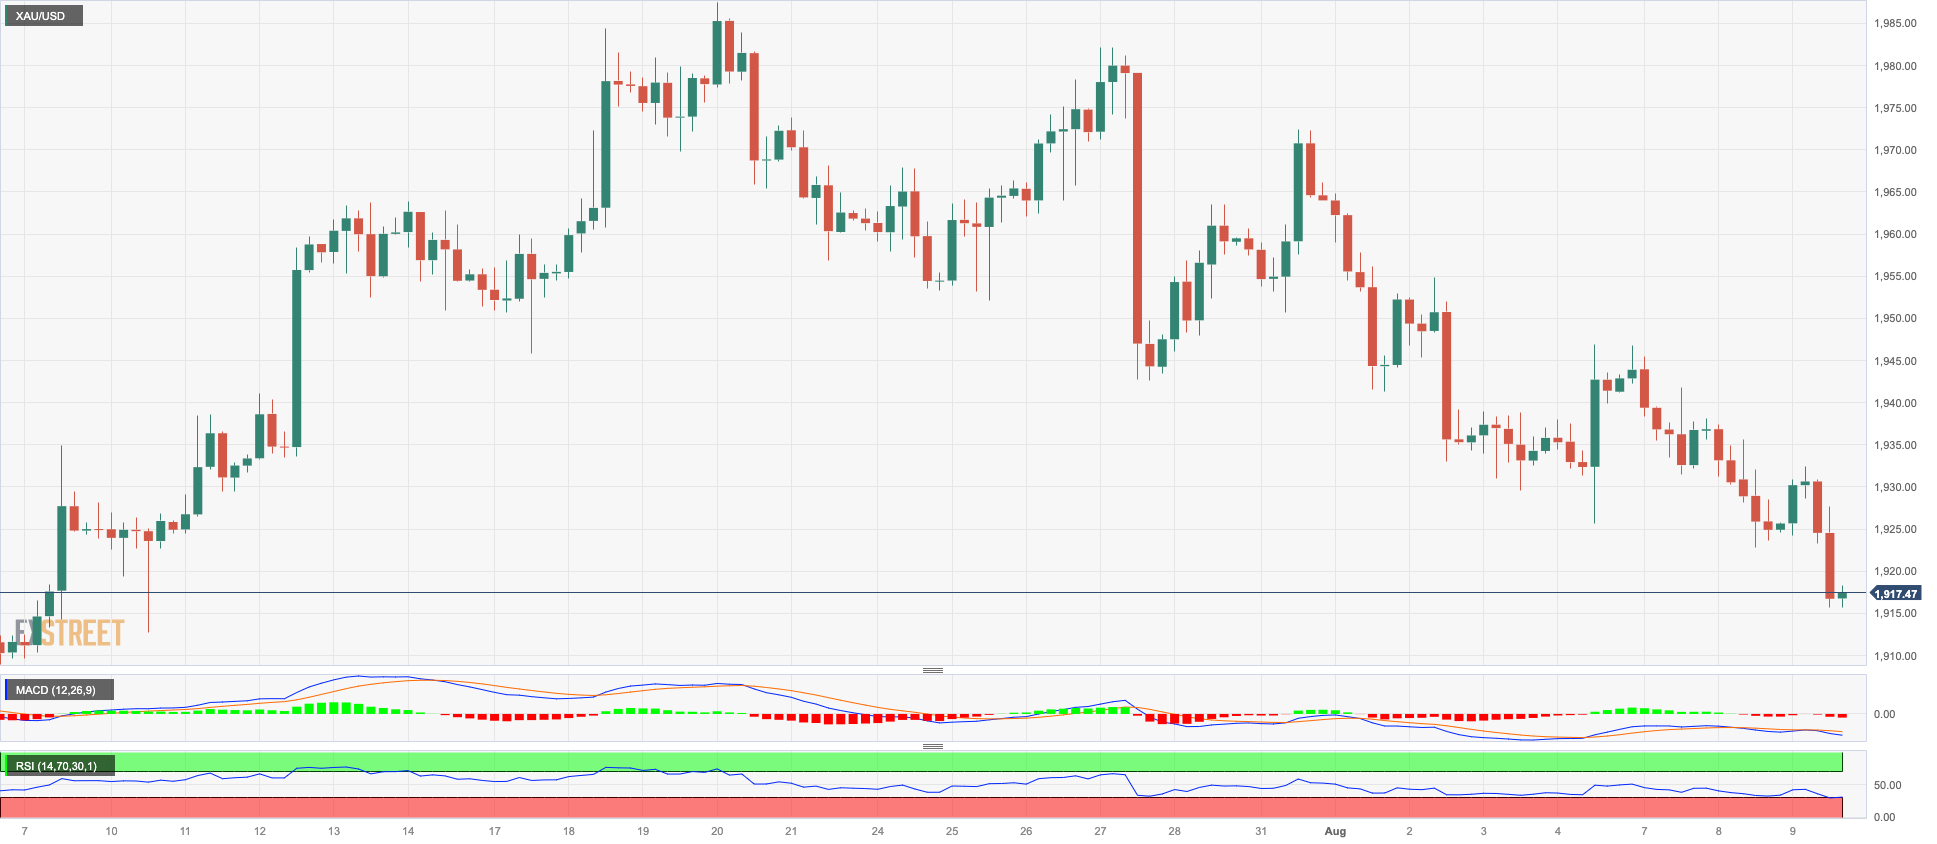
GOLD
On Wednesday, another weakening in the precious metal pulled prices to new four-week lows around $1915 per troy ounce.
The daily drop in bullion occurred amid further selling pressure on the dollar and a complete lack of traction in US rates throughout the curve, however the spell of risk appetite appears to have kept price activity around the yellow metal subdued.
Looking forward, gold prices are expected to closely mirror US inflation data when it is revealed on August 10. There is growing concern that inflation could fall, prompting the Fed to stop its rate rise cycle earlier than predicted. This might give gold prices a boost.
At the moment, additional drops in gold prices remain a possibility. Against that, the next southward stop comes at the key milestone of $1900, followed by the June low of $1893 (June 29), which appears to find support from the 200-day SMA at $1897. Down from here emerges the 2023 low of $1804 (February 28), as well as the critical support level of $1800. On the flip side, temporary hurdles align at the 55-day and 100-day SMA s at $1944 and $1967, respectively, ahead of the July top of $1987 (July 20). Surpassing this level might trigger a rise towards the critical level of $2000. Beyond that is the probable route to the 2023 top of $2067 (May 4), which will precede the 2022 peak of $2070 (March 8), and the all-time high of $2075 (August 7 2020).
Resistance levels: $1946 $1954 $1972 (4H chart)
Support levels: $1912 $1902 $1893 (4H chart)
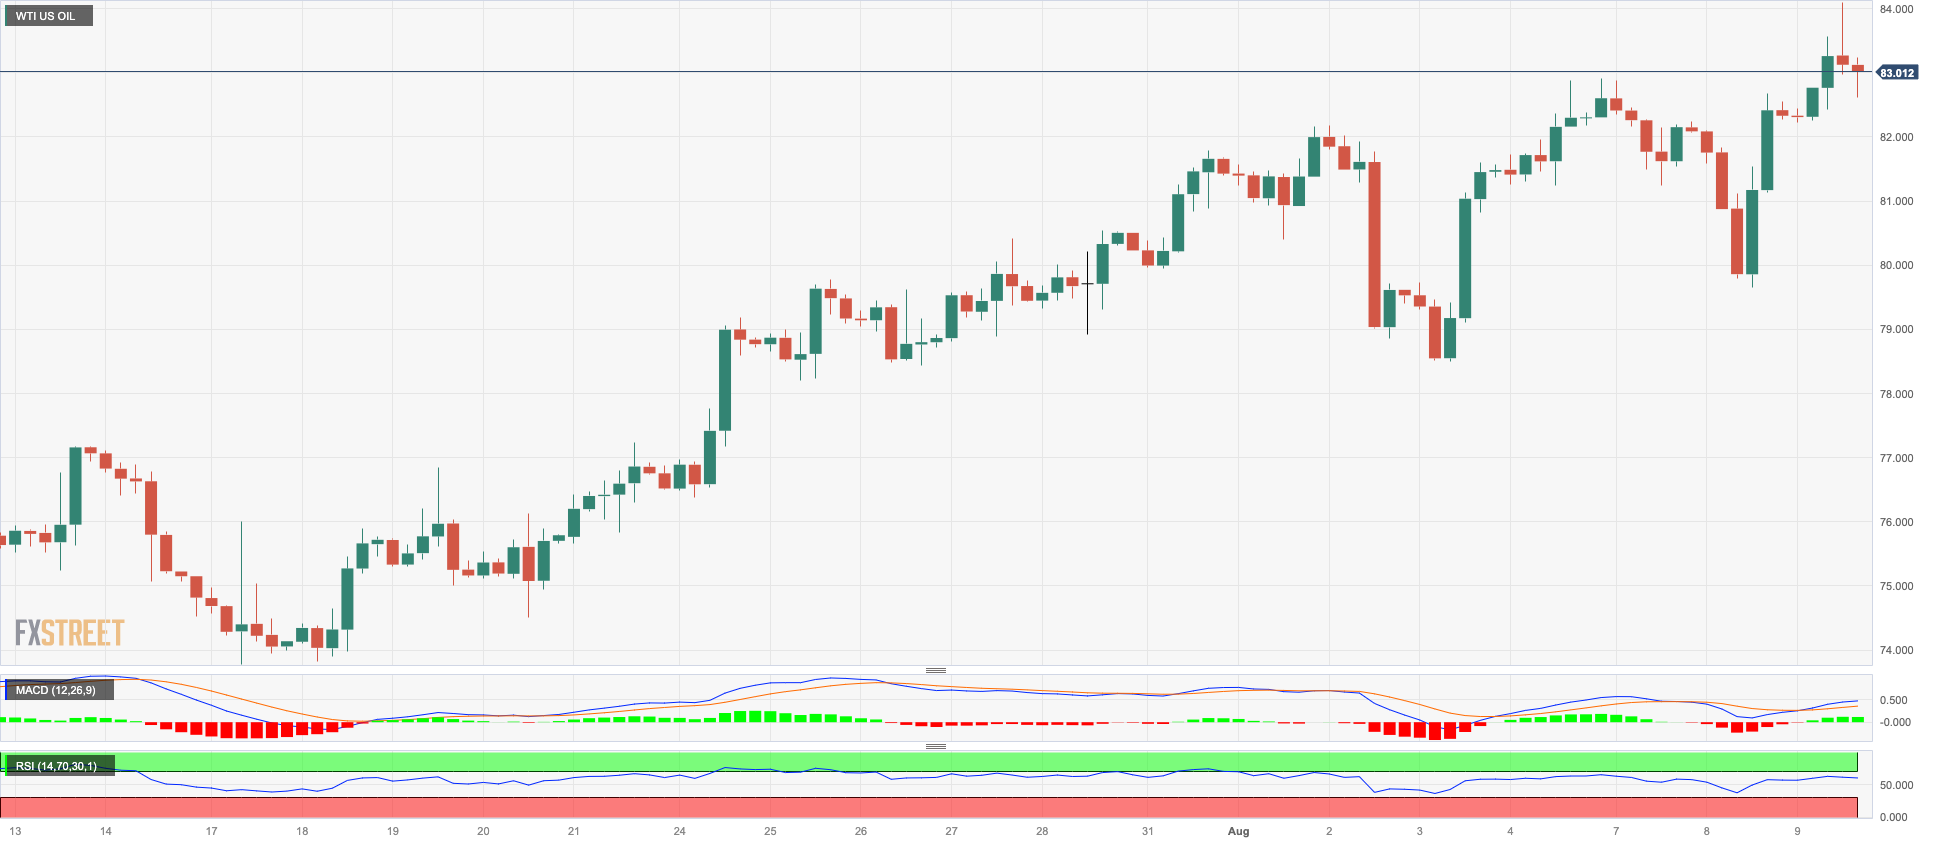
CRUDE WTI
Once again, the story of limited supply had a significant impact and caused the prices of WTI to reach new highs for 2023, surpassing the $84.00 per barrel mark on Wednesday. This rise in prices counteracted the increasing worries about the Chinese economy and its potential for recovery in the latter part of 2023.
In fact, traders were mindful of the recent actions taken by Saudi Arabia to decrease its oil production and Russia's commitment to reducing oil exports. These factors played a crucial role in sustaining the upward momentum of crude oil prices in the last weeks.
Somewhat tempering the upside in prices, the EIA reported that US crude oil inventories unexpectedly increase by 5.861M barrels in the week to August 4, while supplies at Cushing went up by 0.159M barrels, Weekly Distillate Stocks shrank by 1.706M barrels and gasoline stockpiles dropped by 2.661M barrels.
Despite the latest downturn, WTI's bullish bias remains constant. That said, the next upside target is the 2023 high of $84.61 (August 9) , followed by the November 2022 high of $93.73 (November 7) and the weekly peak of $97.65 (August 30 2022). Instead, the August low of $78.74 (August 4) emerges as the initial contention seconded by the critical 200-day SMA of $76.48 and the weekly low of $73.89 (July 17). The loss of this level exposes the interim 100-day and 55-day SMAs of $74.44 and $73.95, respectively. If WTI falls below this level, it might test the June low of $66.86 (June 12) before falling to the 2023 low of $63.61 (May 4). Below there, the December 2021 bottom of $62.46 (December 2) may provide support before hitting the key $60.00 mark per barrel.
Resistance levels: $84.61 $88.5 $90.08 (4H chart)
Support levels: $79.89 $78.66 $74.47 (4H chart)
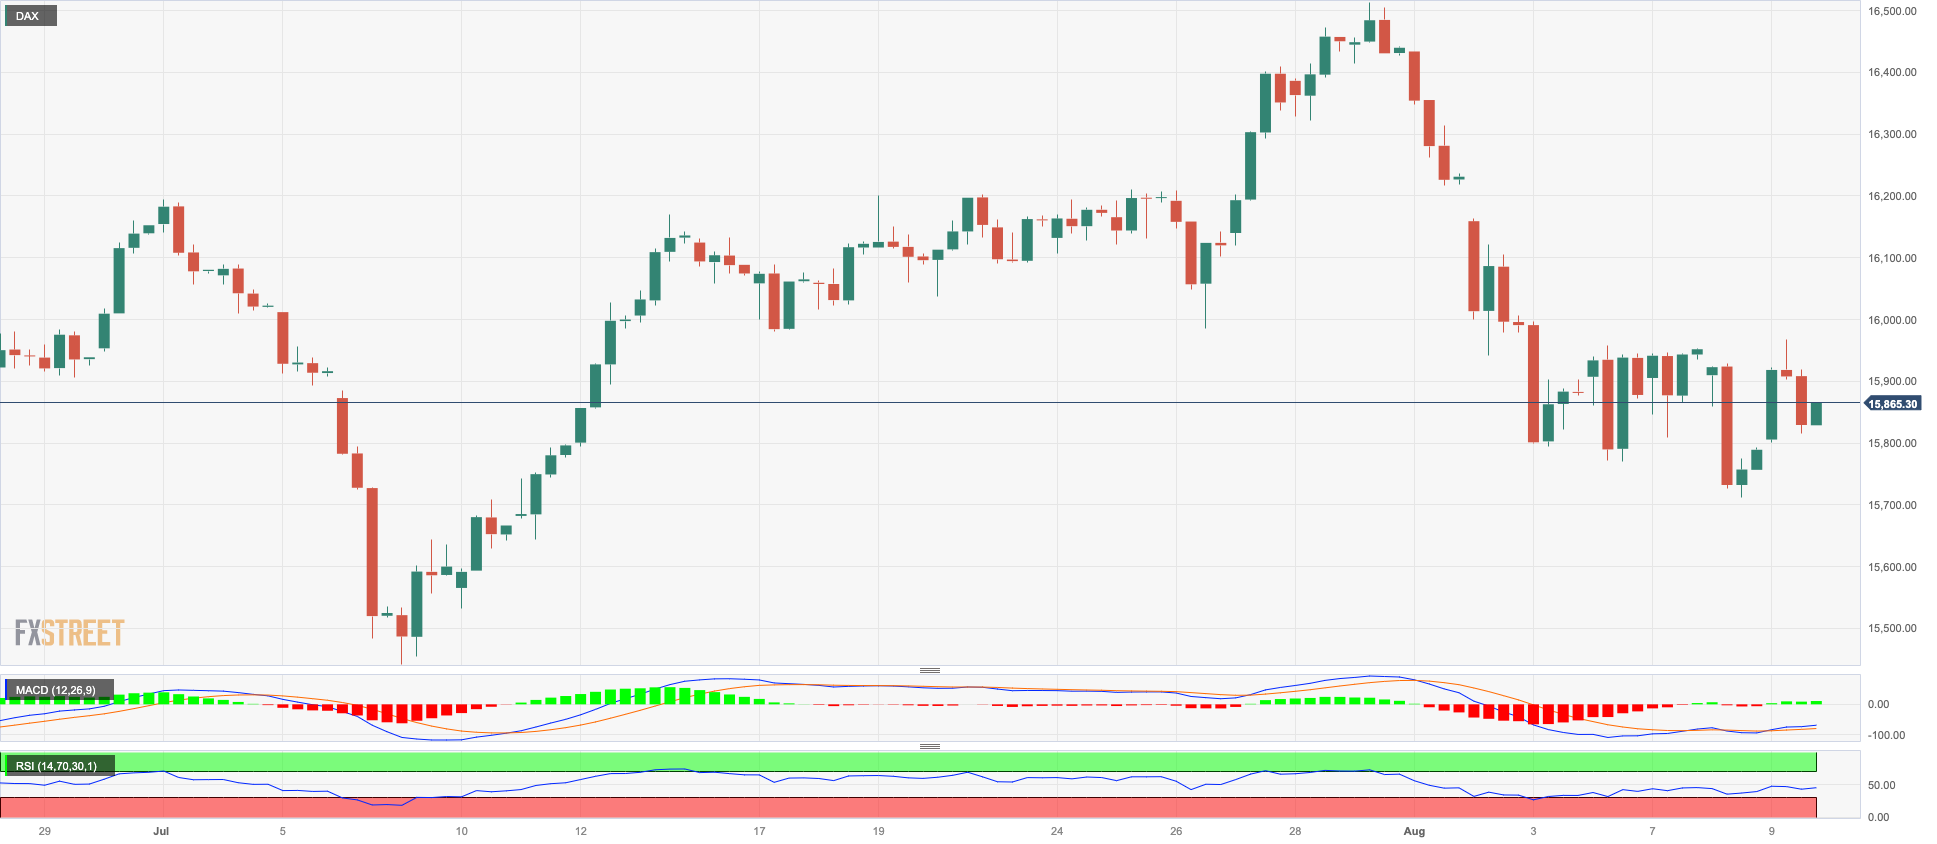
GER40
German stocks, as measured by the DAX40 index, managed to bounce back from two consecutive days of decline and recorded substantial gains on Wednesday. In the process, they reclaimed the 15800 level.
The rebound was primarily spearheaded by the recovery of European banks, who responded to the Italian government's announcement on Tuesday regarding a special tax imposed on its domestic banks.
The prevailing optimism within the banking sector across Europe appeared strong enough to counterbalance worries arising from the Chinese economy. These concerns had been heightened following the release of inflation data in the country earlier in the same session.
The index's upward movement for the day was also mirrored by a resurgence in 10-year bund yields, which approached the vicinity of the 2.50% mark.
Extra weakness might lead the DAX40 to breach the August low of 15706 (August 8) and allow for a further slide to the July bottom of 15456 (July 7) ahead of the critical 200-day SMA of 15283. If this zone is breached, the index is anticipated to fall to the March low of 14458 (March 20) before plummeting to the December 2022 low of 13791 (December 20) and the 2022 low of 11862 (September 28). Prior reaching the record high of 16528 (July 31), however, there is a preliminary barrier at the 55-day SMA at 16024. The daily RSI improved past the 42 mark.
Best Performers: Vonovia, Sartorius AG VZO, Brenntag AG
Worst Performers: Zalando SE, Siemens Energy AG, E.ON SE
Resistance levels: 16020 16146 16528 (4H chart)
Support levels: 15706 15456 14809 (4H chart)
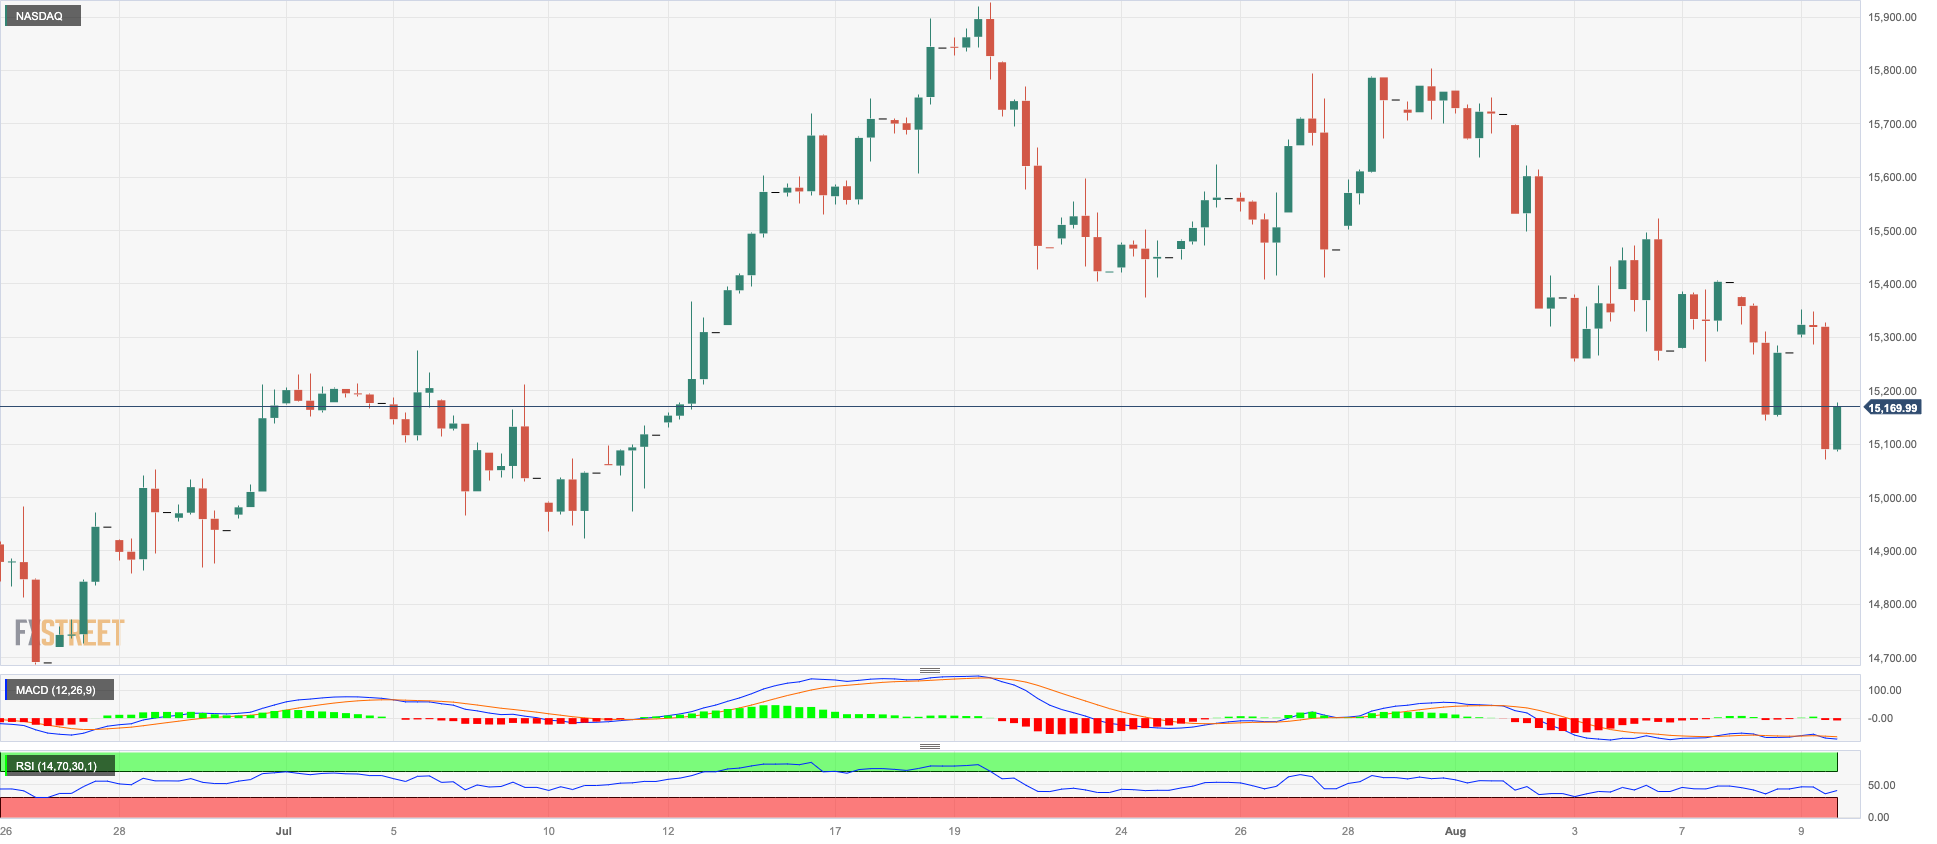
NASDAQ
On Wednesday, selling pressure continued to push the tech-heavy Nasdaq 100 down to a four-week low near the key 15000 mark, down for the second straight session.
Concerns about the US banking industry (following Moody’s move), coupled with the dollar's late recovery and growing uneasiness ahead of the release of US inflation data on Thursday, seem to have dampened investor sentiment midweek.
Extra losses in the Nasdaq 100 are now expected to challenge the temporary 55-day SMA at 15006, prior to the July low of 14924 (July 10). If this region falls, the index may slip back to weekly lows of 14687 (June 26), 14283 (June 7), and 13520 (May 24). The May low of 12938 (May 4) appears bolstered by the crucial 200-day SMA at 12916 and comes ahead of the April low of 12724 (April 25). On the opposite hand, the weekly high of 15803 (July 31) stands in the way of the 2023 high of 15932 (July 19) and the round level of 16000. The RSI on a daily basis dropped to the proximity of 45.
Top Gainers: Baker Hughes, Moderna, Regeneron Pharma
Top Losers: NVIDIA, Lucid Group, The Trade Desk
Resistance levels: 15795 15932 16017 (4H chart)
Support levels: 15078 14924 14687 (4H chart)
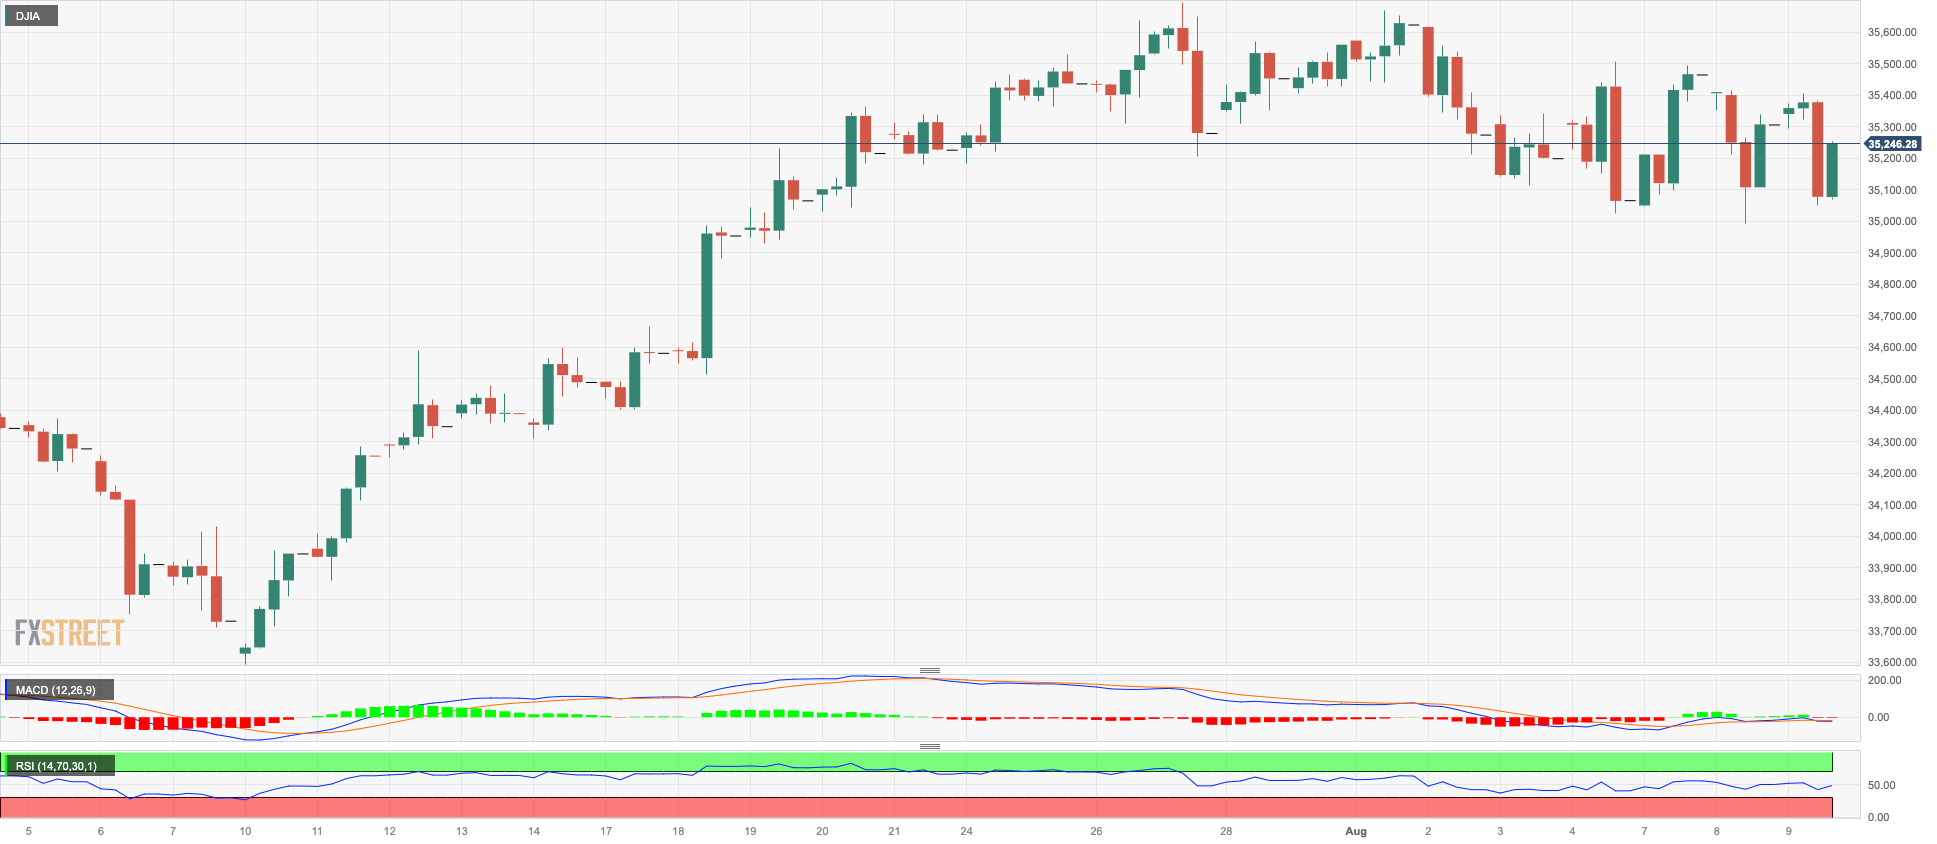
DOW JONES
US stocks measured by the Dow Jones fell further, extending Tuesday's losses, as investors turned cautious ahead of the closely watched US July inflation report due out on Thursday.
Investors also fretted after Moody's downgraded several small banks on Tuesday and placed six major lenders on review for a possible downgrade.
Adding to the overall hesitancy, entertainment giant Walt Disney is set to report its earnings after the market close on Wednesday, keeping many investors on the sidelines.
Overall, the Dow Jones lost 0.19% to 35263, the S&P500 dropped 0.27% to 4486, and the tech-heavy Nasdaq Composite retreated 0.68% to 13788.
Immediately to the upside for the Dow Jones is the 2023 high of 35679 (August 1), followed by the February 2022 high of 35824 (February 9) and the all-time top of 36952 (January 5, 2022). Just the opposite, the initial support level aligns at the August low of 35007 (August 8) prior to the transitory 55-day and 100-day SMAs at 34283 and 33851, respectively, ahead of the July low of 33705 (July 10) and the important 200-day SMA at 33584. The latter's breakdown reveals the May low of 32586 (May 25), followed by the 2023 low of 31429 (March 15). The everyday RSI fell to the sub-57 level.
Top Performers: Dow, Caterpillar, Coca-Cola
Worst Performers: Salesforce Inc, Intel, Goldman Sachs
Resistance levels: 35679 35824 36513 (4H chart)
Support levels: 35007 34387 33705 (4H chart)
MACROECONOMIC EVENTS

All Information & Updates provided by:

All information relating to the financial markets available on this page has been prepared and issued by FXStreet (Forexstreet SL, Spain, Reg: B62498233) on the basis of publicly available information and all information believed to be reliable and does not conflict with Kuwaiti local laws, and all necessary care has been taken to before the company to ensure that the facts mentioned are correct from the source.
NCM Investment nor any of its directors or employees shall in any way be held responsible for the contents of this news, and the information contained on this page is intended only to provide clients with publicly available information and should not be construed as investment advice, report or analysis and/or constitute an offer or invitation to buy or sell financial instruments of any kind.
RISK WARNING: Forex and CFDs are highly risky leveraged products, as losses can exceed deposits. Please ensure you understand all the risks and take independent advice if necessary. NCM will segregate the clients based on the criteria of the regulator and its bylaws. NCM does not provide any advisory service; the material published does not constitute advice or a recommendation for a transaction in any financial instrument. NCM accepts no responsibility for any use of the content presented and any consequences of that use. Anyone acting on the information provided does so at their own risk.