
- Contact Us:
-

-

-

-


Daily Market Updates
11 Aug 2023
USDJPY
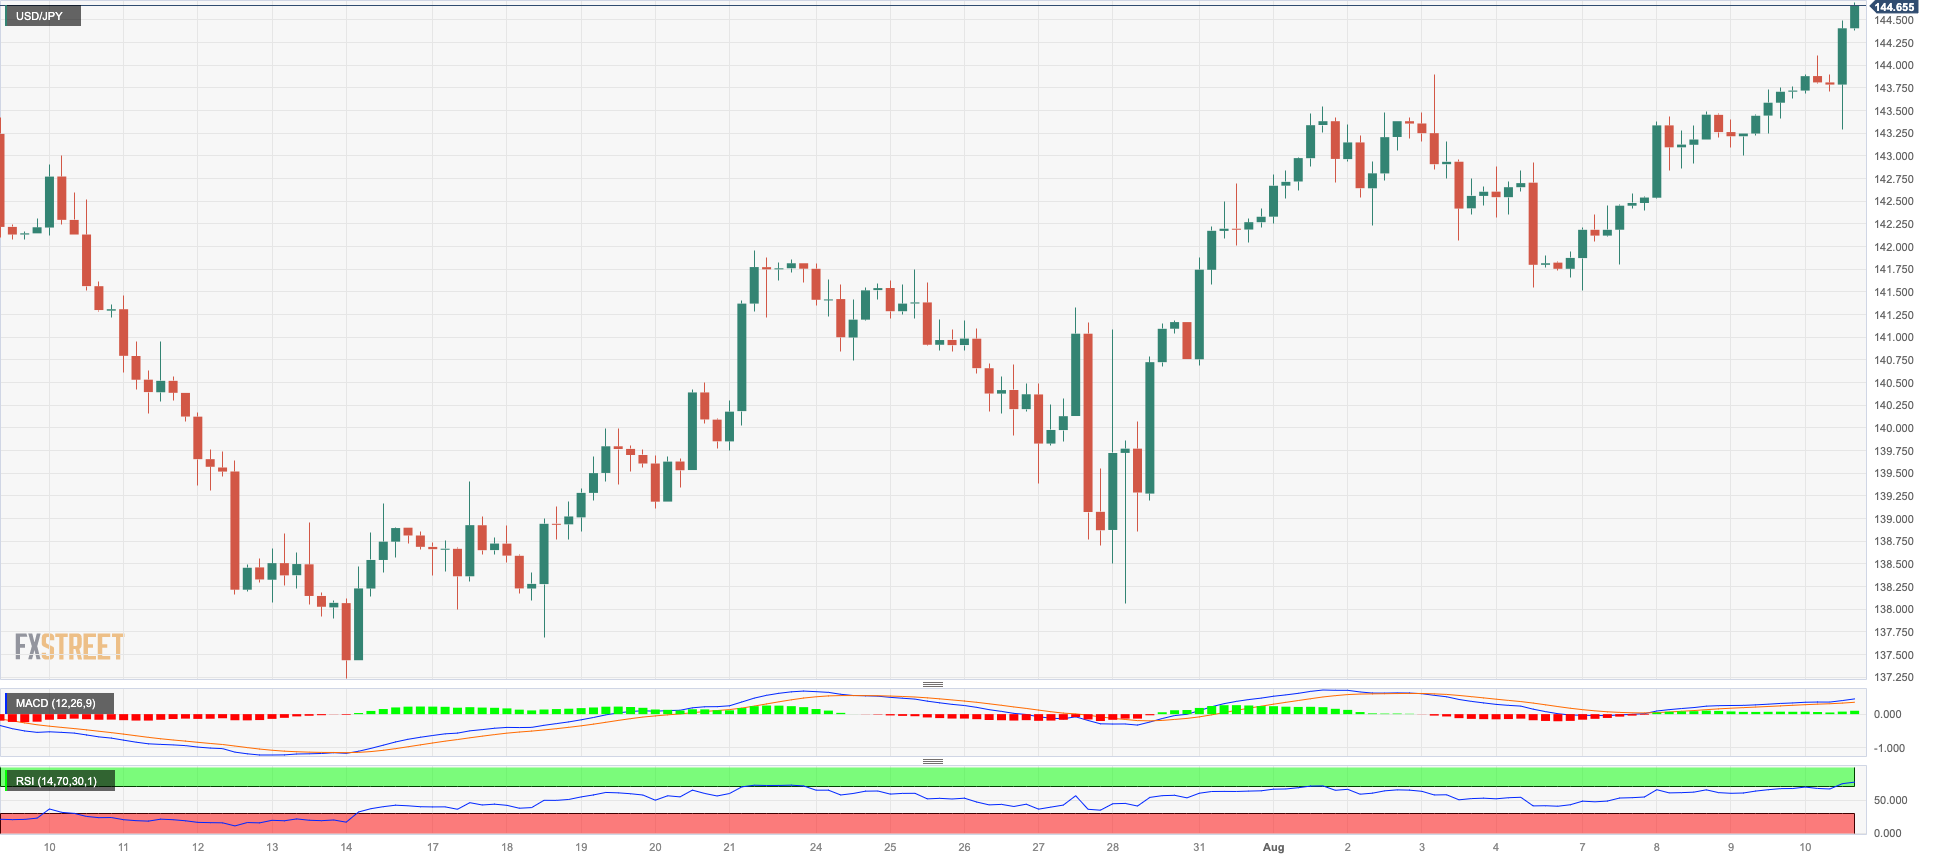
On Thursday, USD/JPY extended the weekly uptrend and reached new five-week highs near 144.70, as the greenback made a sharp U-turn along with the late rebound in US yields across different maturities.
In the Japanese debt market, the JGB 10-year yields advanced modestly for the first time since last Friday.
Data-wise in Japan, the latest data showed a slight increase of 0.1% in monthly Producer Prices for July, and a 3.6% gain over the past year. Additionally, Foreign Bond Investment rose by ¥438.8B in the week ending August 5, according to the usual weekly report.
The next up barrier for USD/JPY emerges at the August high of 144.69 (August 10), followed by the 2023 top of 145.07 (June 30) and the 2022 peak of 151.94 (October 21). On the other hand, the August low of 141.50 (August 7) appears propped up by the provisional 55-day SMA at 141.39 ahead of the weekly lows of 138.05 (July 28) and 137.23 (July 14). If the latter is breached, spot could challenge the key 200-day SMA of 136.46 before the weekly low of 133.01 (April 26), the minor support of 132.01 (April 13) and the round mark of 130.00. The RSI climbed to the proximity of the 64 zone.
Resistance levels: 144.69 144.91 145.07 (4H chart)
Support levels: 143.25 142.86 141.94 (4H chart)
GBPUSD
The British pound and risk assets in general saw a significant reversal on Thursday, soon after the release of US inflation results for the month of July.
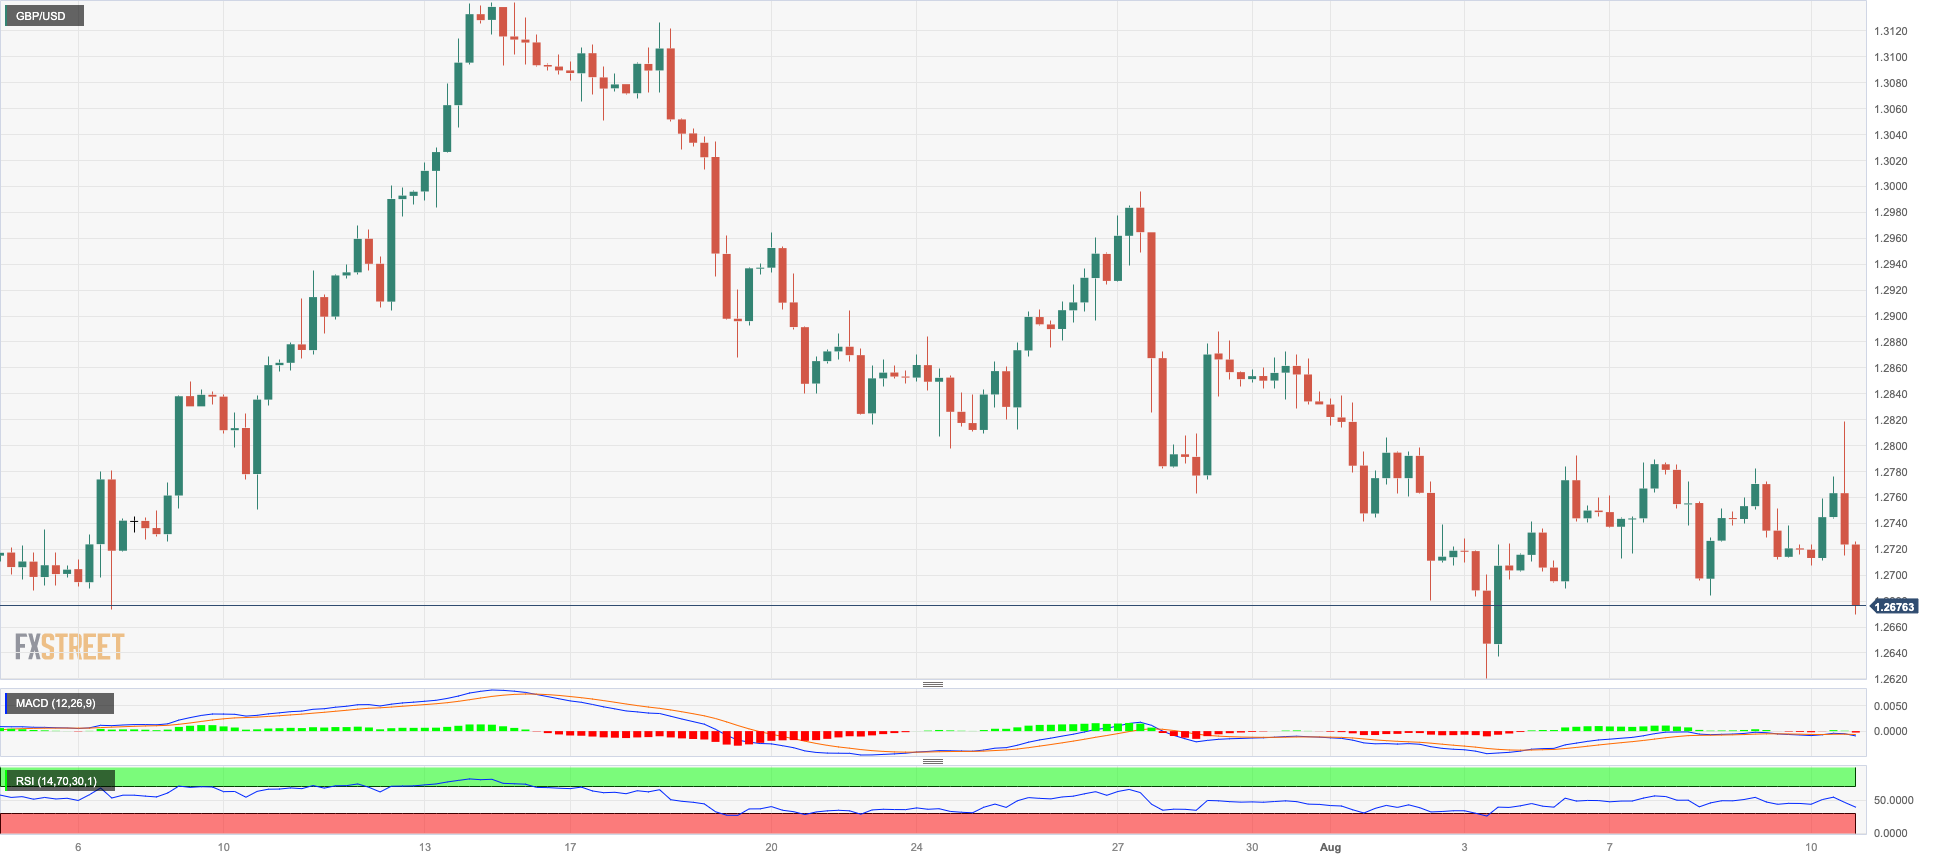
That said, GBP/USD rapidly left behind earlier gains to the area beyond 1.2800 the figure and added to the weekly leg lower, eventually ending the session well south of the 1.2700 yardstick.
In the UK, RICS House Price Balance dropped 53% in July, indicating that most surveyors reported a fall in house prices in their designated area.
If sellers regain control of sentiment, GBP/USD could recapture the August low of 1.2620 (August 3), followed by the weekly low of 1.2590 (June 29) and supported by the vicinity of the transitory 100-day SMA (1.2603). The 2021-2023 trendline is in the 1.2470 area and before the June low of 1.2368 (June 5) and the May low of 1.2308 (May 25), both of which appear to be supported by the crucial 200-day line SMA (1.2342). In contrast, the immediate upside barrier is at the weekly high of 1.2995 (July 27) prior to the 2023 high of 1.3142 (July 14). North of this are the weekly highs of 1.3146 (April 14 2022) and 1.3298 (March 15 2022). On the daily chart, the RSI deflated to the vicinity of the 41 level.
Resistance levels: 1.2818 1.2822 1.2888 (4H chart)
Support levels: 1.2684 1.2591 1.2368 (4H chart)
AUDUSD
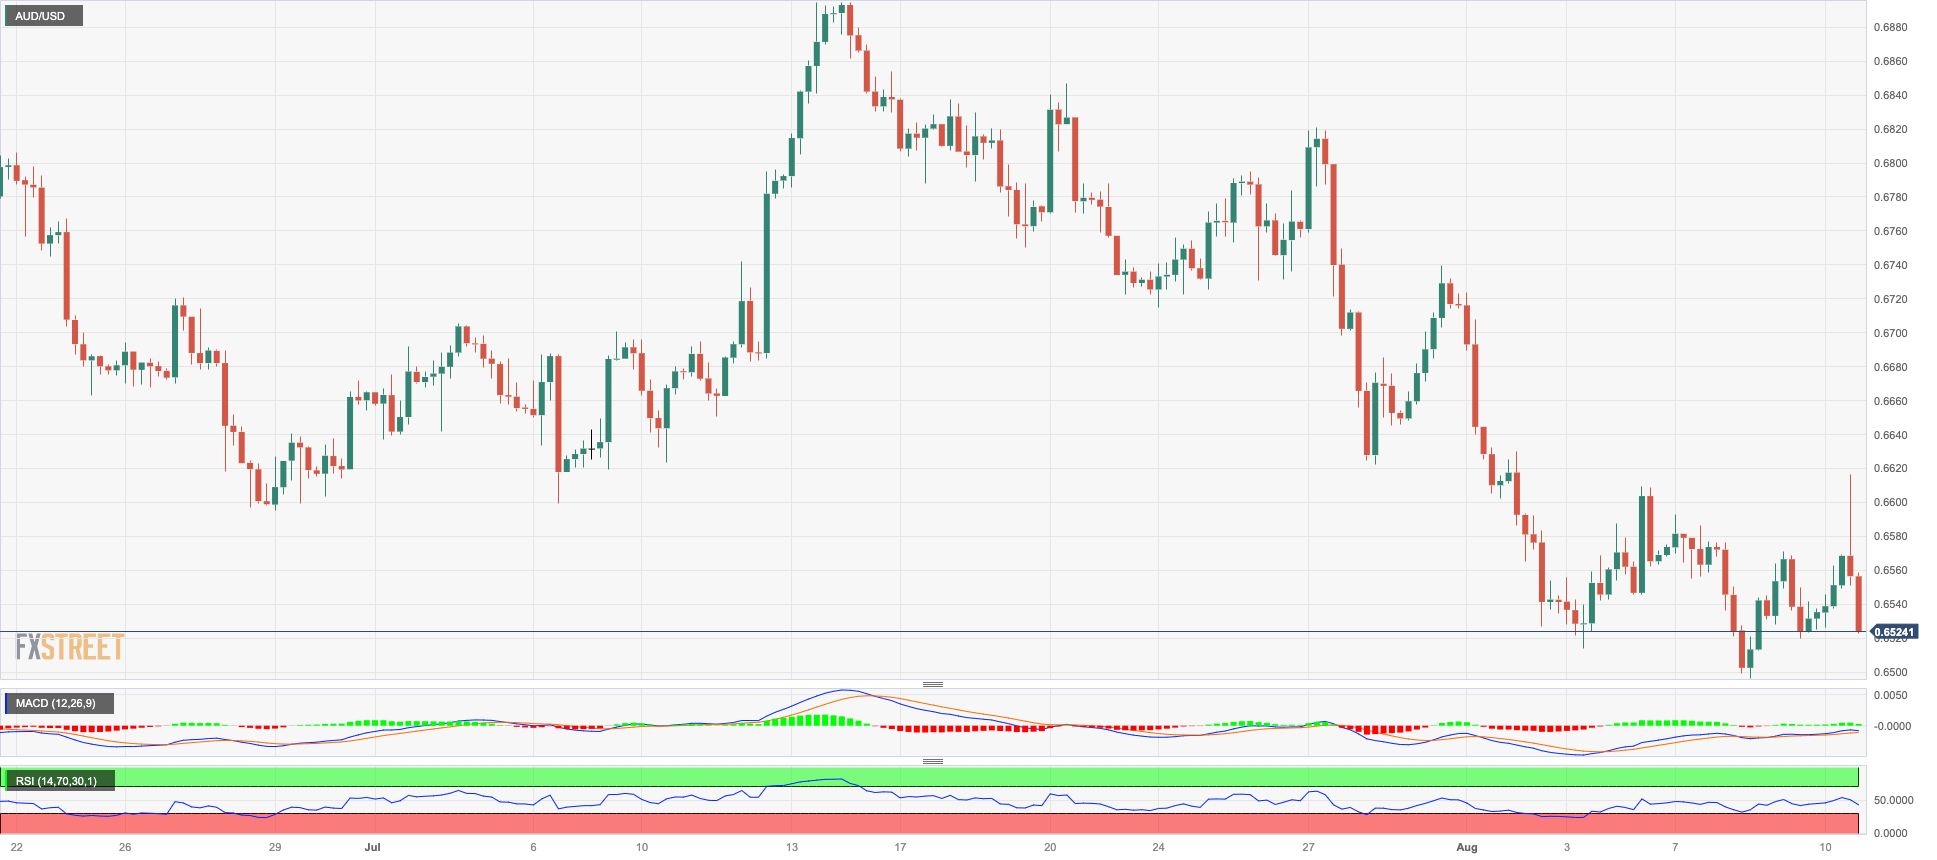
The Aussie dollar’s initial move to multi-day highs near 0.6620 was rapidly eroded along with the recovery in the greenback, particularly after the publication of July’s CPI in the US economy. The pair, therefore, clinched its third consecutive daily pullback and returned to the low-0.6500s as the closing bell in Wall Street approached.
Further weakness around the Aussie dollar came in response to the generalized bearish performance in the commodity complex, although the marginal bounce in prices of the iron ore did nothing to curb the pair’s downward bias.
In terms of economic data, Australia's Consumer Inflation Expectations for August showed a slight decrease to 4.9% from the previous month's figure of 5.2%.
The immediate goal for additional declines in the AUD/USD is the August low of 0.6496 (August 8). A break of this level might pave the way for a test of the 2023 low of 0.6458 (May 31) before the November 2022 bottom of 0.6272 (November 3) and the 2022 low of 0.6179 (October 13). On the contrary, an intermediate hurdle exists between the 55-day SMA of 0.6686 and the critical 200-day SMA of 0.6736. Further up, the July high of 0.6894 (July 13) appears, just ahead of the June top of 0.6899 (June 16). If the pair breaks out of this area, it will be able to hit the important 0.7000 yardstick prior to the weekly peak of 0.7029 (February 14) and the 2023 high of 0.7157 (February 2). The everyday RSI slipped back to the 36 zone.
Resistance levels: 0.6616 0.6683 0.6739 (4H chart)
Support levels: 0.6496 0.6458 0.6386 (4H chart)
GOLD
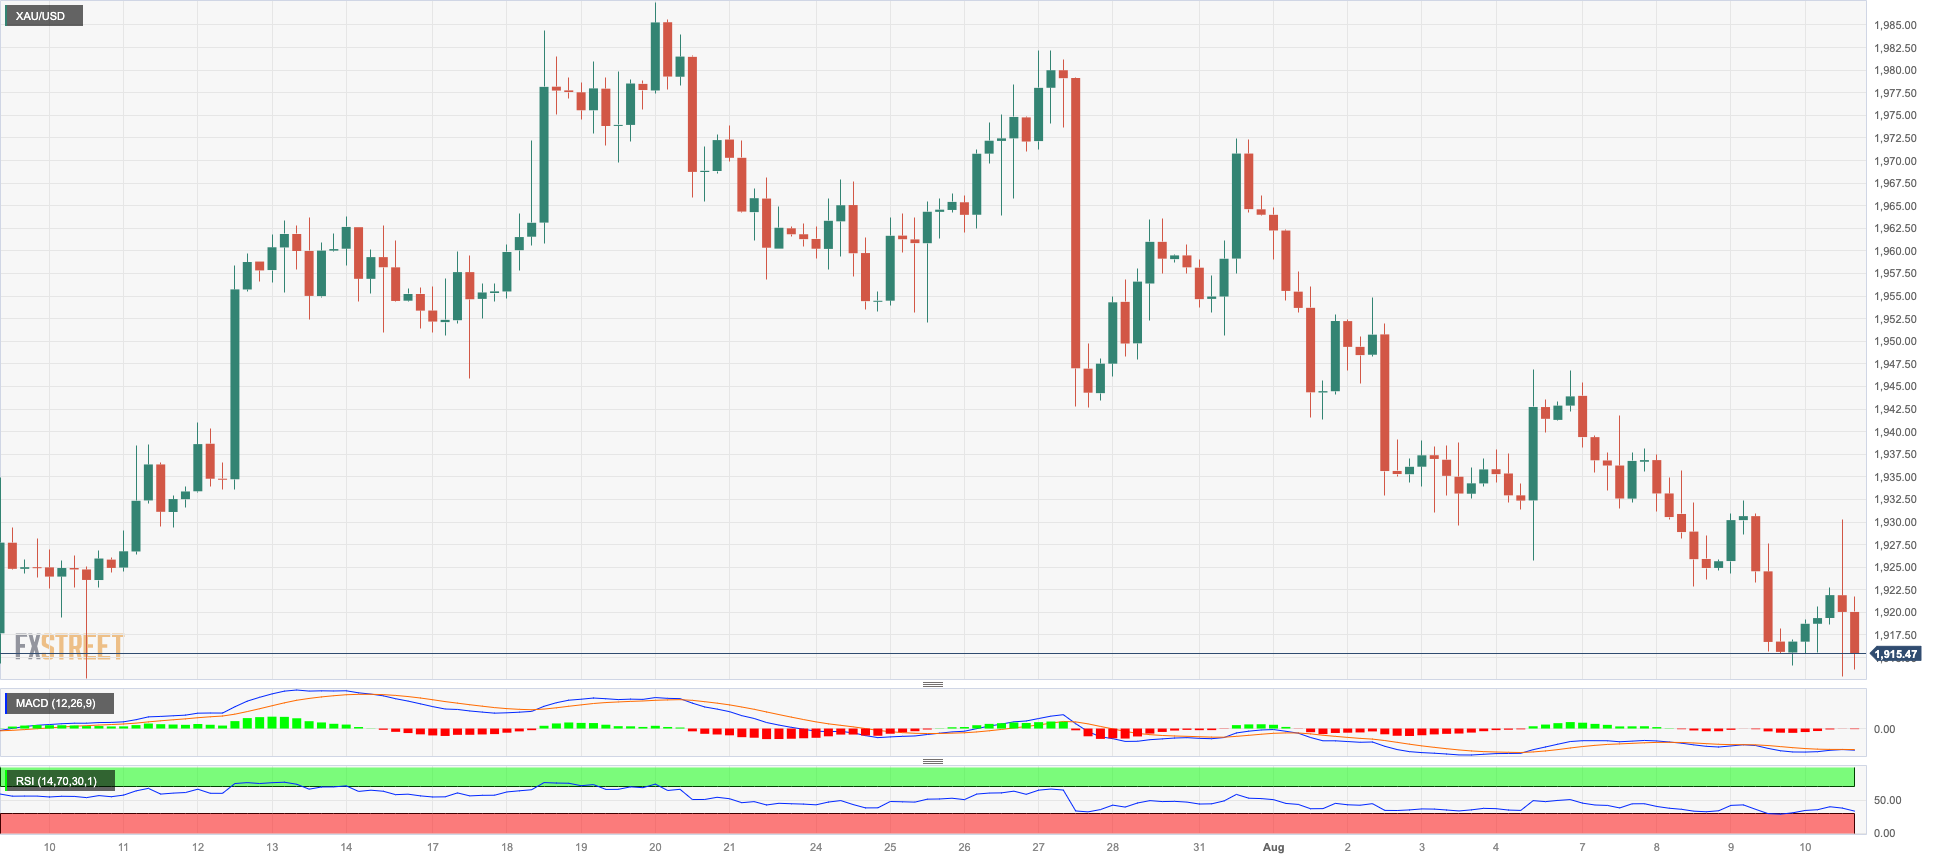
Gold prices could not sustain the earlier uptick to the $1930 region per troy ounce and returned to the area of recent lows near $1910 on Thursday.
The late bounce in the greenback jeopardized the bullish attempt in the yellow metal, while the equally strong comeback of US yields also weighed on bullion’s price action and left the metal navigating its fourth consecutive daily pullback.
Moving forward, continued disinflationary forces in the US should maintain expectations for a prolonged halt in the Fed's normalization process largely supported for the time being, which should in turn morph into further recovery in gold prices.
Additional declines in gold prices are still possible despite the daily bounce. In fact, the next major support level is at $1900, followed by the June low of $1893 (June 29), which seems to be supported by the 200-day SMA at $1898. From here, the 2023 low of $1804 (February 28) and the key support level of $1800 appear. On the other hand, temporary resistance exists at the 55-day and 100-day SMAs of $1943 and $1967, respectively, ahead of the July high of $1987 (July 20). If this level is breached, the price may escalate to the critical level of $2000. Beyond that is the likely path to the 2023 peak of $2067 (May 4), which emerges before the 2022 high of $2070 (March 8), and seconded by the record top of $2075 (August 7 2020).
Resistance levels: $1946 $1954 $1972 (4H chart)
Support levels: $1912 $1902 $1893 (4H chart)
CRUDE WTI
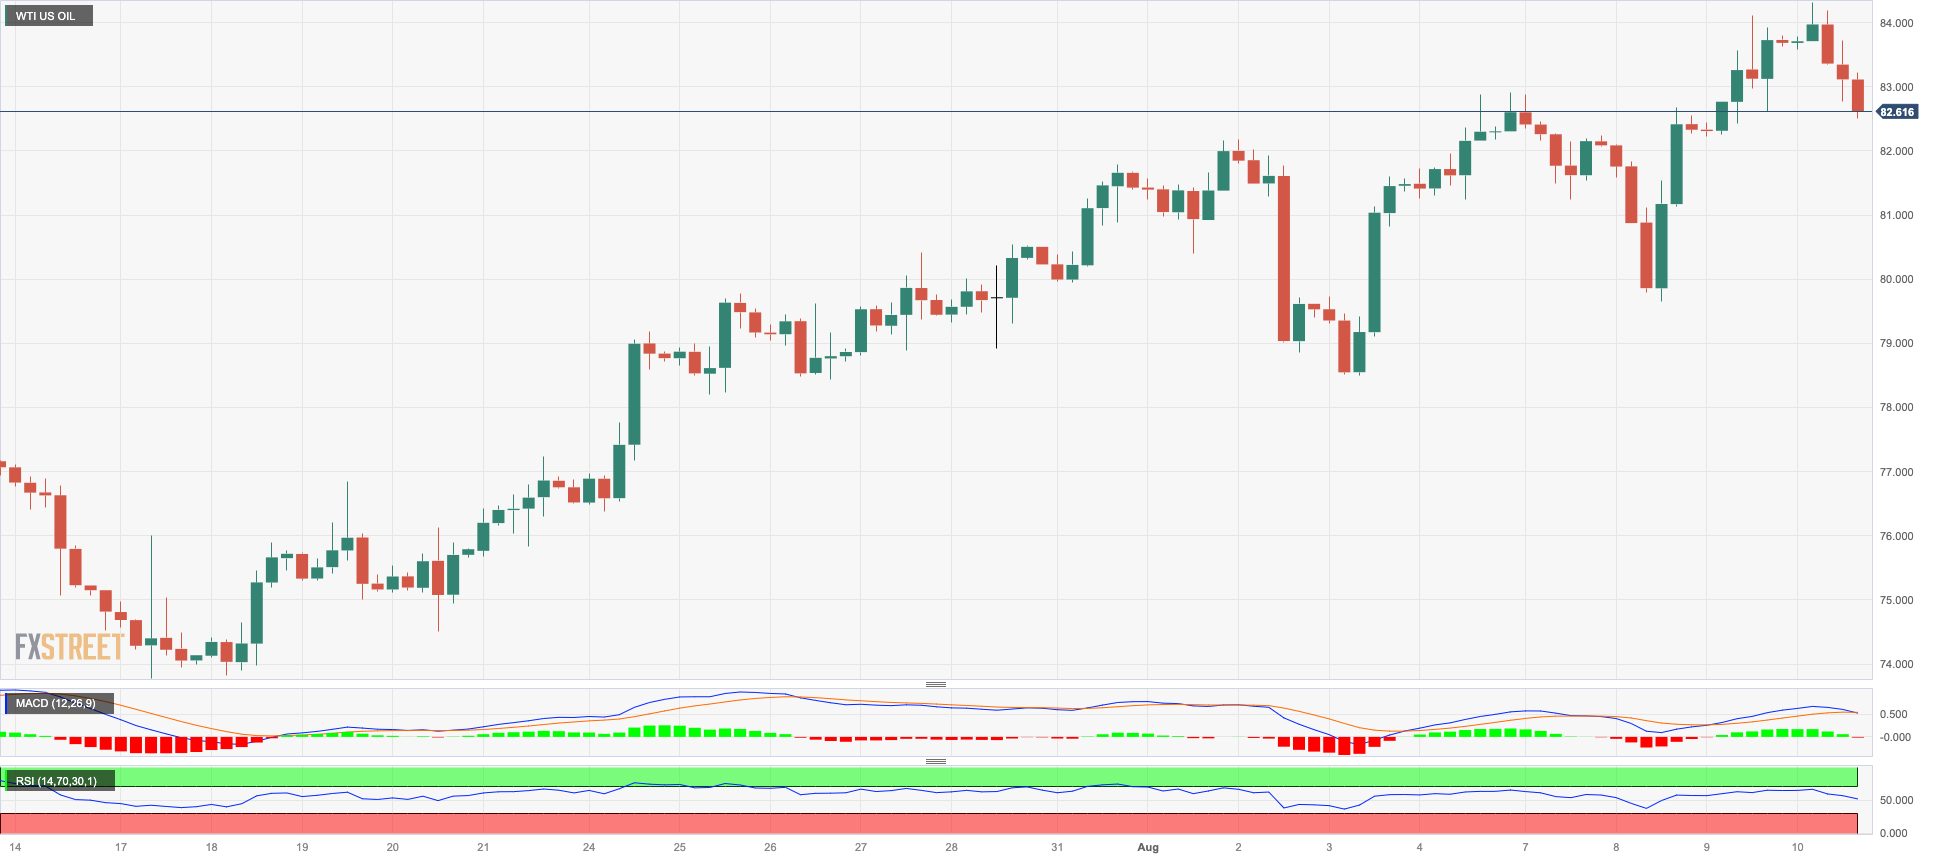
Following the attainment of new highs reminiscent of levels last seen in November 2022, WTI prices experienced a marked retreat during Thursday's trading session.
The daily decline can be attributed to concerns regarding demand, specifically influenced by China's deteriorating economic outlook. This development dampened traders' sentiment, leading to a corrective decrease in commodity prices coupled with a desire to secure profits.
On the latter, it is worth noting that WTI prices are currently on track to conclude their seventh consecutive week of gains. Additionally, since reaching the lows of around $67.00 per barrel in June, they have already surged by approximately 27%.
Next on the upside for WTI prices comes the 2023 high of $84.85 (August 10) followed by the November 2022 high of $93.73 (November 7) and the weekly top of $97.65 (August 30, 2022). Having said that, there is initial contention at the August low of $78.74 (August 4) ahead of the key 200-day SMA of $76.46 and the weekly low of $73.89 (July 17). If this level is cleared, the intermediate 100-day and 55-day SMAs of $74.58 and $74.16, respectively, are exposed. If WTI goes below this level, it may hit the June low of $66.86 (June 12) before descending to the 2023 low of $63.61 (May 4). South from here, the December 2021 low of $62.46 (December 2) is found before hitting the key $60.00 mark per barrel.
Resistance levels: $84.85 $88.5 $90.08 (4H chart)
Support levels: $82.67 $79.89 $78.66 (4H chart)
GER40
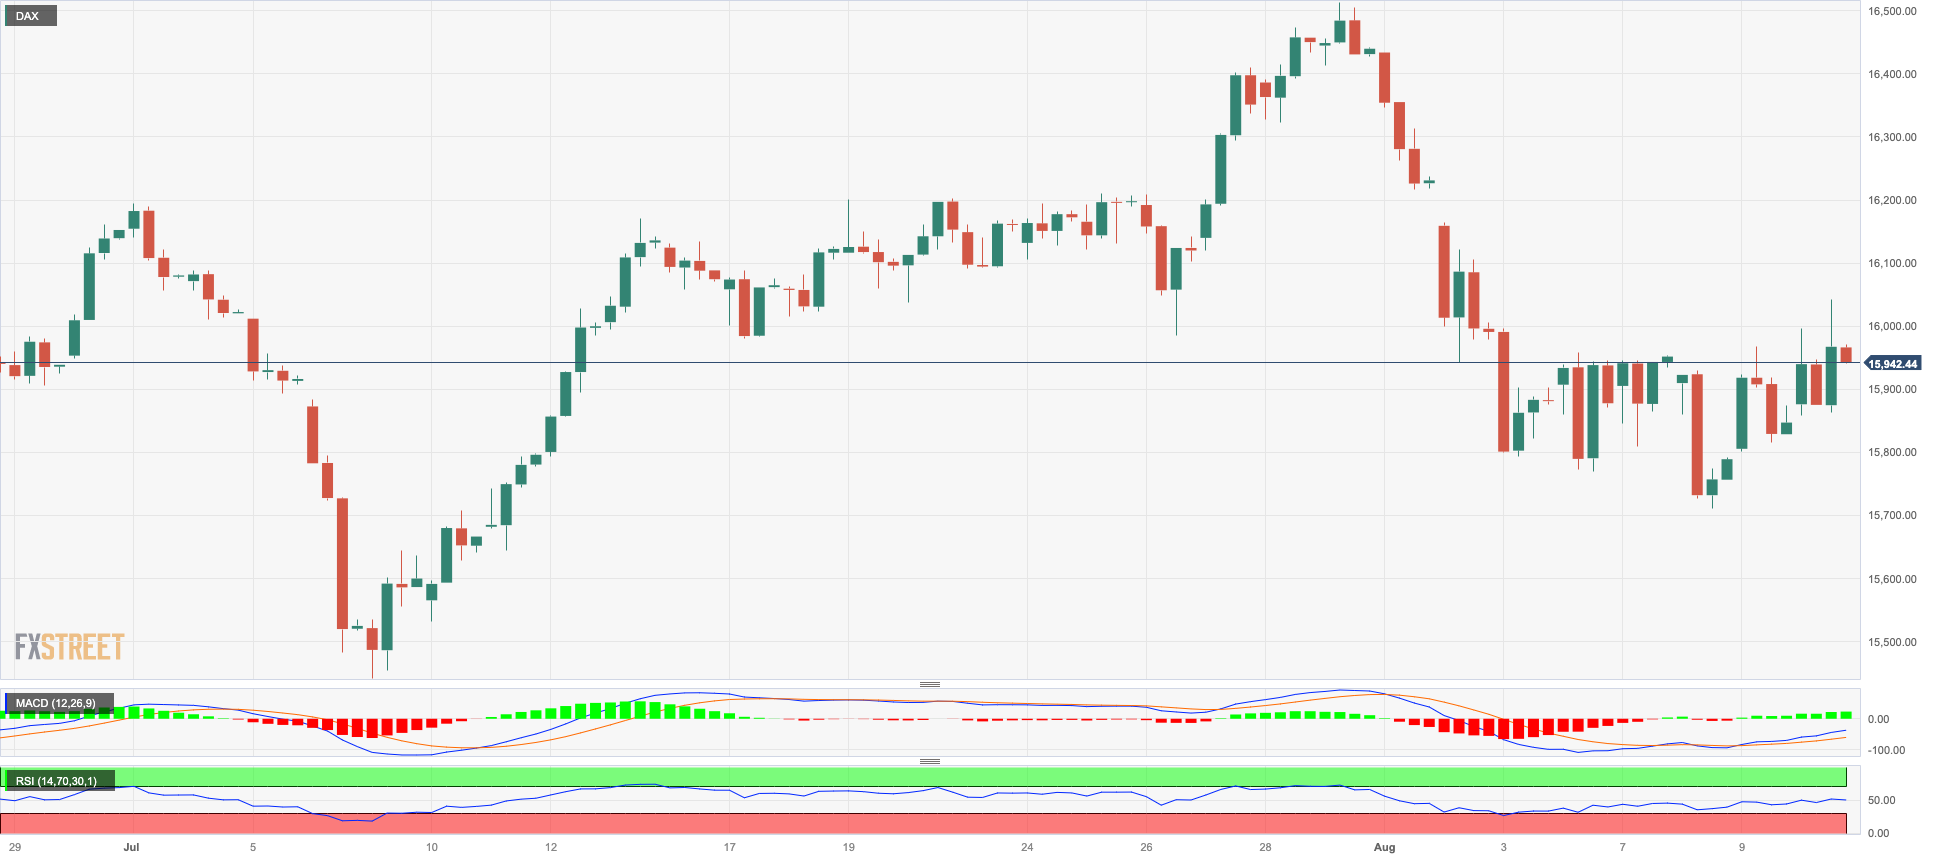
The German benchmark index DAX40 continued its recovery on Thursday, closing just below the key 16,000 level.
The positive sentiment among traders in the region was reflected in the positive performance of corporate earnings reports, while the lower-than-expected US inflation figures in July also contributed to the constructive mood.
In line with the daily improvement in the index, the German 10-year bund yields rose for the second day in a row, advancing further north of the 2.50% level.
The persistent recovery in the DAX40 sees the next hurdle of note at the all-time peak of 16528 (July 31). Just the opposite, the resumption of the selling bias may push the index below the August low of 15706 (August 8) and allow for a further drop to the July low of 15456 (July 7), which lies ahead of the crucial 200-day SMA of 15297. If this zone is violated, the index is expected to fall to the March low of 14458 (March 20), before falling to the December 2022 low of 13791 (December 20) and the 2022 low of 11862 (September 28). The daily RSI climbed past the 48 barrier.
Best Performers: Allianz, Fresenius SE, Hannover Rueck SE
Worst Performers: Siemens AG, Siemens Energy AG, Qiagen
Resistance levels: 16060 16146 16528 (4H chart)
Support levels: 15706 15456 14809 (4H chart)
NASDAQ
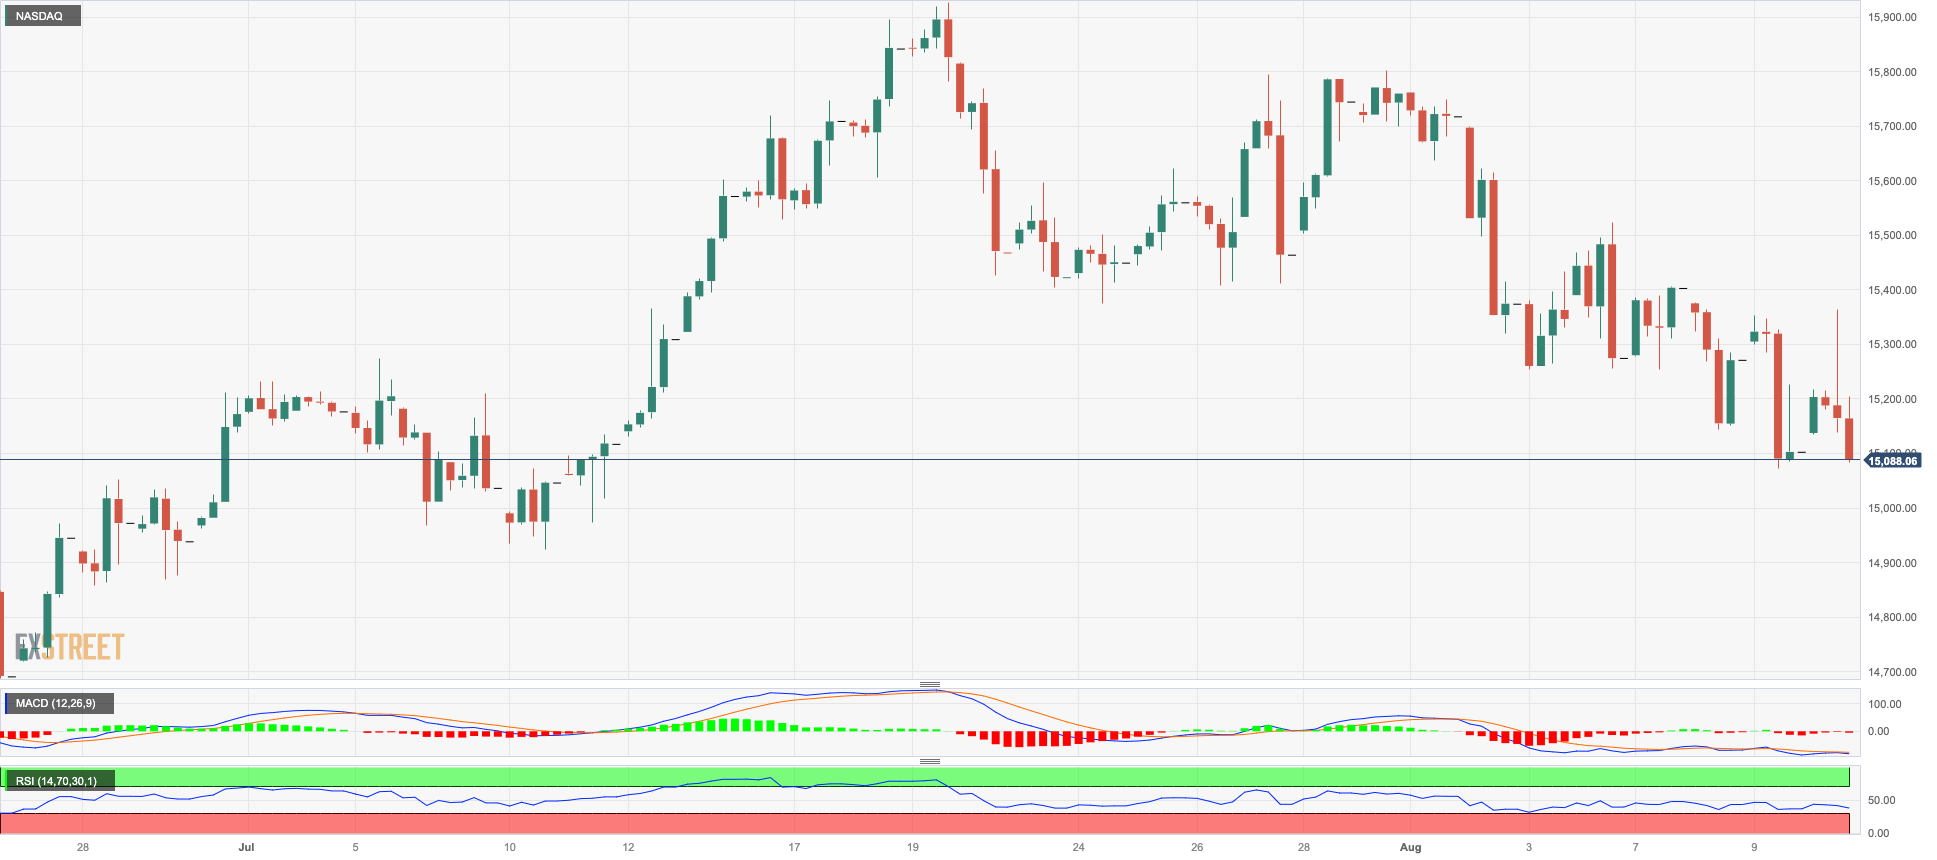
Aligned with its counterparts in the United States, the technology-centric Nasdaq 100 counteracted a portion of its recent two-day decline on Thursday, charting humble gains slightly above the 15000 level.
This tepid progression can be attributed to increased confidence that the Federal Reserve might pause its current trend of raising interest rates. This sentiment arises amidst indications that certain investors have already begun factoring in the possibility of interest rate reductions in the beginning of 2024.
Furthermore, the inflation data for July fell short of predictions, which further reinforced the notion of a potential change in interest rate direction. This sentiment was also supported by the ongoing improvement in the labour market conditions, as evidenced by the weekly jobless claims figures.
Extra Nasdaq 100 losses are now likely to test the temporary 55-day SMA at 15006, prior to the July low of 14924 (July 10). If this area collapses, the index may return to weekly lows of 14687 (June 26), 14283 (June 7), and 13520 (May 24). The May low of 12938 (May 4) looks to be supported by the important 200-day SMA at 12916, and it is higher than the April low of 12724 (April 25). The weekly high of 15803 (July 31), on the other hand, remains in the way of the 2023 high of 15932 (July 19) and the round level of 16000. On a daily basis, the RSI decreased to around 45.
Top Gainers: MeradoLibre, Datadog, DexCom
Top Losers: The Trade Desk, Lucid Group, Baker Hughes
Resistance levels: 15795 15932 16017 (4H chart)
Support levels: 15077 14924 14687 (4H chart)
DOW JONES
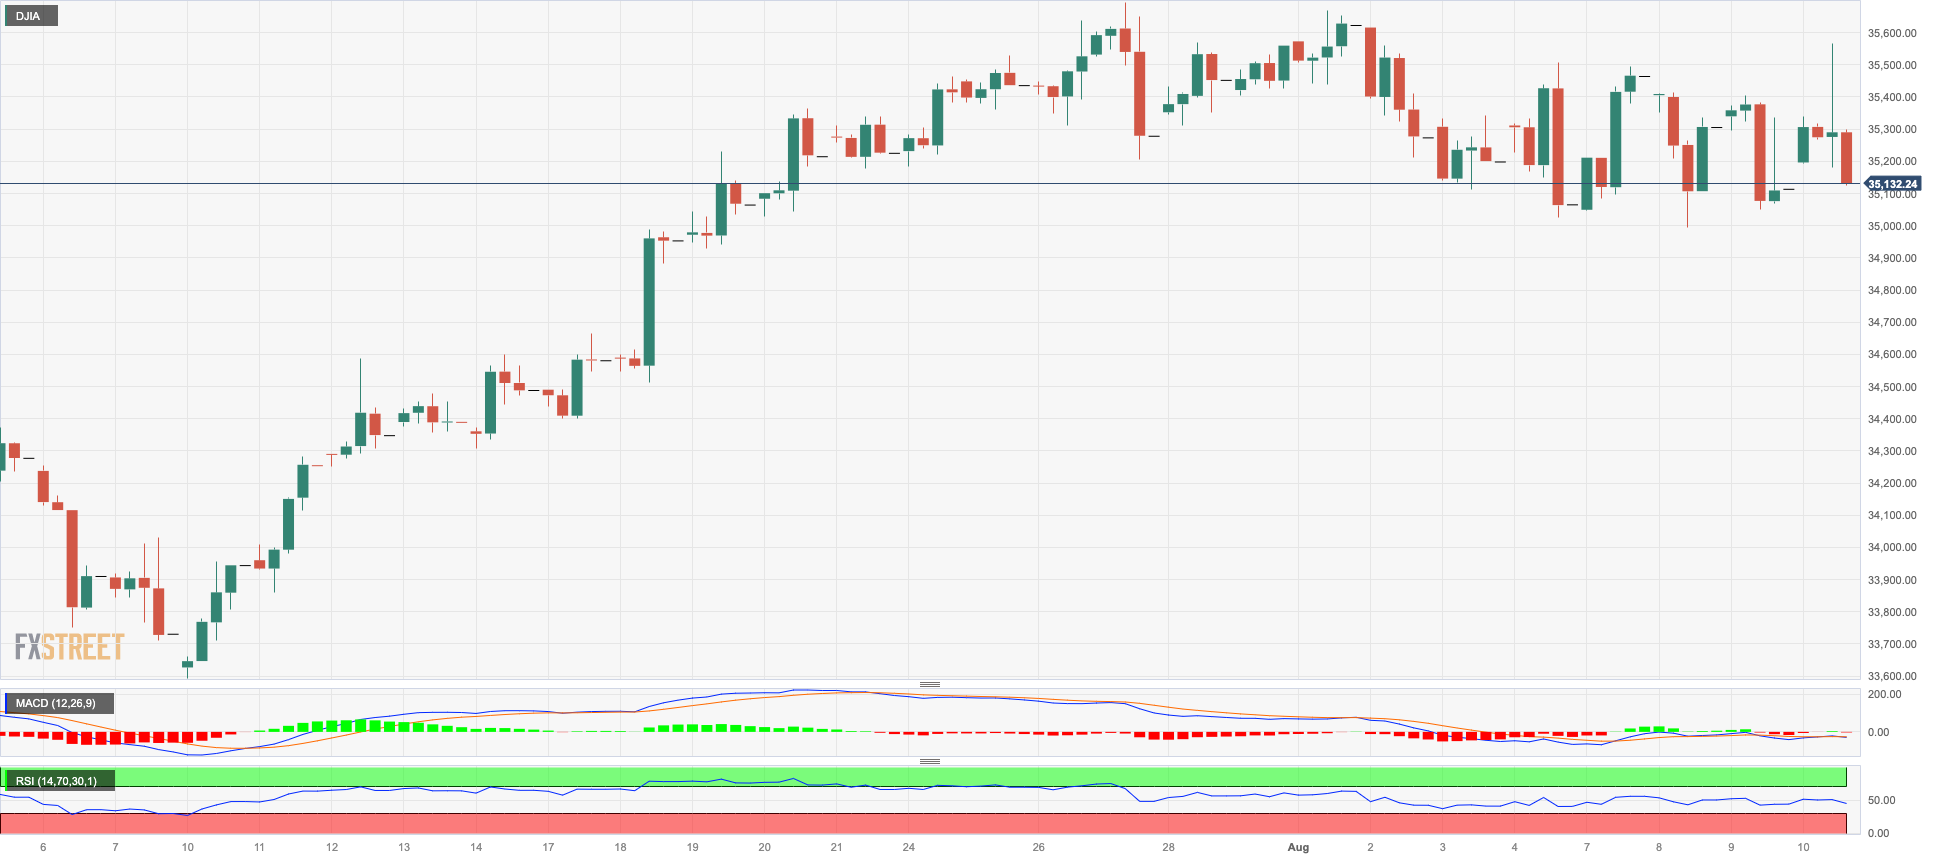
Persistent speculation that the Federal Reserve may have concluded its rate increase cycle seemed supported by softer-than-anticipated US inflation readings for July, morphing investor sentiment into renewed optimism.
Against this backdrop, the blue-chip stocks measured by the Dow Jones reversed two consecutive down days and closed Thursday with modest advances.
Adding to the buoyant mood were better-than-forecast weekly Initial Claims figures, further fueling the notion that cooling persisted in the American job market last week.
All in all, the Dow Jones gained 0.19% to 35263, the S&P500 rose 0.27% to 4486, and the tech-reference Nasdaq Composite advanced 0.68% to 13788.
For the Dow Jones, the 2023 high of 35679 (August 1) is immediately to the upside, followed by the February 2022 top of 35824 (February 9) and the all-time peak of 36952 (January 5, 2022). The initial support level, on the flip side, is aligned at the August low of 35007 (August 8), prior to the transitory 55-day and 100-day SMAs at 34318 and 33885, respectively, and ahead of the July low of 33705 (July 10), which precedes the significant 200-day SMA at 33604. The breakdown of the latter shows the May low of 32586 (May 25), ahead of the 2023 low of 31429 (March 15). The daily RSI reclaimed the 55 mark and beyond.
Top Performers: Walt Disney, Amgen, Intel
Worst Performers: Caterpillar, Nike, Goldman Sachs
Resistance levels: 35679 35824 36513 (4H chart)
Support levels: 35007 34430 33705 (4H chart)
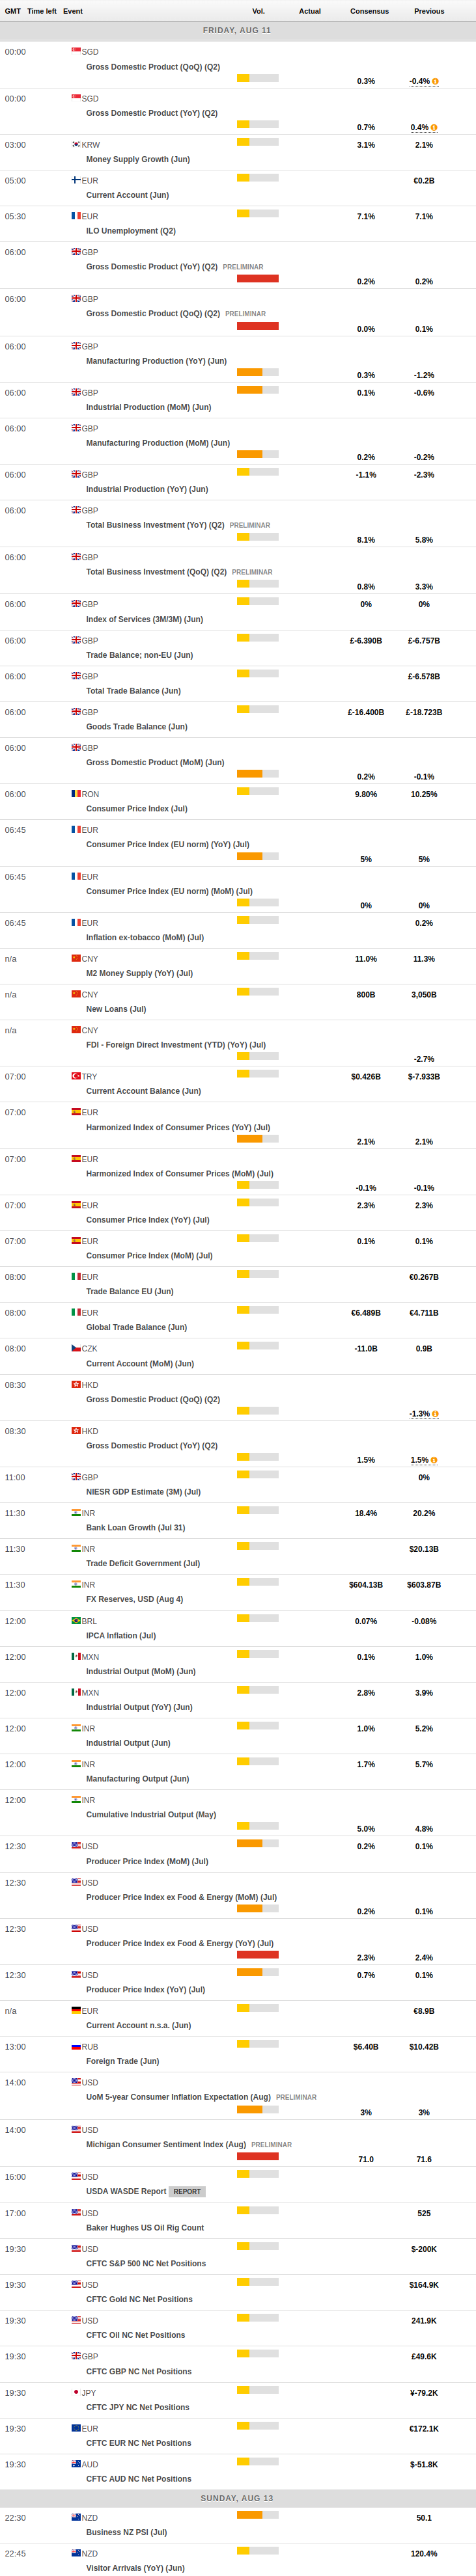
MACROECONOMIC EVENTS
All Information & Updates provided by:

All information relating to the financial markets available on this page has been prepared and issued by FXStreet (Forexstreet SL, Spain, Reg: B62498233) on the basis of publicly available information and all information believed to be reliable and does not conflict with Kuwaiti local laws, and all necessary care has been taken to before the company to ensure that the facts mentioned are correct from the source.
NCM Investment nor any of its directors or employees shall in any way be held responsible for the contents of this news, and the information contained on this page is intended only to provide clients with publicly available information and should not be construed as investment advice, report or analysis and/or constitute an offer or invitation to buy or sell financial instruments of any kind.
RISK WARNING: Forex and CFDs are highly risky leveraged products, as losses can exceed deposits. Please ensure you understand all the risks and take independent advice if necessary. NCM will segregate the clients based on the criteria of the regulator and its bylaws. NCM does not provide any advisory service; the material published does not constitute advice or a recommendation for a transaction in any financial instrument. NCM accepts no responsibility for any use of the content presented and any consequences of that use. Anyone acting on the information provided does so at their own risk.