
- Contact Us:
-

-

-

-


Daily Market Updates
14 Aug 2023
USDJPY
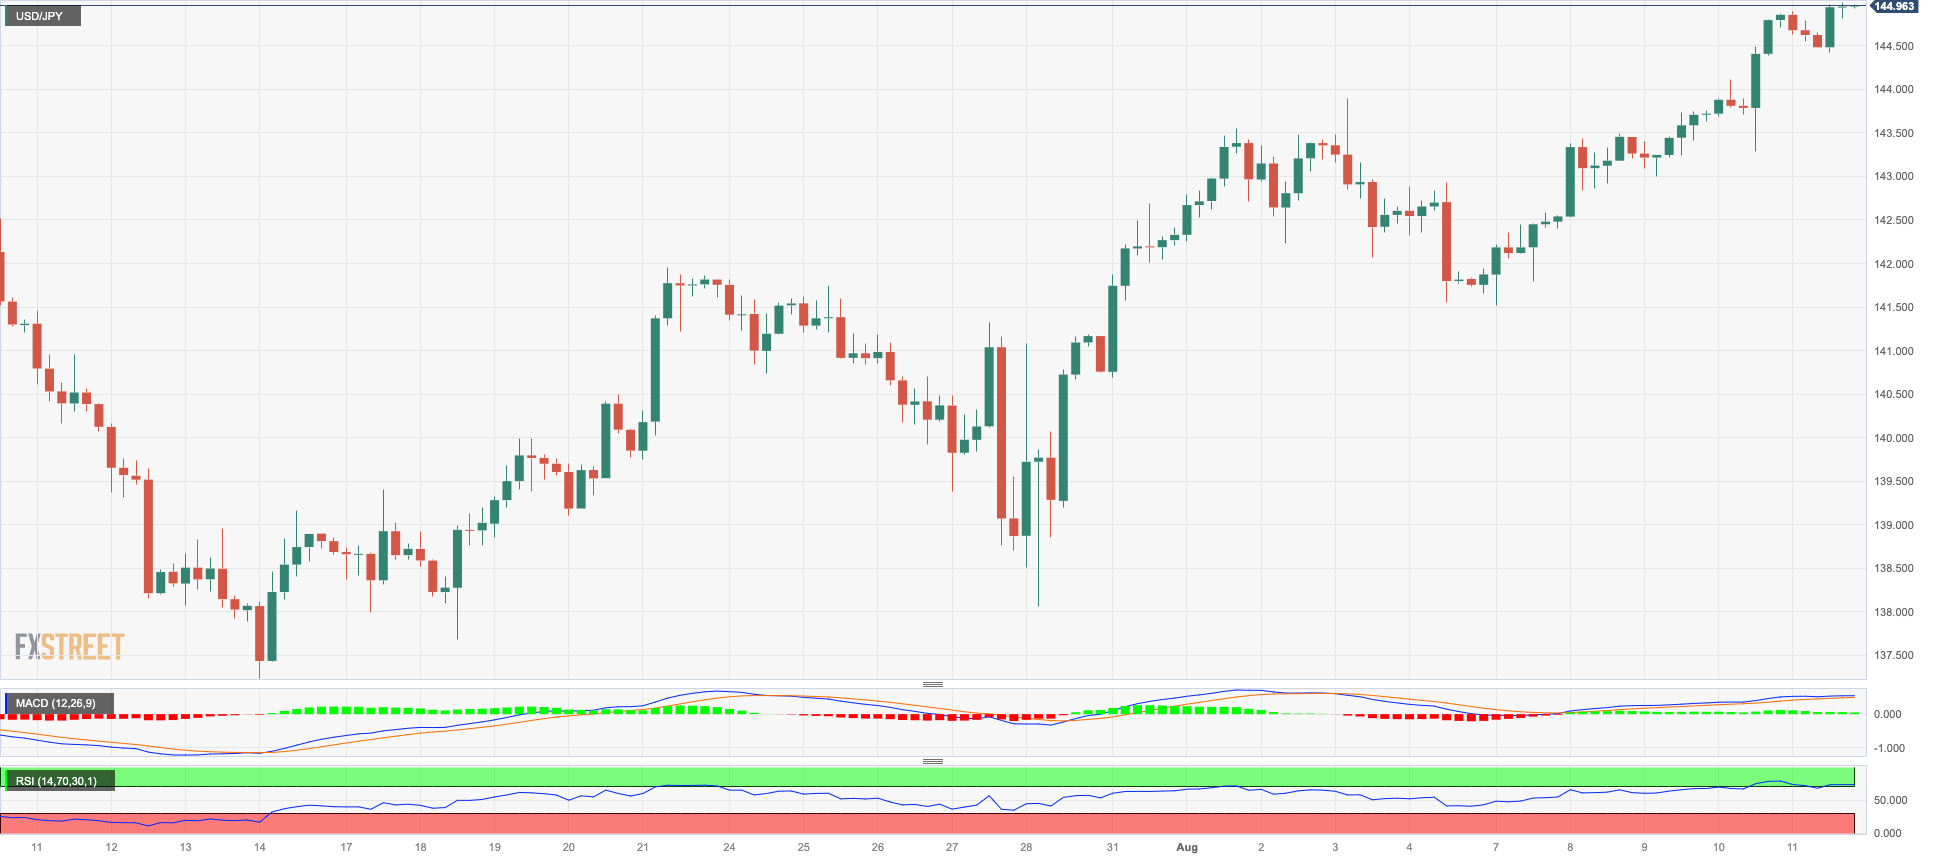
USD/JPY continued its upward trend for the week and achieved new six-week highs at 145.00. This was supported by a rebound in the greenback once again driven by positive data, as well as rising US yields across various timeframes.
The persistent inflation numbers in the US, this time reflected in the Producer Prices, provided additional strength to the buck and contributed to an increase in yields towards the end of the week. The combination of these factors, along with the lack of activity in Japanese markets due to the Mountain Day holiday, favoured further selling around the Japanese currency.
On Friday, there were no data releases in Japan.
The next resistance level for USD/JPY is at the 2023 high of 145.07 (June 30) followed by the 2022 top of 151.94 (October 21). On the flip side, the preliminary 55-day SMA at 141.49 looks to be supporting the August low of 141.50 (August 7) before the weekly low of 138.05 (July 28) and the July low of 137.23 (July 14). If the latter is broken, spot might test the critical 200-day SMA of 136.46 before the weekly low of 133.01 (April 26), the minor support of 132.01 (April 13), and the round mark of 130.00. The RSI trespassed the 65 barrier.
Resistance levels: 145.00 145.05 146.79 (4H chart)
Support levels: 143.25 141.97 141.50 (4H chart)
GBPUSD
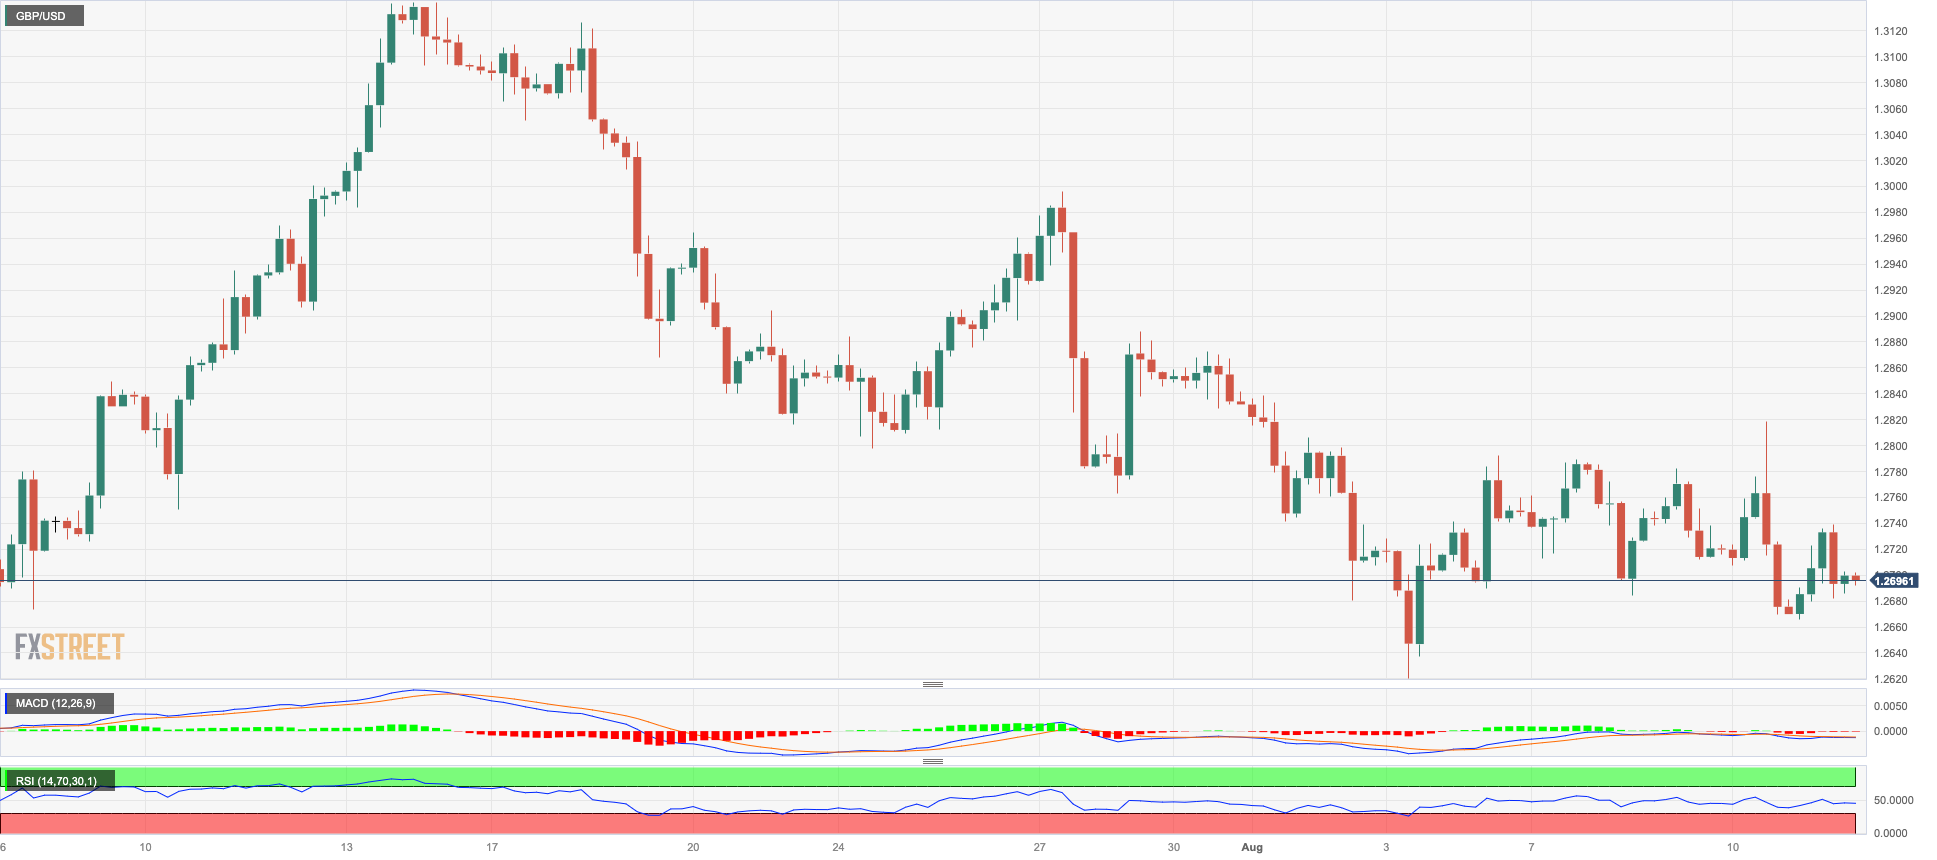
GBP/USD managed to reverse its downward movement over three consecutive days and concluded Friday's trading session with modest gains, settling near the 1.2700 level. Despite this slight recovery, Cable experienced its fourth consecutive week of closing in negative territory.
The latest trading session demonstrated another positive trend for the greenback, as it gained momentum thanks to higher-than-anticipated US Producer Prices. Nevertheless, the British pound stood its ground against the selling pressure observed across the risk-associated sector, aided by favorable outcomes from the domestic economic calendar released early in the trading day.
Speaking of the domestic calendar, UK GDP figures pleasantly surprised observers. The 3-Month Average GDP expanded by 0.2% in June, the GDP Growth Rate showed a 0.4% year-on-year increase, and the GDP as a whole grew by 0.9% in the year leading up to June. Additional data for June indicated that the Goods Trade Balance revealed a deficit of £15.455 billion (improved from £18.411 billion), Construction Output achieved a 4.6% YoY expansion, Industrial Production saw a 0.7% YoY increase, and Manufacturing Production rose by 3.1% compared to the previous year.
Meanwhile, the likelihood of a 25 basis point interest rate hike by the BoE on September 21 fluctuates around 85%, while the prospect of a similar hike on December 14 is almost entirely factored into the market, which would bring the bank rate to a peak near 5.75%. This is a notable shift from the 6.5% rate observed at the beginning of the previous month. However, the swaps market anticipates that the rate will remain at 5.75% over the next twelve months before transitioning to a period of rate cuts in the subsequent year. This projection aligns with a recent statement by Bailey, who mentioned that it is "far too soon to speculate on when we might see a cut."
If sellers retake control, GBP/USD might reclaim the August low of 1.2620 (August 3), followed by the weekly low of 1.2590 (June 29), and supported by the proximity of the transitory 100-day SMA (1.2607). The 2021-2023 trendline is located in the 1.2470 region, prior to the June low of 1.2368 (June 5) and the May low of 1.2308 (May 25), both of which look to be supported by the critical 200-day line SMA (1.2348). The immediate upward hurdle, on the other hand, is at the weekly high of 1.2818 (August 10) prior to another weekly top at 1.2995 (July 27). North from here emerges the 2023 peak of 1.3142 (July 14) seconded by weekly highs at 1.3146 (April 14 2022) and 1.3298 (March 15 2022). The RSI rose marginally past the 42 level.
Resistance levels: 1.2818 1.2822 1.2888 (4H chart)
Support levels: 1.2666 1.2591 1.2368 (4H chart)
AUDUSD
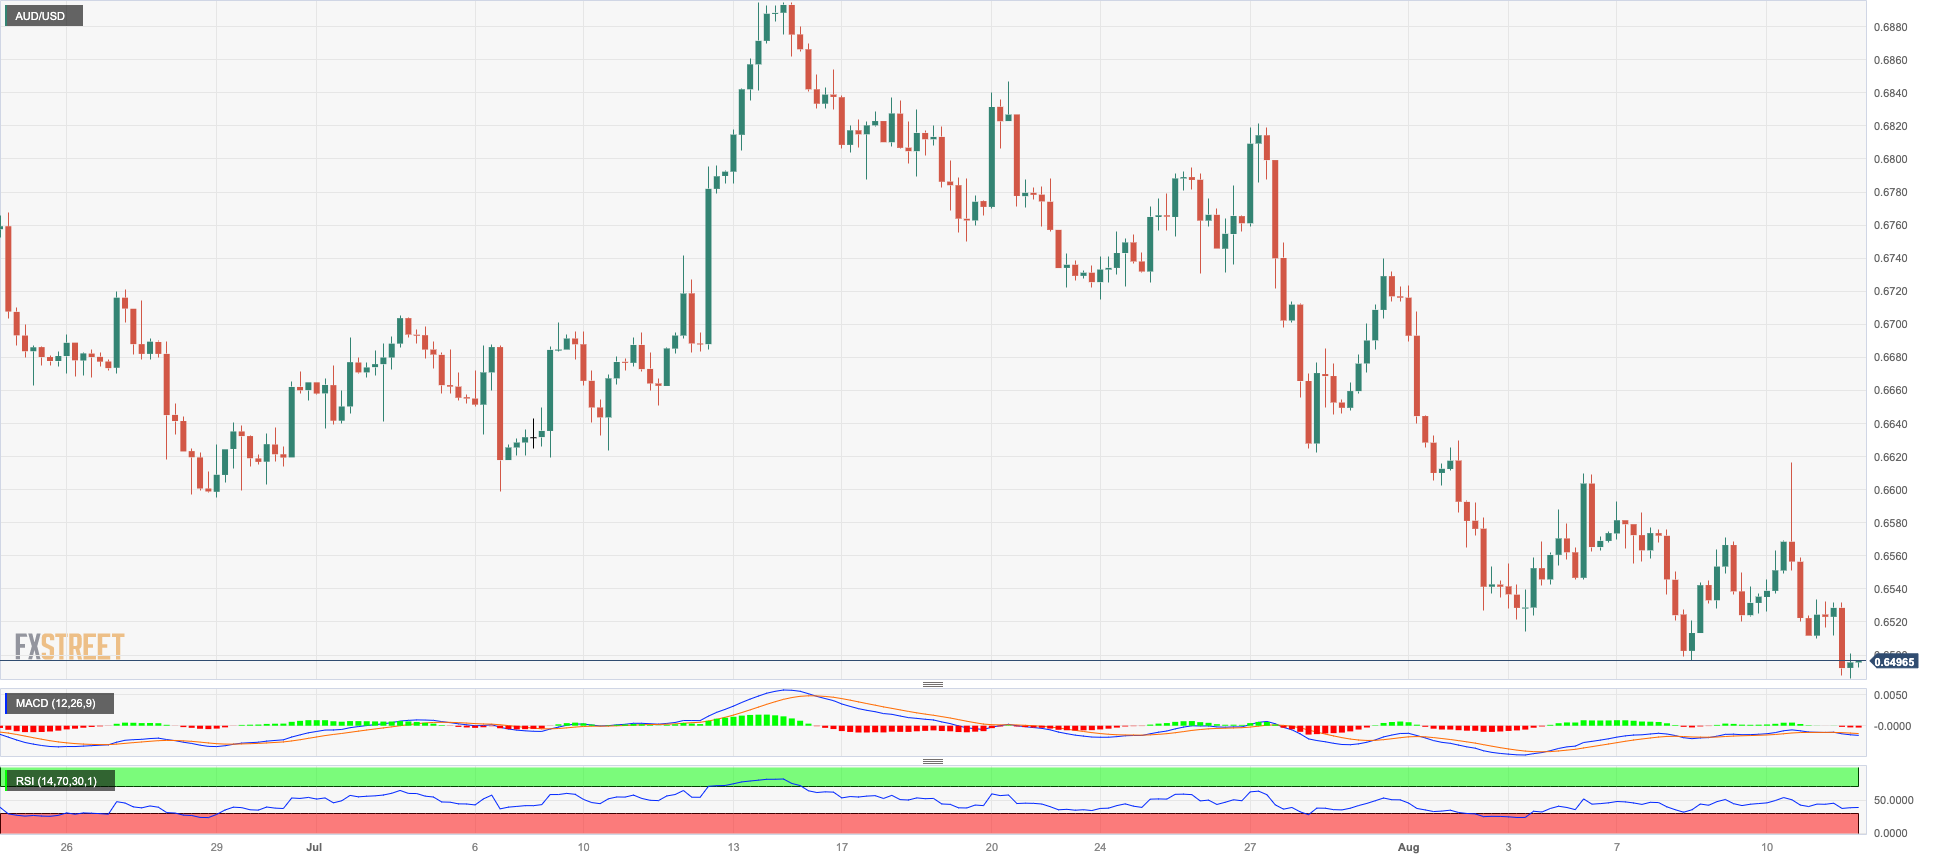
AUD/USD suffered another difficult session, sinking to its lowest point since early June by closing near 0.6480 at the end of the week.
In truth, the enduring strength of the greenback propelled the US Dollar Index to new multi-week tops, while the severe weakness across commodities likewise contributed to the deterioration in the pair on Friday.
There were no economic reports scheduled from Australia on Friday.
The immediate target for further declines in AUD /USD is the 2023 low at 0.6458 (May 31) before reaching the November 2022 low at 0.6272 (3 November) and the 2022 low at 0.6179 (13 October). On the other hand, an intermediate hurdle aligns at the 55-day SMA of 0.6684 before the critical 200-day SMA of 0.6735. Further up, the July high of 0.6894 (July 13) emerges, just ahead of the June top of 0.6899 (June 16). The breakout of this area could motivate spot to challenge the important 0.7000 threshold before the weekly high of 0.7029 (Feb 14) and the 2023 peak of 0.7157 (February 2). The daily RSI fell to the proximity of 34.
Resistance levels: 0.6616 0.6677 0.6739 (4H chart)
Support levels: 0.6485 0.6458 0.6386 (4H chart)
GOLD
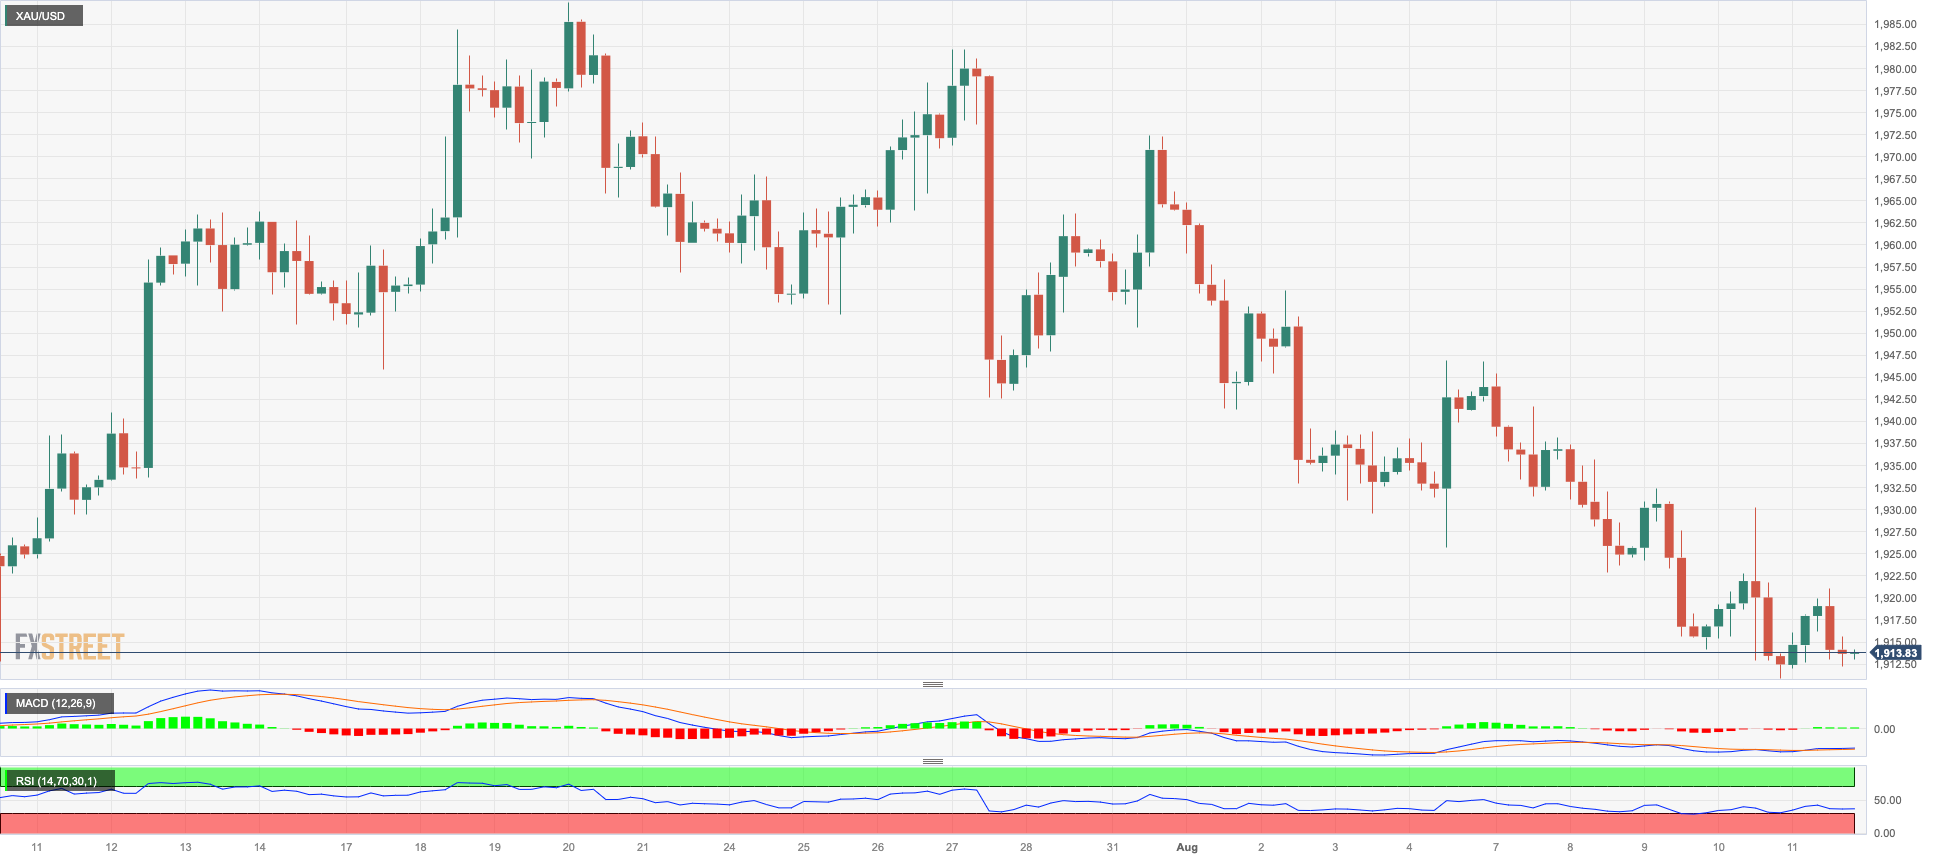
The troy ounce of gold traded in an indecisive range on Friday, concluding the week around the $1910 level, which was last traded in early July.
Indeed, another data-driven comeback in the dollar, along with additional upside in US rates across the curve, confined the yellow metal to a limited range towards the conclusion of the week.
Moving forward, persistent disinflationary dynamics in the US should keep expectations for a protracted pause in the Fed's currently supported normalization effort, which should convert into some support for gold prices.
Additional declines in gold prices are still possible and could reach the next major support level at $1900, an area where the key 200-day SMA also coincides. Further south turns up the June low of $1893 (June 29) ahead of the 2023 low of $1804 (February 28) and the key contention region of $1800. On the other hand, temporary resistance exists at the 55-day and 100-day SMAs of $1942 and $1966, respectively, before the July top of $1987 (July 20). If this level is breached, the price may escalate to the critical level of $2000. Beyond that is the likely path to the 2023 peak of $2067 (May 4), which emerges before the 2022 high of $2070 (March 8) and the record top of $2075 (August 7 2020).
Resistance levels: $1930 $1946 $1972 (4H chart)
Support levels: $1910 $1902 $1893 (4H chart)
CRUDE WTI
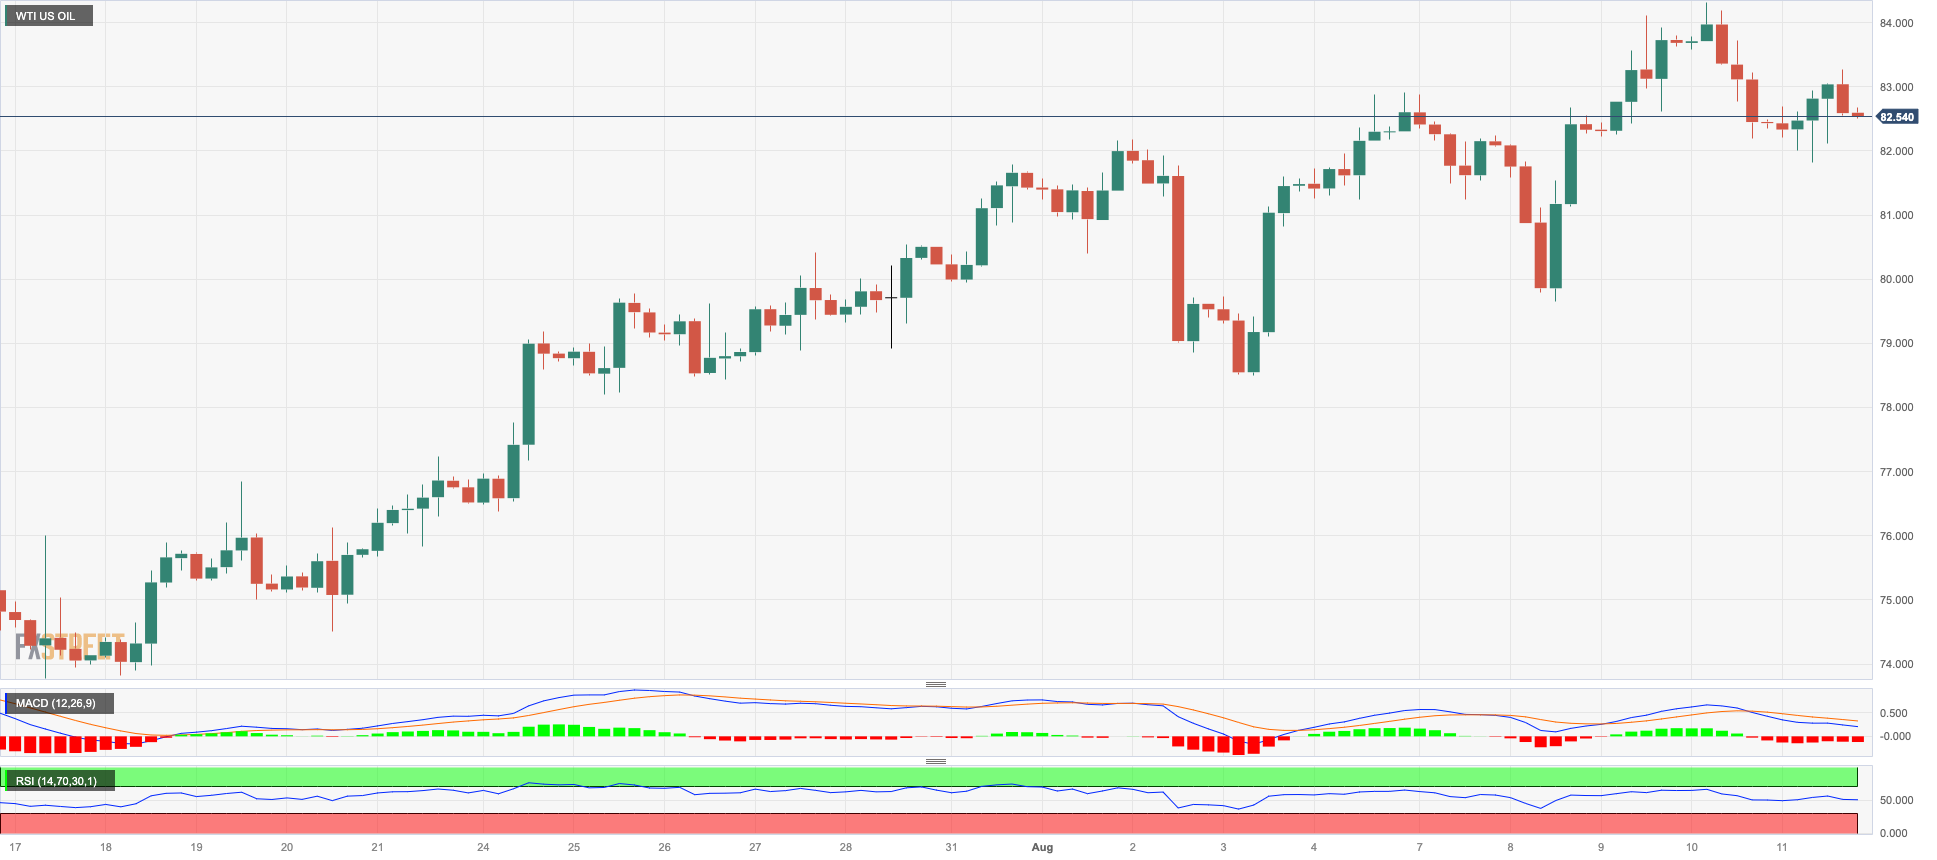
The price of the American benchmark for light sweet crude oil experienced modest gains and successfully regained momentum after a marked decline on Thursday, which occurred shortly after reaching new peak levels for the year, surpassing the $85.00 per barrel.
Traders maintained a positive outlook, underpinned by the encouraging industry forecast stemming from the IEA report. The agency disclosed record-breaking statistics for oil demand in June, further bolstering the market's optimism.
Moreover, the prevailing narrative of constrained supply continued to contribute to the upward momentum of the commodity. This was compounded by growing speculation that the Federal Reserve might have concluded its campaign of tightening monetary policy. Within this context, WTI prices achieved their seventh consecutive week of gains, a performance not observed since before the Russian invasion of Ukraine.
In terms of the economic calendar, the drilling company Baker Hughes reported that the total number of active oil rigs in the US remained unchanged at 525 during the week leading up to August 11.
The 2023 high of $84.85 (August 10) is followed by the November 2022 top of $93.73 (November 7) and the weekly peak of $97.65 (August 30, 2022). However, there is early resistance around the August low of $78.74 (August 4), which is ahead of the critical 200-day SMA of $76.44 and the weekly low of $73.89 (July 17). The intermediate 100-day and 55-day SMAs of $74.71 and $74.34, respectively, are exposed if this level is breached. If WTI falls below this region, it might reach the June low of $66.86 (June 12) before falling to the 2023 low of $63.61 (May 4). A deeper drop could challenge the December 2021 low of $62.46 (December 2) prior to the key $60.00 mark per barrel.
Resistance levels: $84.85 $88.5 $90.08 (4H chart)
Support levels: $82.19 $79.89 $78.66 (4H chart)
GER40
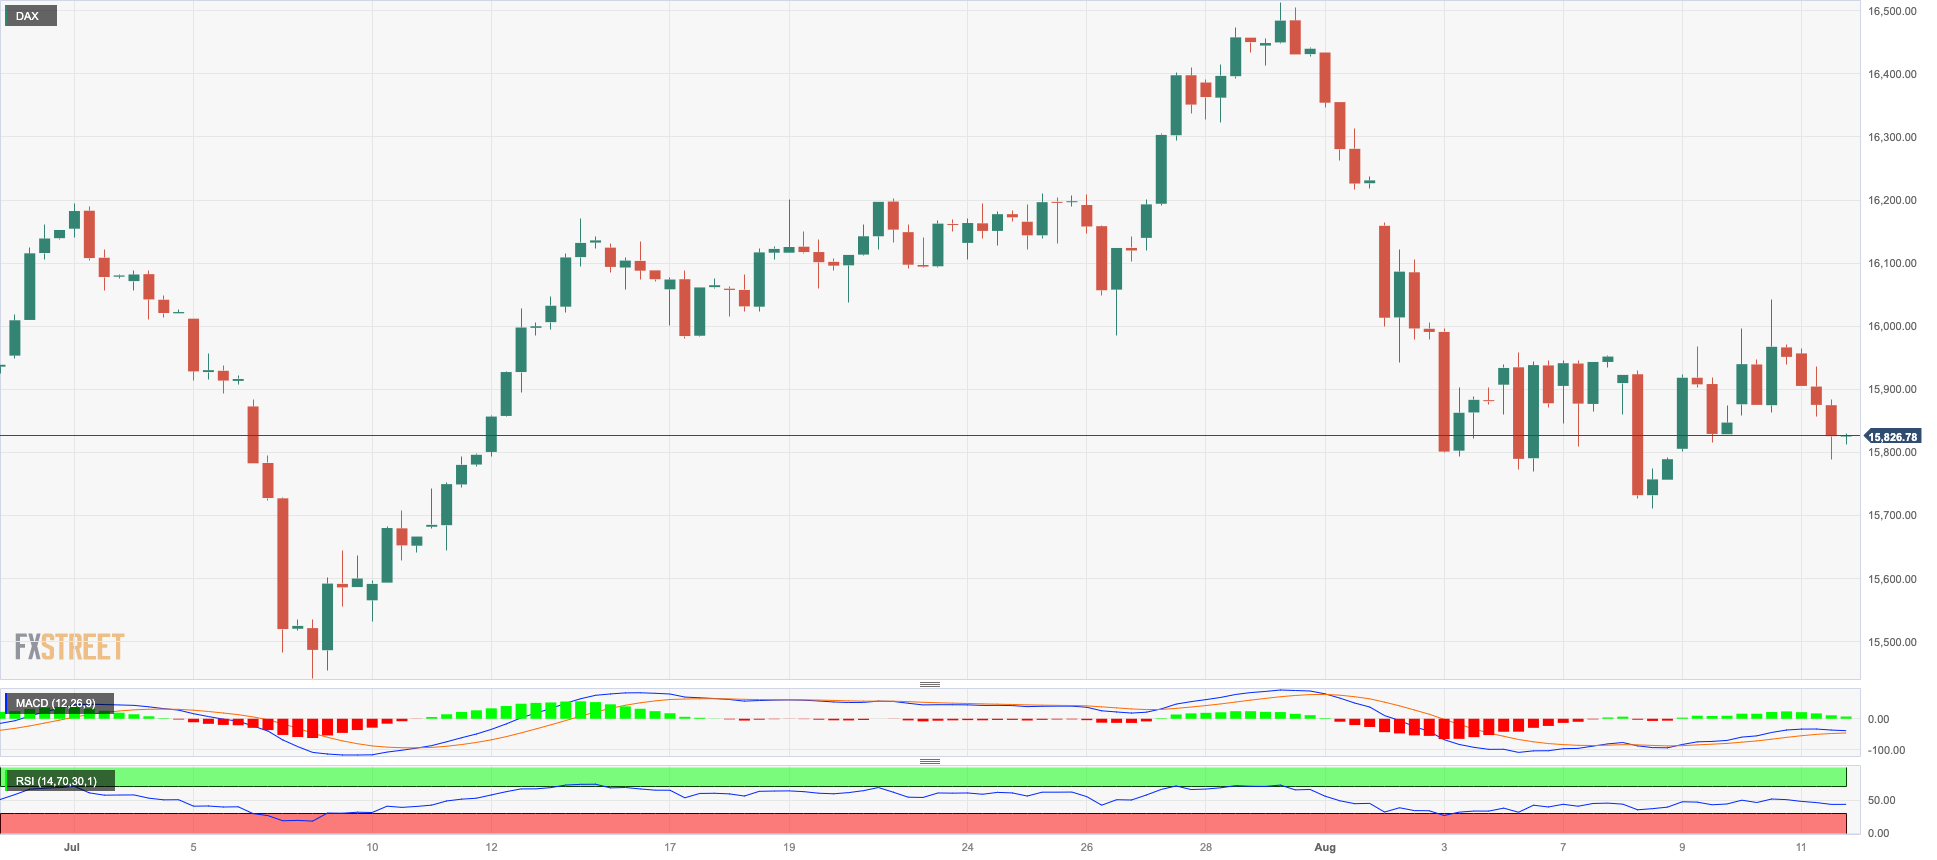
German stocks, as represented by the DAX40, ended the week on a downbeat note, shedding gains from the previous two sessions and closing at a three-day low of around 15800 on Friday.
The daily decline in the index was influenced by investors' evaluation of recent corporate earnings reports and economic data releases, including US inflation figures (CPI and Producer Prices) on Thursday and Friday, respectively.
The drop in the benchmark index coincided with a rise in German 10-year bund yields, which surged past the 2.60% mark for the first time since mid-July.
Immediately to the downside for the DAX40 now emerges the August low of 15706 (August 8) ahead of the July bottom of 15456 (July 7), which is ahead of the critical 200-day SMA of 15310. If this zone is breached, the index is anticipated to fall to the March low of 14458 (March 20), prior to the December 2022 low of 13791 (December 20) and the 2022 low of 11862 (September 28). On the other hand, the breakout of the weekly peak of 16060 (August 10) should put the index en route to confront the all-time high of 16528 (July 31). The daily RSI retreated to the sub-43 area.
Best Performers: Commerzbank, Siemens Energy AG, Fresenius SE
Worst Performers: Zalando SE, Continental AG, , Infineon
Resistance levels: 16060 16146 16528 (4H chart)
Support levels: 15803 15706 15456 (4H chart)
NASDAQ
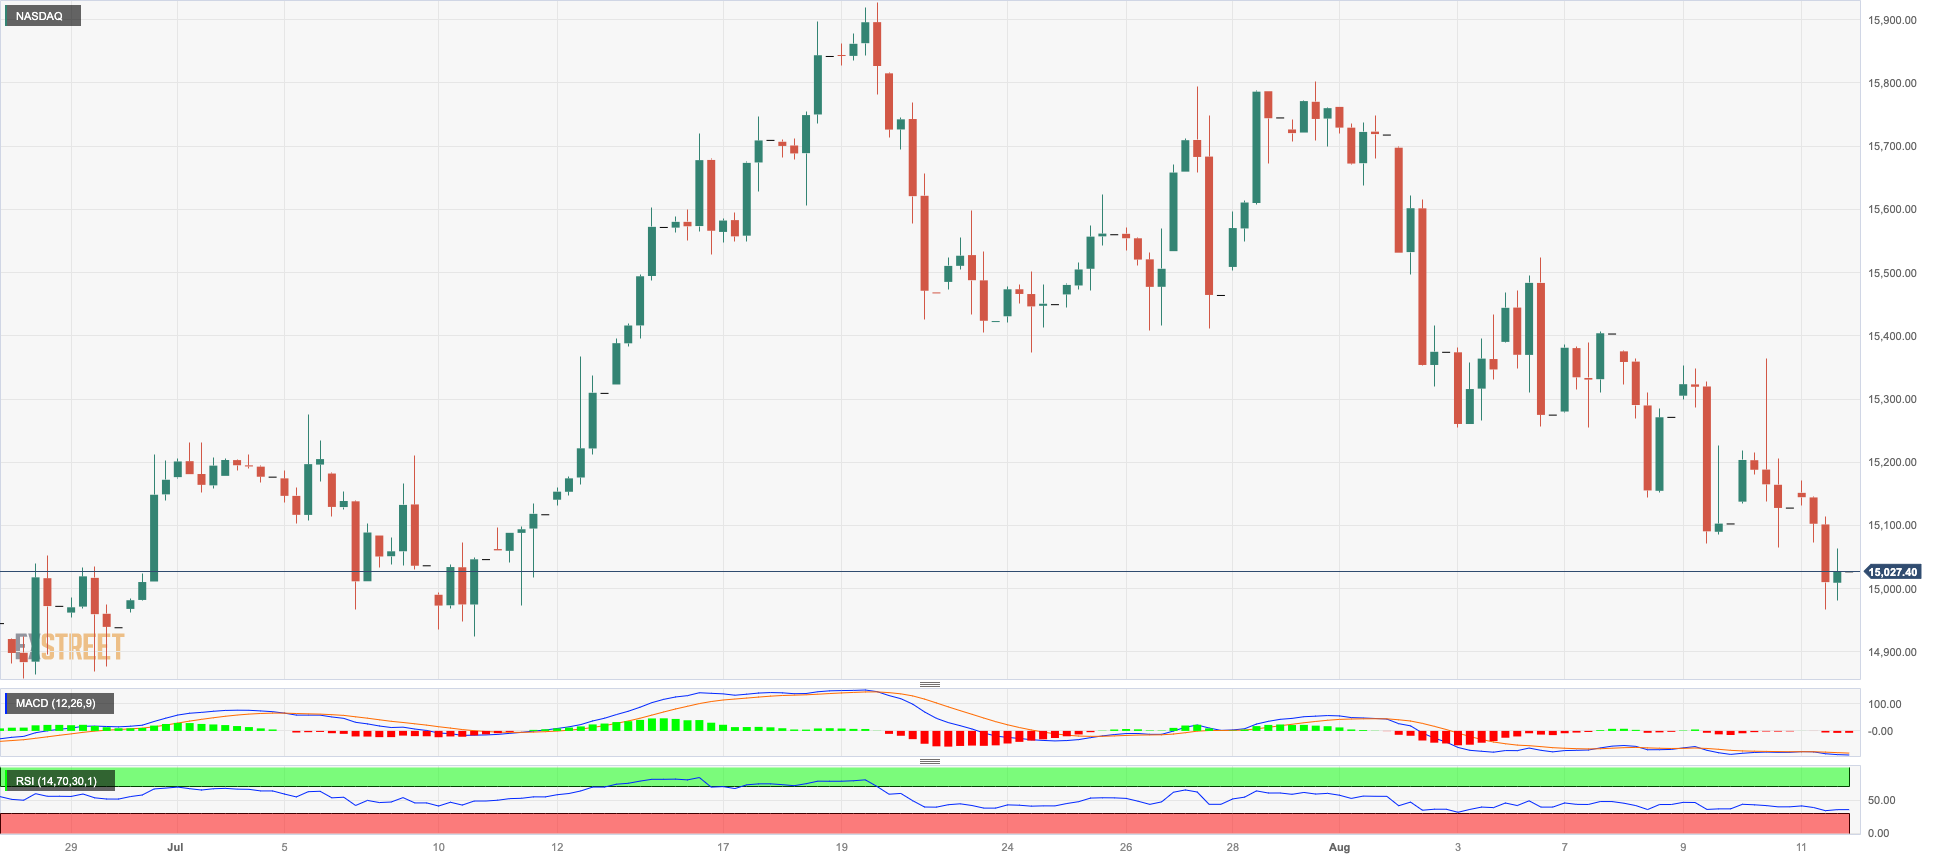
The technology industry was affected by the robust rebound in US bond yields across various timeframes and the further strengthening of the US dollar. This led to the Nasdaq 100 index, a key reference point, closing Friday's session at around four-week lows, just above the 15000 mark.
Moreover, disappointing showings from major players like Nvidia and Meta Platforms also played a role in dampening market sentiment. This sentiment seemed to be rekindled due to concerns that the Federal Reserve might recommence raising interest rates later in the year.
Extra losses in the Nasdaq 100 are now expected to challenge the July low of 14924 (July 10). If this level fails, the index may go down and test the weekly lows of 14687 (June 26), 14283 (June 7), and 13520 (May 24). The crucial 200-day SMA at 12953 appears to be supporting the May low of 12938 (May 4), which is higher than the April low of 12724 (April 25). On the upside, the weekly high of 15803 (July 31) stands in the way of the 2023 high of 15932 (July 19) and the round level of 16000. The RSI dropped to the vicinity of 41.
Top Gainers: eBay, Palo Alto Networks, Regeneron Pharma
Top Losers: JD.com Inc Adr, Lam Research, MercadoLibre
Resistance levels: 15417 15795 15932 (4H chart)
Support levels: 14973 14924 14687 (4H chart)
DOW JONES
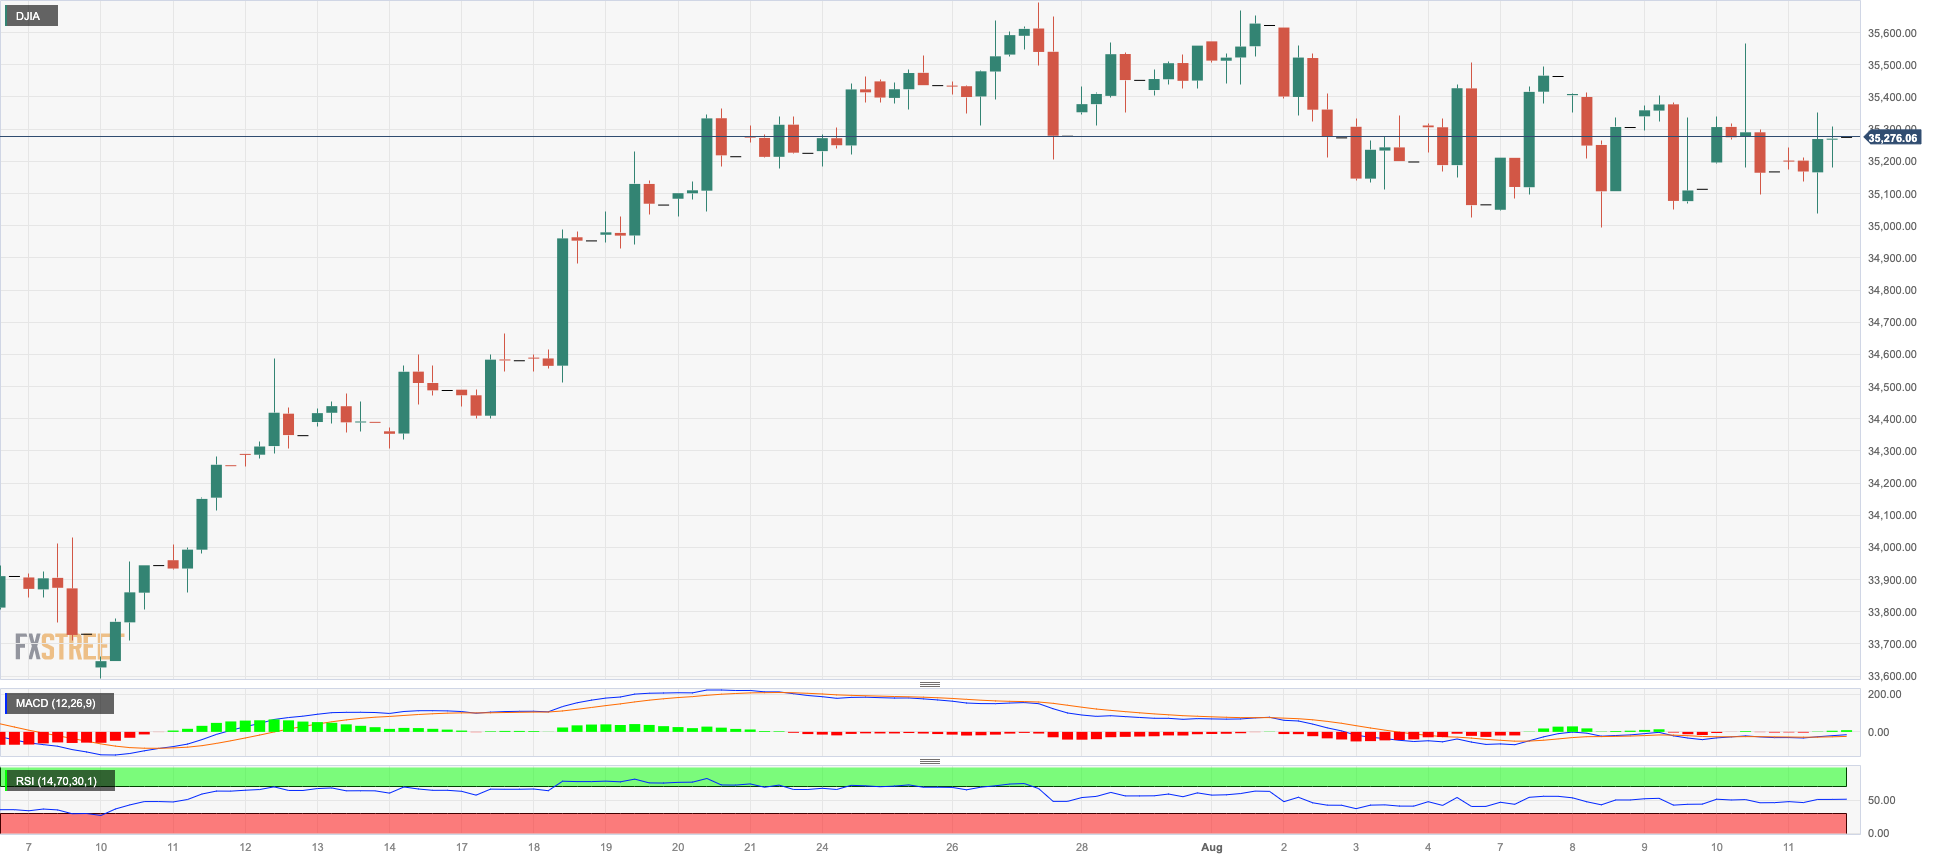
US stocks, as measured by the Dow Jones, contributed to the positive sentiment by registering modest gains in the vicinity of the 35300 zone towards the end of the week.
Remarkably, the index managed to sustain its positive momentum in the latter part of the week, despite the increase in US yields, the strengthening of the dollar, and growing caution regarding the possibility that the Federal Reserve may not conclude its tightening measures as promptly as investors had anticipated. This caution was particularly heightened following the release of US Producer Prices for July, which exceeded expectations.
Furthermore, the initial Consumer Sentiment reading for August pleasantly surprised market participants, revealing a resilient optimism among them.
Overall, the Dow Jones rose 0.30% to 35281, the S&P500 dropped 0.11% to 4464, and the tech-focused Nasdaq Composite retreated 0.56% to 13644.
The Dow Jones immediately to the upside is the 2023 high of 35679 (August 1), followed by the February 2022 top of 35824 (February 9) and the all-time peak of 36952 (January 5, 2022). By contrast, the initial support level is oriented at the August low of 35007 (August 8), before the transitory 55-day and 100-day SMAs at 34358 and 33915, respectively, and ahead of the July low of 33705 (July 10), which precedes the major 200-day SMA at 33623. The latter's breakdown reveals the May low of 32586 (May 25), which is ahead of the 2023 low of 31429 (March 15). The daily RSI improved to the boundaries of 57.
Top Performers: Chevron, Merck&Co, American Express
Worst Performers: Walt Disney, Boeing, Dow
Resistance levels: 35679 35824 36513 (4H chart)
Support levels: 35007 34499 33705 (4H chart)
MACROECONOMIC EVENTS
All Information & Updates provided by:

All information relating to the financial markets available on this page has been prepared and issued by FXStreet (Forexstreet SL, Spain, Reg: B62498233) on the basis of publicly available information and all information believed to be reliable and does not conflict with Kuwaiti local laws, and all necessary care has been taken to before the company to ensure that the facts mentioned are correct from the source.
NCM Investment nor any of its directors or employees shall in any way be held responsible for the contents of this news, and the information contained on this page is intended only to provide clients with publicly available information and should not be construed as investment advice, report or analysis and/or constitute an offer or invitation to buy or sell financial instruments of any kind.
RISK WARNING: Forex and CFDs are highly risky leveraged products, as losses can exceed deposits. Please ensure you understand all the risks and take independent advice if necessary. NCM will segregate the clients based on the criteria of the regulator and its bylaws. NCM does not provide any advisory service; the material published does not constitute advice or a recommendation for a transaction in any financial instrument. NCM accepts no responsibility for any use of the content presented and any consequences of that use. Anyone acting on the information provided does so at their own risk.