
- Contact Us:
-

-

-

-


Daily Market Updates
15 Aug 2023
USDJPY
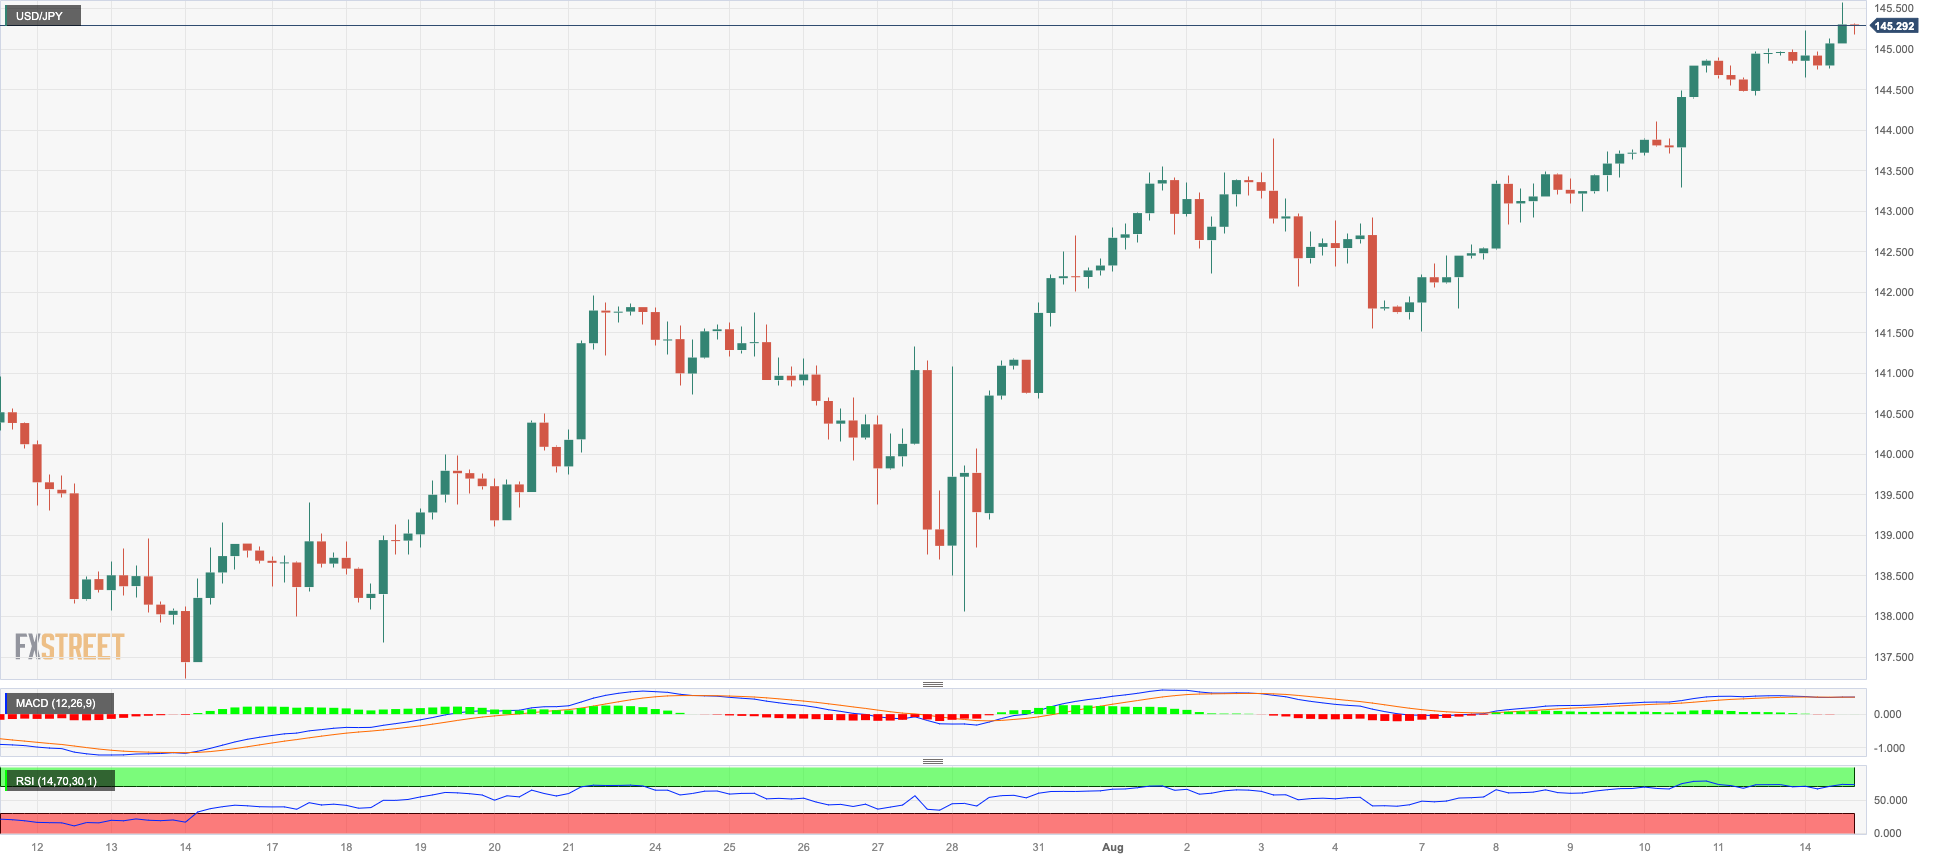
USD/JPY continued its upward trajectory on Monday, climbing to a fresh multi-month high of 145.60. This marks the highest level for the pair since early November 2022.
The Japanese yen remained under pressure against its American counterpart. In fact, the yen's weakness was exacerbated by the BoJ’s persistent ultra-accommodative policy stance, while additional dollar strength and a broader rise in US Treasury yields across the curve also bolstered the pair’s upside bias.
Monday's session saw no major economic data releases in Japan.
The 2023 high of 145.57 (August 14) is the next resistance level for USD/JPY, followed by the 2022 high of 151.94 (October 21). The preliminary 55-day SMA at 141.58, on the other hand, emerges as the immediate contention ahead of the August low of 141.50 (August 7) and before the weekly low of 138.05 (July 28) and the July low of 137.23 (July 14). If the latter is breached, spot might target the 200-day SMA of 136.45 before the weekly low of 133.01 (April 26), the minor support of 132.01 (April 13), and the round mark of 130.00. The RSI broke through the 66 level.
Resistance levels: 145.57 146.79 147.56 (4H chart)
Support levels: 143.25 141.97 141.50 (4H chart)
GBPUSD
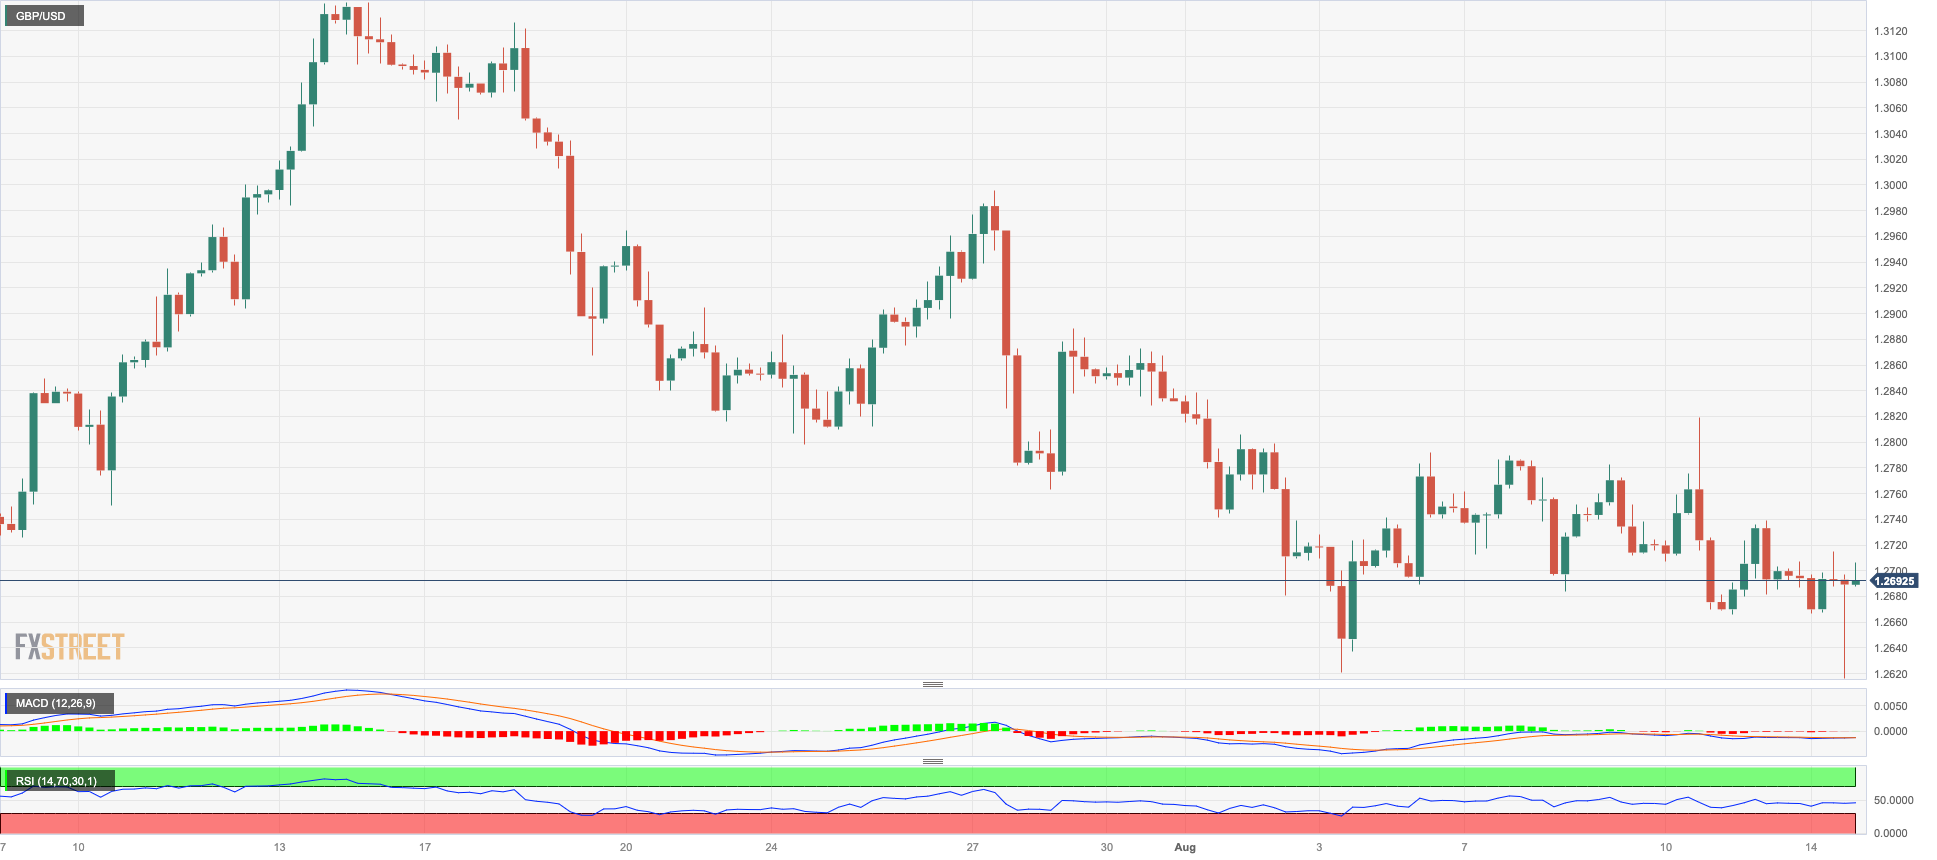
In spite of the greenback performing well and reaching new multi-week highs on the USD Index (DXY), the British pound managed to continue its upward movement from Friday and briefly surpassed the significant level of 1.2700 on Monday.
The positive sentiment surrounding the sterling can be attributed to recent strong economic indicators from the UK, and there are also expectations that the BoE) will implement further monetary tightening later in the year.
Currently, there is an approximately 85% probability of a 25 basis point interest rate hike by the BoE on September 21. Additionally, the market has already largely factored in the likelihood of a similar rate hike on December 14. If these predictions materialize, it would bring the bank rate to a peak of around 5.75%, compared to the 6.5% rate observed at the beginning of the previous month.
The immediate hurdle to the upside for GBP/USD is at the weekly high of 1.2818 (August 10) ahead of another weekly top at 1.2995 (July 27). North of this is the 2023 peak of 1.3142 (14 July), followed by weekly highs at 1.3146 (April 14 2022) and 1.3298 (March 15 2022). If sellers regain control, Cable could recapture the August low of 1.2616 (August 14), which appears supported by the proximity of the transitory 100-day SMA (1.2611) and lies ahead of the weekly low of 1.2590 (June 29). The 2021-2023 trendline is in the 1.2470 area, ahead of the June low of 1.2368 (June 5) and the 200-day SMA at 1.2354. Down from here emerges the May low of 1.2308 (May 25). The everyday RSI rose slightly above the 42 mark.
Resistance levels: 1.2819 1.2822 1.2888 (4H chart)
Support levels: 1.2616 1.2591 1.2368 (4H chart)
AUDUSD
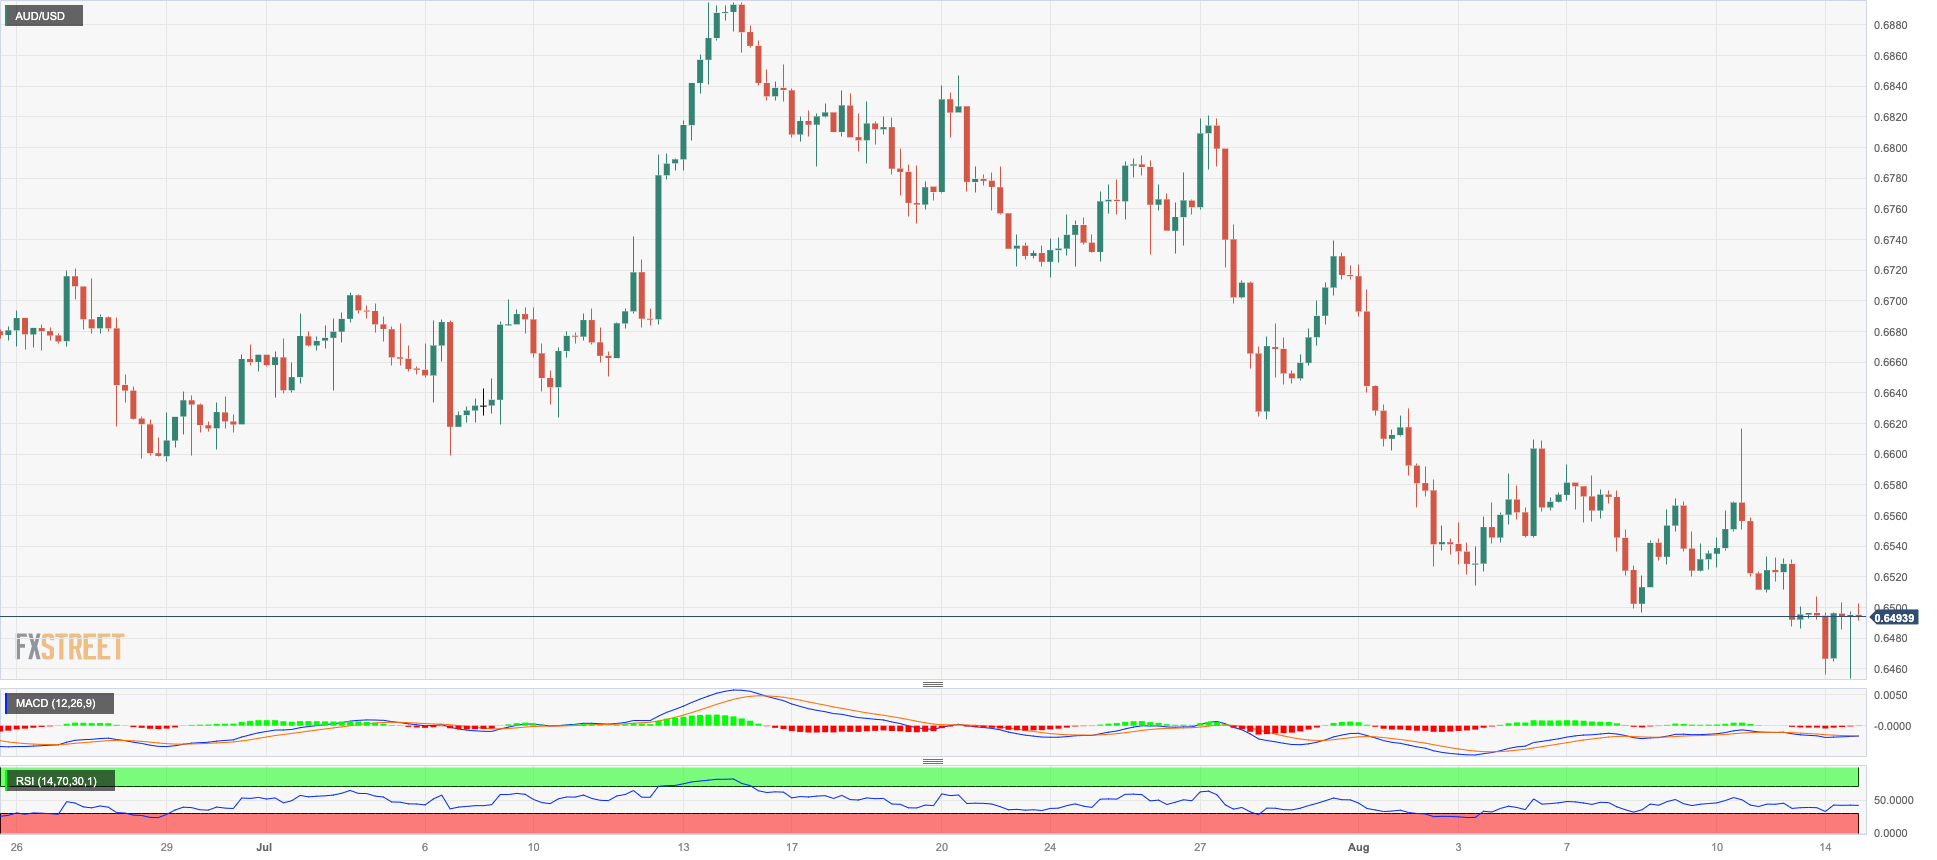
AUD/USD experienced a drop to its lowest level of the year, reaching around 0.6450, but later rebounded and ultimately finished the session with modest gains near the 0.6500 range on Monday.
Throughout the day, the movement of the Australian dollar closely followed the changes in the greenback, while the varied developments in the commodity market also appeared to have restrained the pair from falling further.
As the week commenced, there were no significant events or announcements scheduled on the Australian economic calendar.
The immediate goal for more AUD/USD falls is the 2023 low of 0.6453 (August 14), followed by the November 2022 low of 0.6272 (November 3) and 2022 low of 0.6179 (October 13). On the other hand, the 55-day SMA of 0.6684 turns up as an interim hurdle prior to the key 200-day SMA of 0.6735. The July high of 0.6894 (July 13) emerges farther up, barely ahead of the June top of 0.6899 (June 16). The breakout of this sector may encourage spot to test the critical 0.7000 threshold before the weekly peak of 0.7029 (February 14) and the 2023 top of 0.7157 (February 2). The daily RSI surpassed the 34 yardstick.
Resistance levels: 0.6544 0.6616 0.6673 (4H chart)
Support levels: 0.6453 0.6386 0.6272 (4H chart)
GOLD
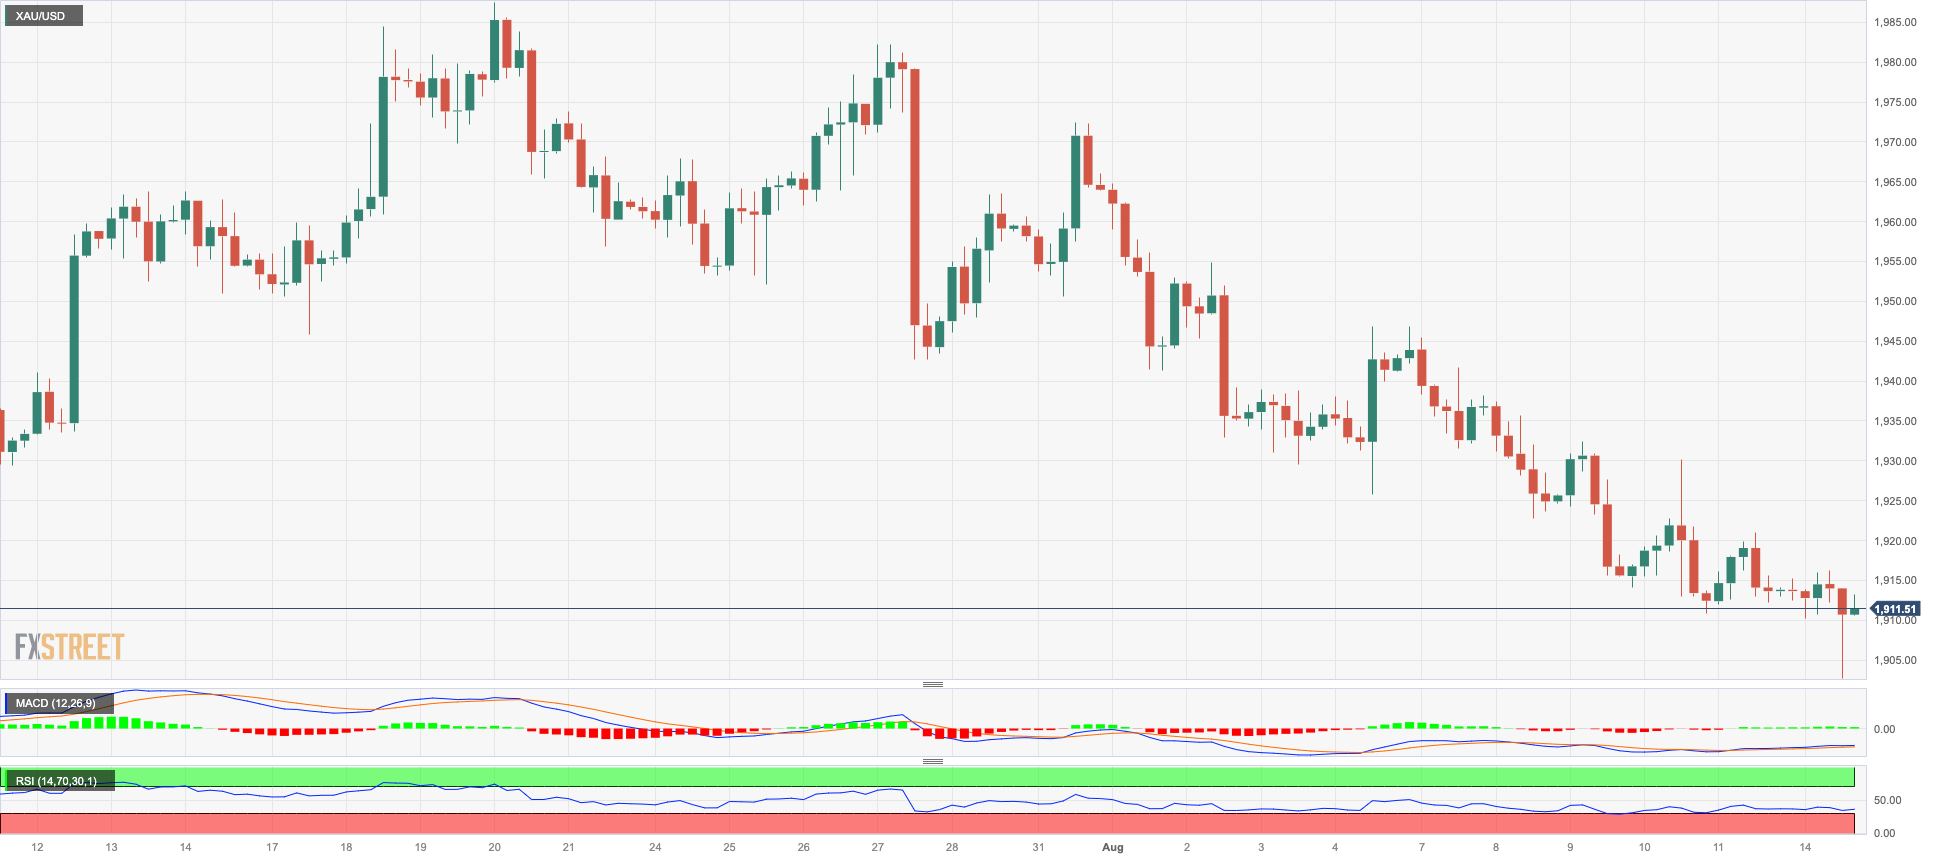
Gold prices continued to face downward pressure as the new week began, leading them to once again approach the crucial support level of around $1900 per troy ounce.
This decline in the metal's value was influenced by the ongoing strengthening of the greenback and the rise in yields on the shorter end of the yield curve. Meanwhile, there seems to be a temporary slowdown in the gains observed in the middle and longer portions of the yield curve.
Looking ahead, the persistent presence of disinflationary trends in the United States is likely to maintain expectations for a prolonged pause in the Fed’s current efforts towards normalization. This, in turn, is anticipated to provide some level of support to gold prices.
Additional drops in gold prices are still probable, with the next significant support level around $1900, which also corresponds with the crucial 200-day SMA. Further south, the June low of $1893 (June 29) is encountered, followed by the 2023 low of $1804 (February 28) and the important contention region of $1800. However, temporary resistance persists before the July peak of $1987 (July 20) at the 55-day and 100-day SMAs of $1942 and $1966, respectively. If this level is breached, the price may rise to the crucial $2000 level. Beyond that, the expected route is to the 2023 peak of $2067 (May 4), which appears ahead of the 2022 high of $2070 (March 8) and the record high of $2075 (August 7 2020).
Resistance levels: $1946 $1965 $1972 (4H chart)
Support levels: $1902 $1893 $1804 (4H chart)
CRUDE WTI
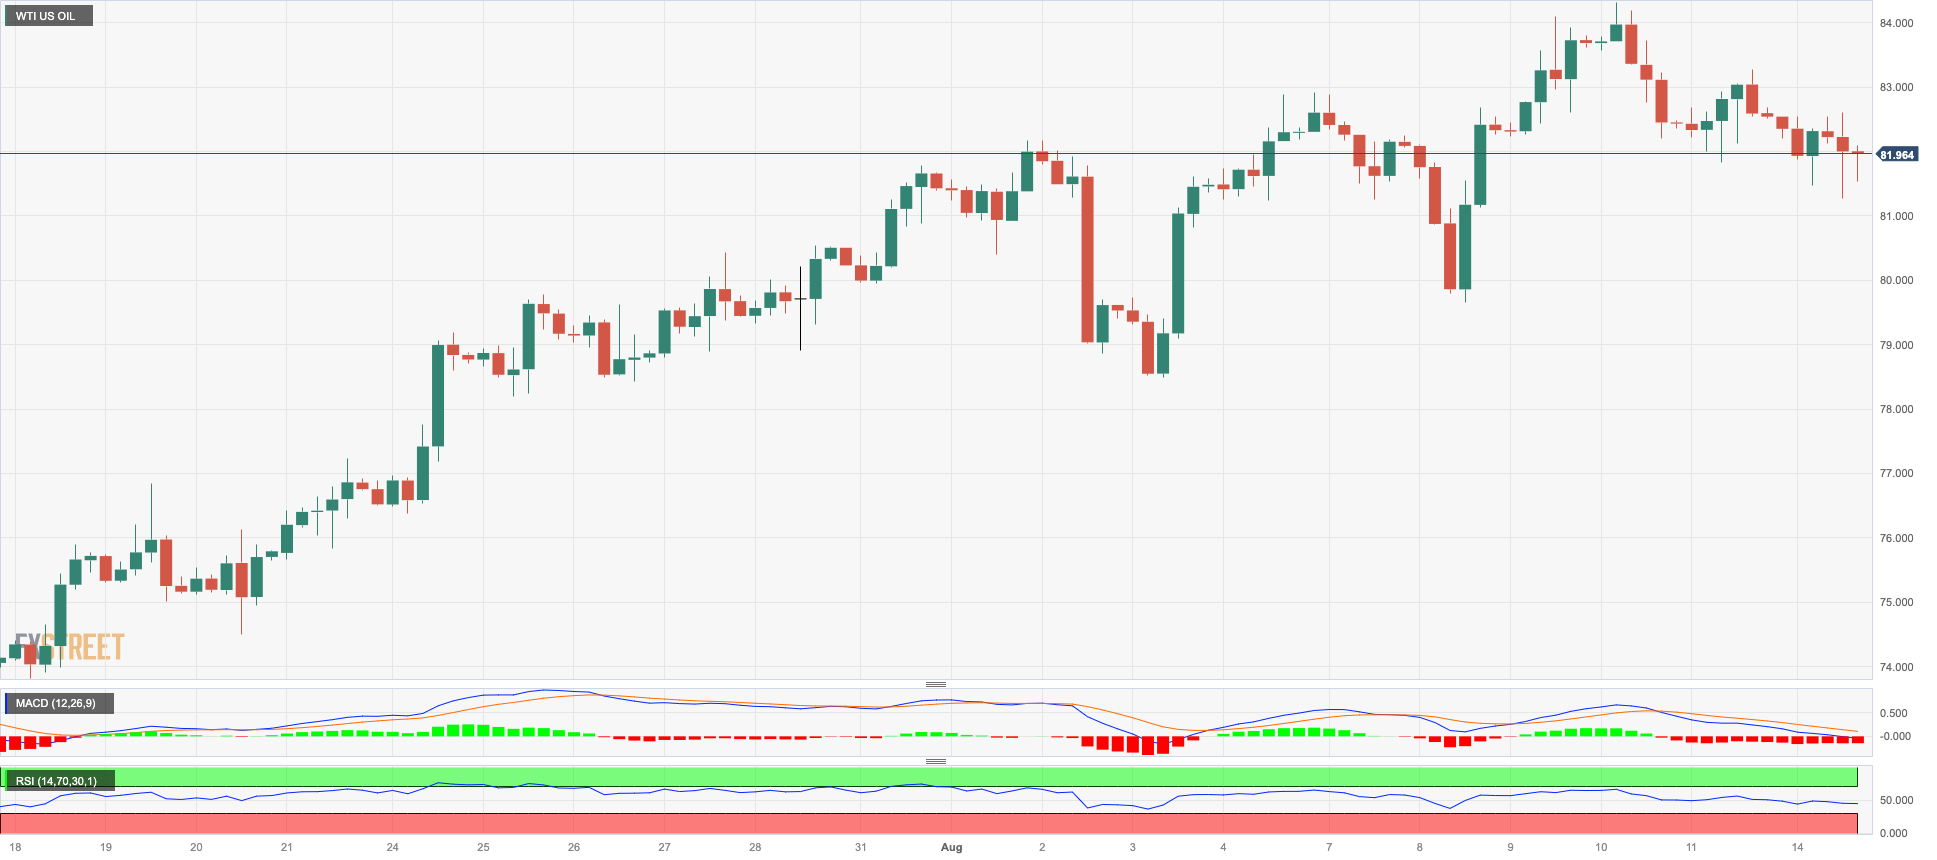
At the beginning of the week, WTI prices faced a decline, which was a continuation of the movement from the previous week when they reached the highest levels seen this year, just below $85.00 per barrel (August 10).
Once again, traders found themselves worried about the sluggish pace of recovery in China, and the bleak outlook for the country's economy in the coming months. This concern had a negative impact on the commodity's prices on Monday following seven consecutive weeks of gains.
Contributing to the decrease in prices on the day was the additional strength observed in the dollar, along with the resumption of oil exports from Nigeria.
As the week unfolds, both the American Petroleum Institute (API) and the Energy Information Administration (EIA) are set to release reports on the US crude oil inventories for the week that concluded on August 11.
Next on the upside for WTI emerges the 2023 peak of $84.85 (August 10) seconded by the November 2022 high of $93.73 (November 7) and the weekly peak of $97.65 (August 30, 2022). However, early support exists around the August low of $78.74 (August 4), which is ahead of the important 200-day SMA of $76.41 and the weekly low of $73.89 (July 17). If this level is violated, the intermediate 100-day and 55-day SMAs of $74.84 and $74.51, respectively, would be exposed. If WTI goes below this region, it might hit the June low of $66.86 (June 12) before dropping to the 2023 low of $63.61 (May 4). A deeper slide might test the December 2021 low of $62.46 (December 2), just above the critical $60.00 per barrel barrier.
Resistance levels: $84.85 $88.5 $90.08 (4H chart)
Support levels: $81.74 $79.89 $78.66 (4H chart)
GER40
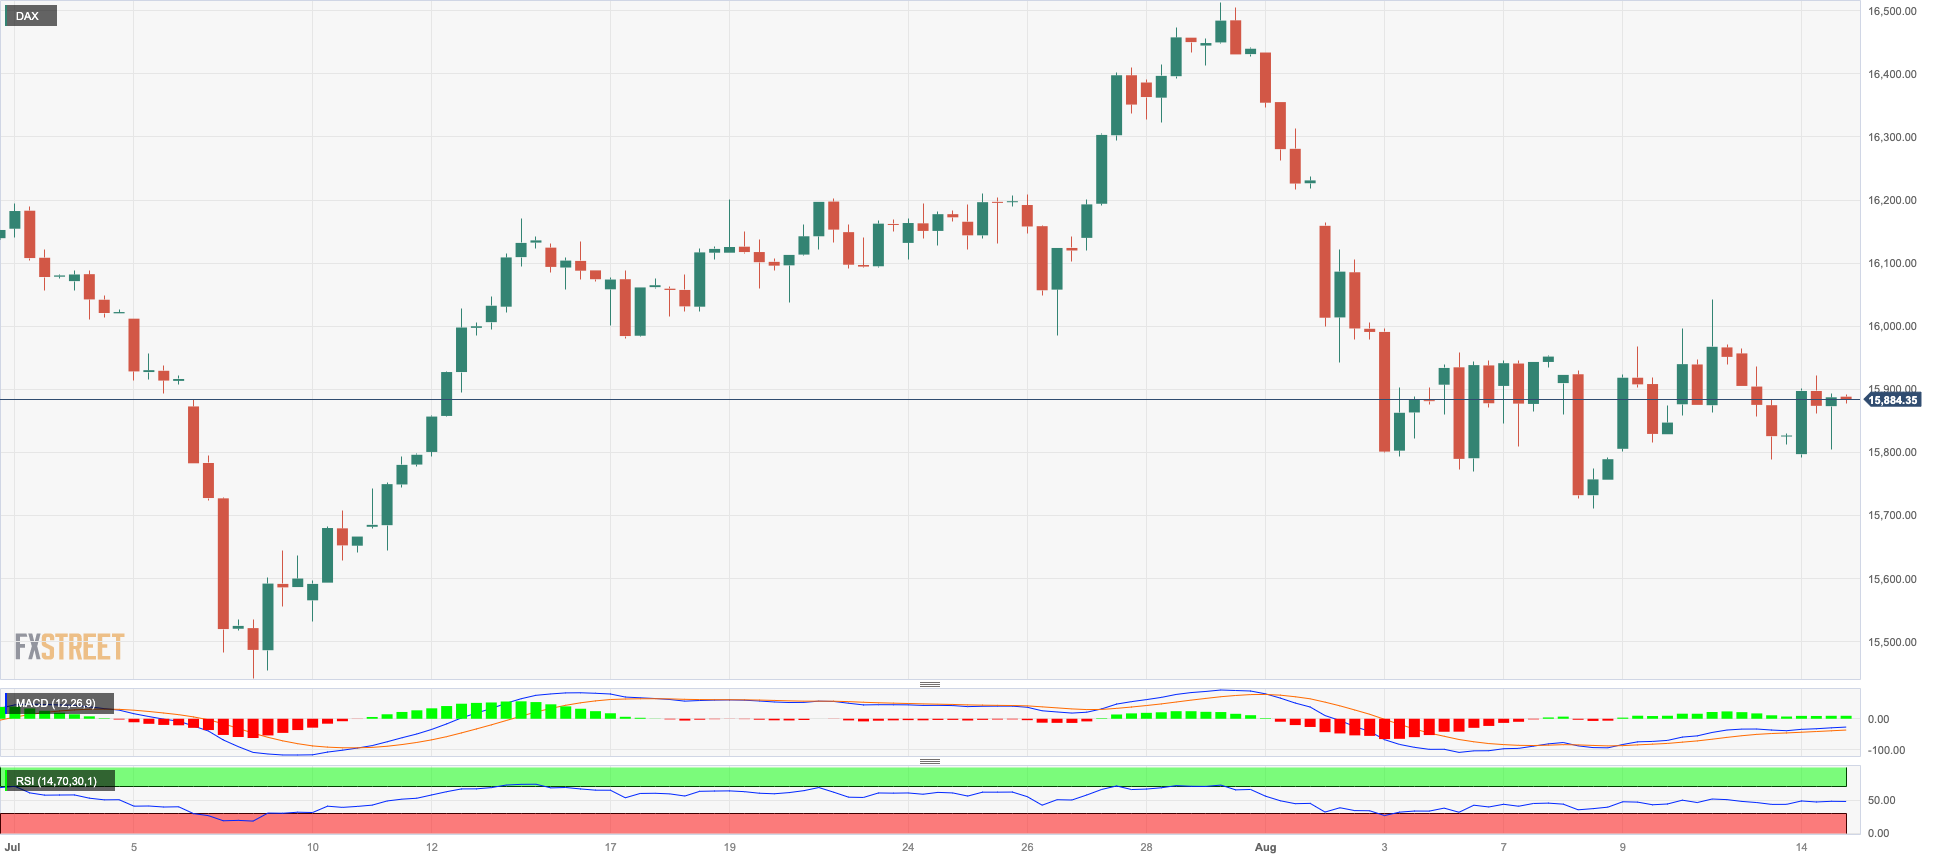
Germany's DAX40, a major stock reference, began the week with decent gains and managed to recover from Friday's decline, approaching the important 16000 level. The positive sentiment in the German stock market was in line with most other European markets, except for the UK's FTSE100 and Spain's IBEX35.
The increase in the DAX40 index was driven by investors' assessment of recent corporate earnings reports. Additionally, there was speculation that the European Central Bank (ECB) might be reaching the peak of its interest rate hiking cycle, which further contributed to the overall optimism.
The upward movement in the index corresponded with a positive trend in German 10-year bund yields, which rose to around 2.65%.
For the DAX40, the August low of 15706 (August 8) now appears ahead of the July bottom of 15456 (July 7), which is ahead of the crucial 200-day SMA of 15322. If this zone is breached, the index is expected to fall to the March low of 14458 (March 20), before testing the December 2022 low of 13791 (December 20) and the 2022 low of 11862 (September 28). On the contrary, a break above the weekly high of 16060 (August 10) should send the index on its way to the all-time high of 16528 (July 31). The daily RSI regained the area beyond the 45 hurdle.
Best Performers: Covestro, Rheinmetall AG, SAP
Worst Performers: Zalando SE, Commerzbank, Fresenius SE
Resistance levels: 16060 16146 16528 (4H chart)
Support levels: 15803 15706 15456 (4H chart)
NASDAQ
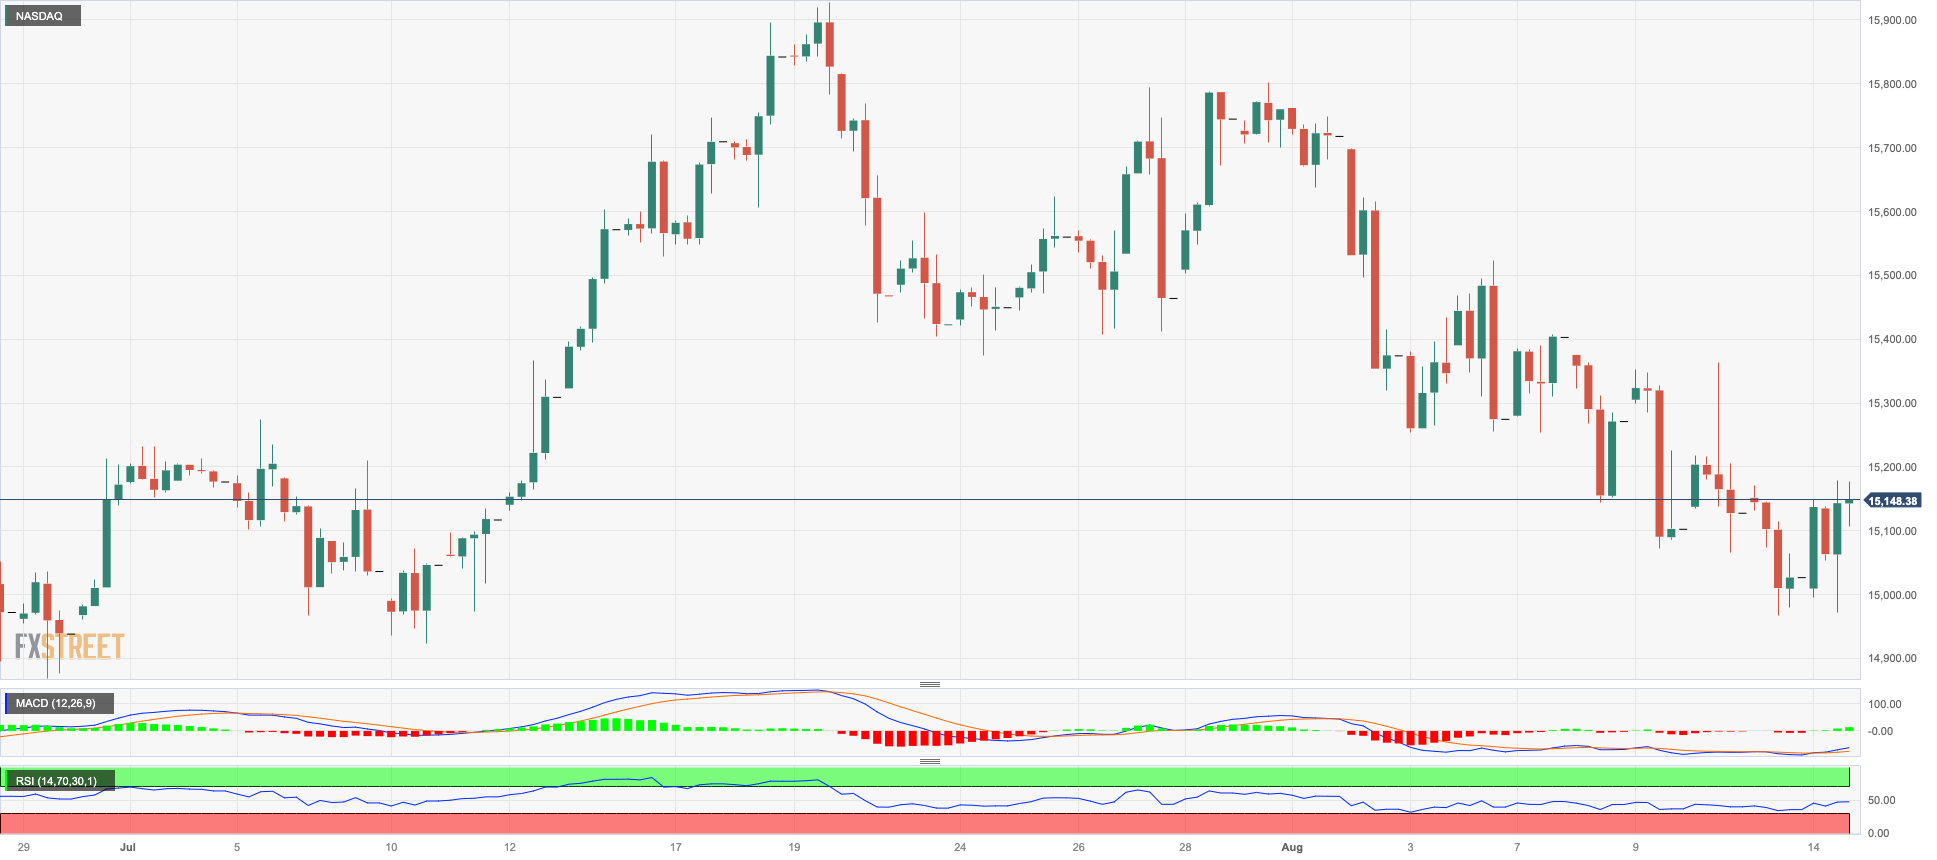
On Monday, US tech shares rose to a two-day high, trading near the 15200 level as measured by the Nasdaq 100.
Investors' optimism about the tech sector appears to have been enough to push the index into positive territory despite the rising dollar, higher yields, and caution ahead of further earnings reports and key US data releases due later in the week.
Extra downside in the Nasdaq 100 is now likely to test the July low of 14924 (July 10). South from here, the index may fall to weekly lows of 14687 (June 26), 14283 (June 7), and 13520 (May 24). The 200-day SMA at 12970 looks to be confirming the May low of 12938 (May 4), which is higher than the April low of 12724 (April 25). On the upside, the weekly high of 15803 (July 31) is preventing the 2023 top of 15932 (July 19) and the round level of 16000 from being reached. The RSI leapt past the 46 barrier.
Top Gainers: NVIDIA, Micron, Marvell
Top Losers: MercadoLibre, Illumina, Moderna
Resistance levels: 15416 15795 15932 (4H chart)
Support levels: 14972 14924 14687 (4H chart)
DOW JONES
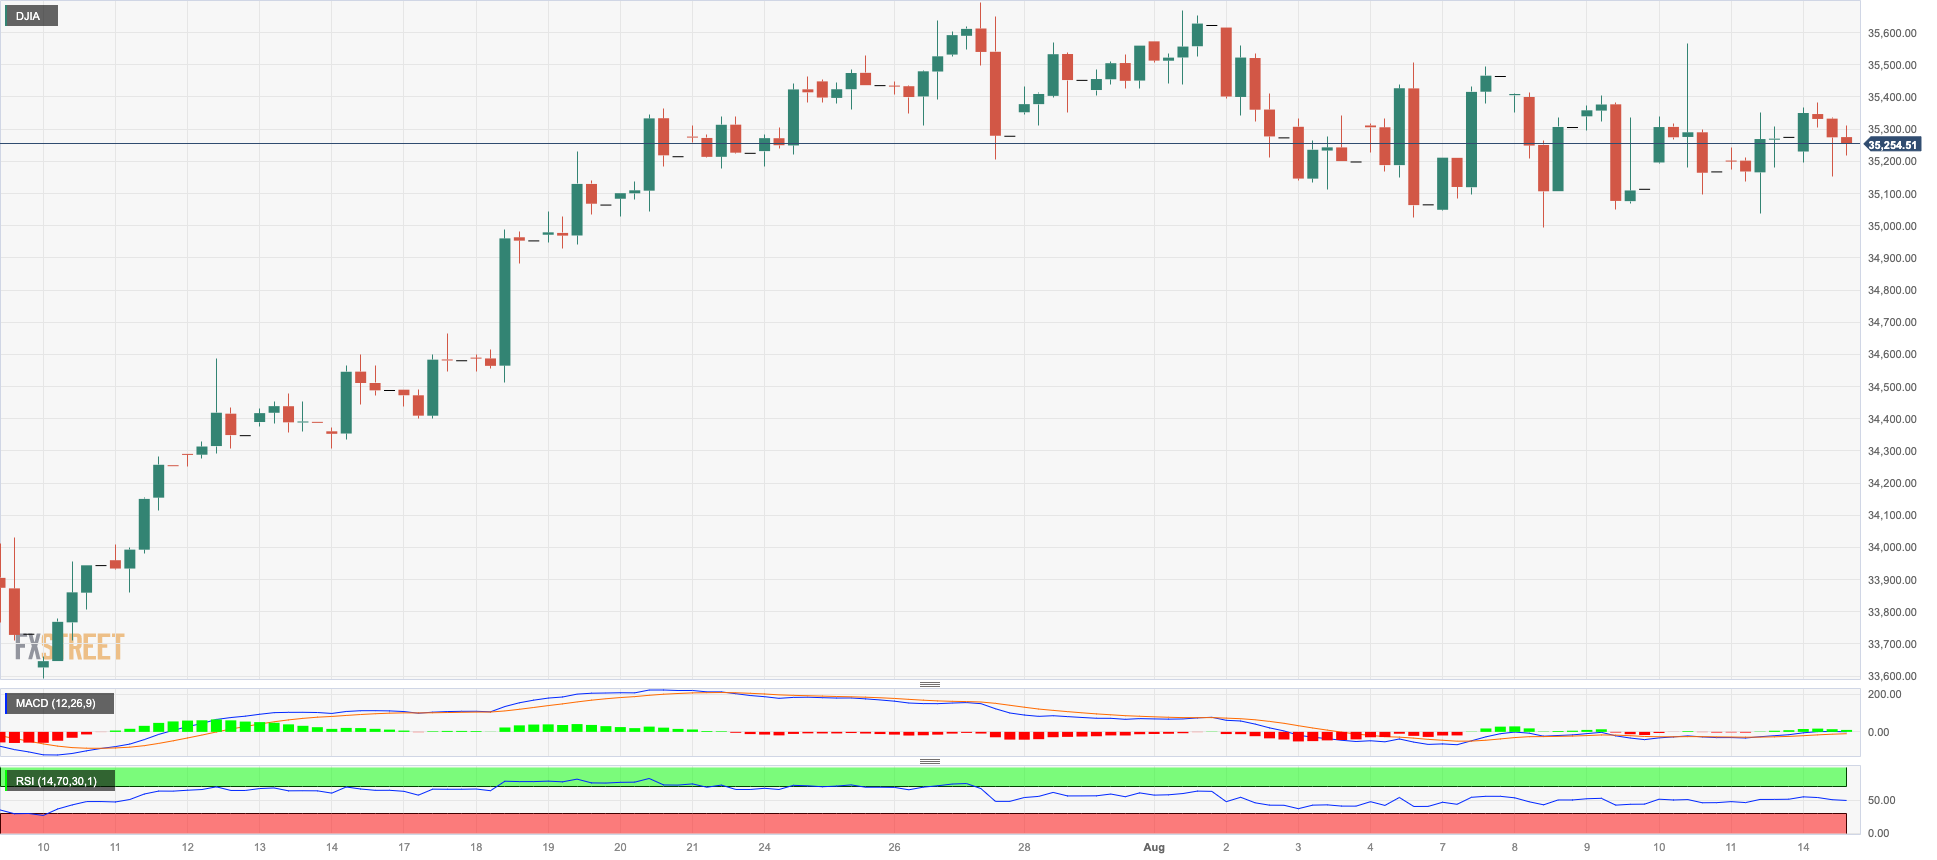
US stocks traded indecisively early in the week, hovering around 35300 according to the Dow Jones benchmark.
Investors adopted a cautious approach as they awaited significant earnings reports from major retailers like Home Depot, Walmart and Target later in the week. Key economic data releases and the forthcoming FOMC Minutes also prompted reservation among market participants on Monday.
All in all, the Dow Jones gained 0.02% to 35289, the S&P500 advanced 0.49% to 4485, and the tech-heavy Nasdaq Composite rose 0.84% to 13757.
The resumption of the uptrend in the Dow Jones targets 2023 high of 35679 (August 1), ahead of the February 2022 high of 35824 (February 9) and the all-time top of 36952 (January 5, 2022). By contrast, the August low of 35007 (August 8) emerges as the immediate contention ahead of the transitory 55-day and 100-day SMAs at 34403 and 33942, respectively. A deeper pullback exposes the July low of 33705 (July 10), before the significant 200-day SMA at 33640. The breakdown of the latter could put the May low of 32586 (May 25) to the test ahead of the 2023 low of 31429 (March 15). The daily RSI looked stable above 56.
Top Performers: Visa A, Salesforce Inc, Merck&Co
Worst Performers: Goldman Sachs, 3M, Caterpillar
Resistance levels: 35679 35824 36513 (4H chart)
Support levels: 35007 34499 33705 (4H chart)
MACROECONOMIC EVENTS
All Information & Updates provided by:

All information relating to the financial markets available on this page has been prepared and issued by FXStreet (Forexstreet SL, Spain, Reg: B62498233) on the basis of publicly available information and all information believed to be reliable and does not conflict with Kuwaiti local laws, and all necessary care has been taken to before the company to ensure that the facts mentioned are correct from the source.
NCM Investment nor any of its directors or employees shall in any way be held responsible for the contents of this news, and the information contained on this page is intended only to provide clients with publicly available information and should not be construed as investment advice, report or analysis and/or constitute an offer or invitation to buy or sell financial instruments of any kind.
RISK WARNING: Forex and CFDs are highly risky leveraged products, as losses can exceed deposits. Please ensure you understand all the risks and take independent advice if necessary. NCM will segregate the clients based on the criteria of the regulator and its bylaws. NCM does not provide any advisory service; the material published does not constitute advice or a recommendation for a transaction in any financial instrument. NCM accepts no responsibility for any use of the content presented and any consequences of that use. Anyone acting on the information provided does so at their own risk.