
- Contact Us:
-

-

-

-


Daily Market Updates
16 Aug 2023
USDJPY
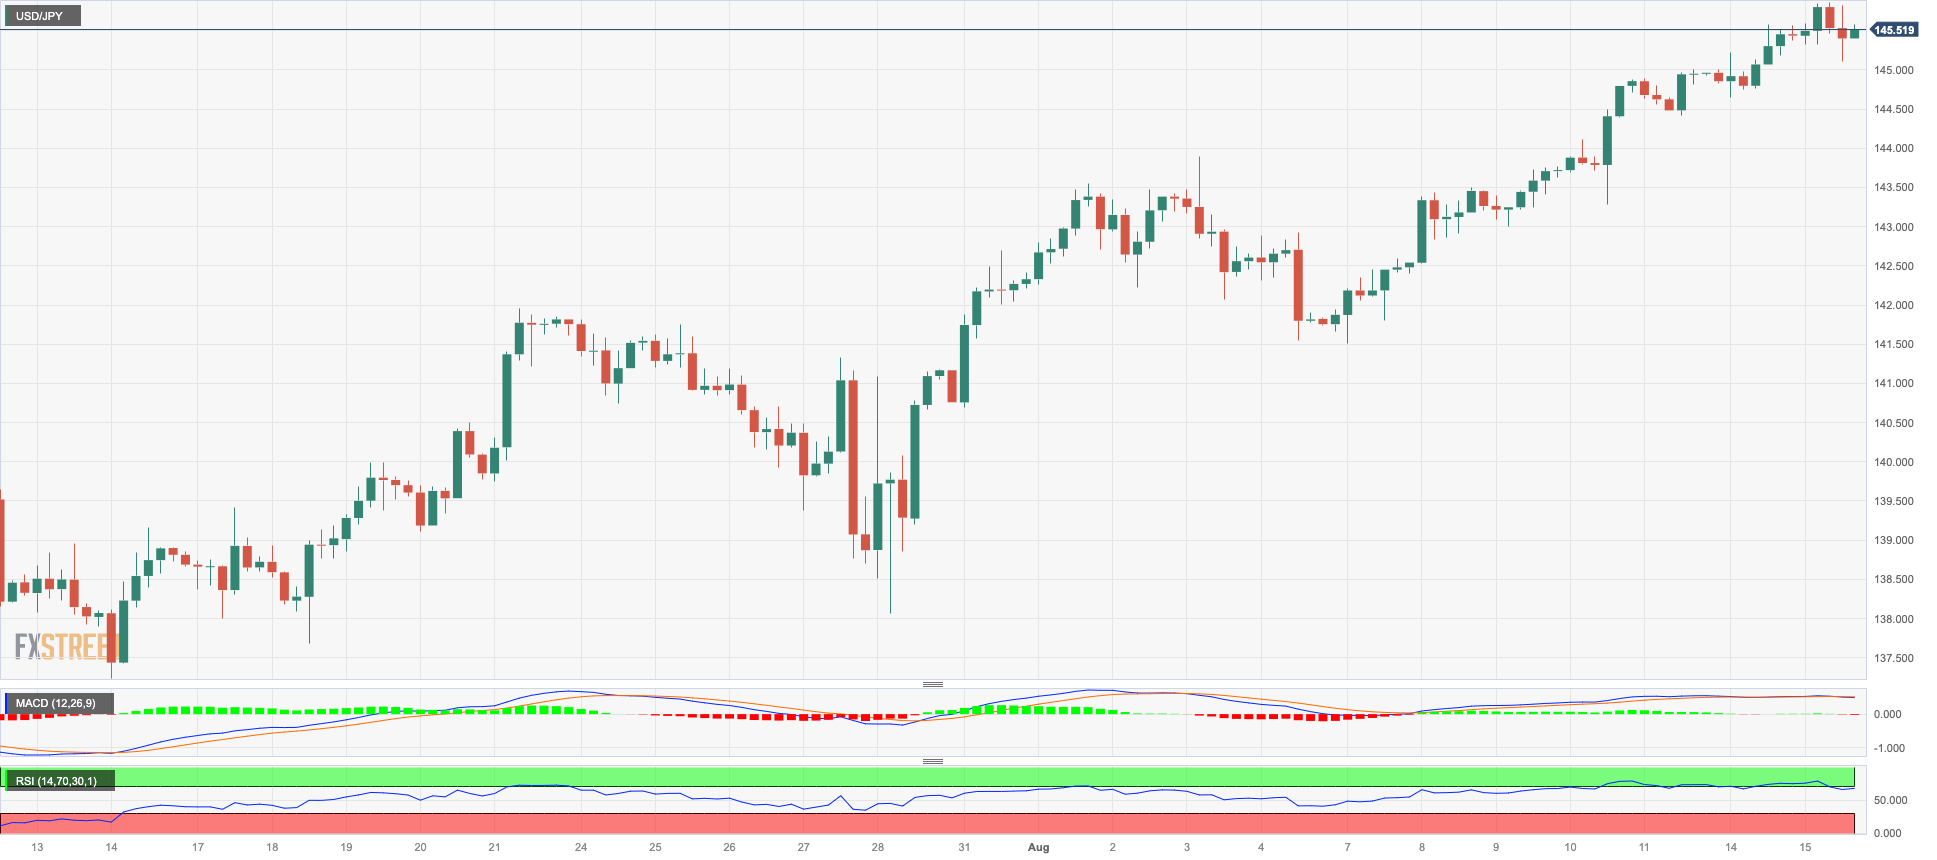
USD/JPY confidently upheld its multi-session rally, surging towards the proximity of 146.00, a milestone it hadn't reached since early November 2022. This noteworthy movement took place amid a somewhat inconclusive price action on Tuesday.
However, it's worth noting that the robust upward trend of the greenback was slightly tempered, even as the upward momentum of US yields across various maturity periods persisted. This was coupled with the lack of significant movement in the yields of Japan's 10-year government bonds, which further supported the pair's potential for additional gains.
Meanwhile, in Japan, preliminary data indicated that the Annualized GDP Growth expanded by 6.0% in the second quarter, with a quarterly growth of 1.5%. Moreover, the final figures for Industrial Production revealed no change on a year-over-year basis up to June.
The 2023 high at 145.86 (August 15) is the next resistance for USD/JPY, followed by the 2022 top at 151.94 (21 October). On the other hand, the interim 55-day SMA at 141.69 is the immediate run-up point ahead of the August low of 141.50 (August 7) and ahead of the weekly low of 138.05 (July 28) and the July low of 137.23 (July 14). If the latter is breached, the spot could target the 200-day SMA at 136.45 before reaching the weekly low at 133.01 (April 26), minor support at 132.01 (April 13) and the April low at 130.62 (April 5). The RSI settled around the 67 area.
Resistance levels: 145.86 146.79 147.56 (4H chart)
Support levels: 143.25 142.03 141.50 (4H chart)
GBPUSD
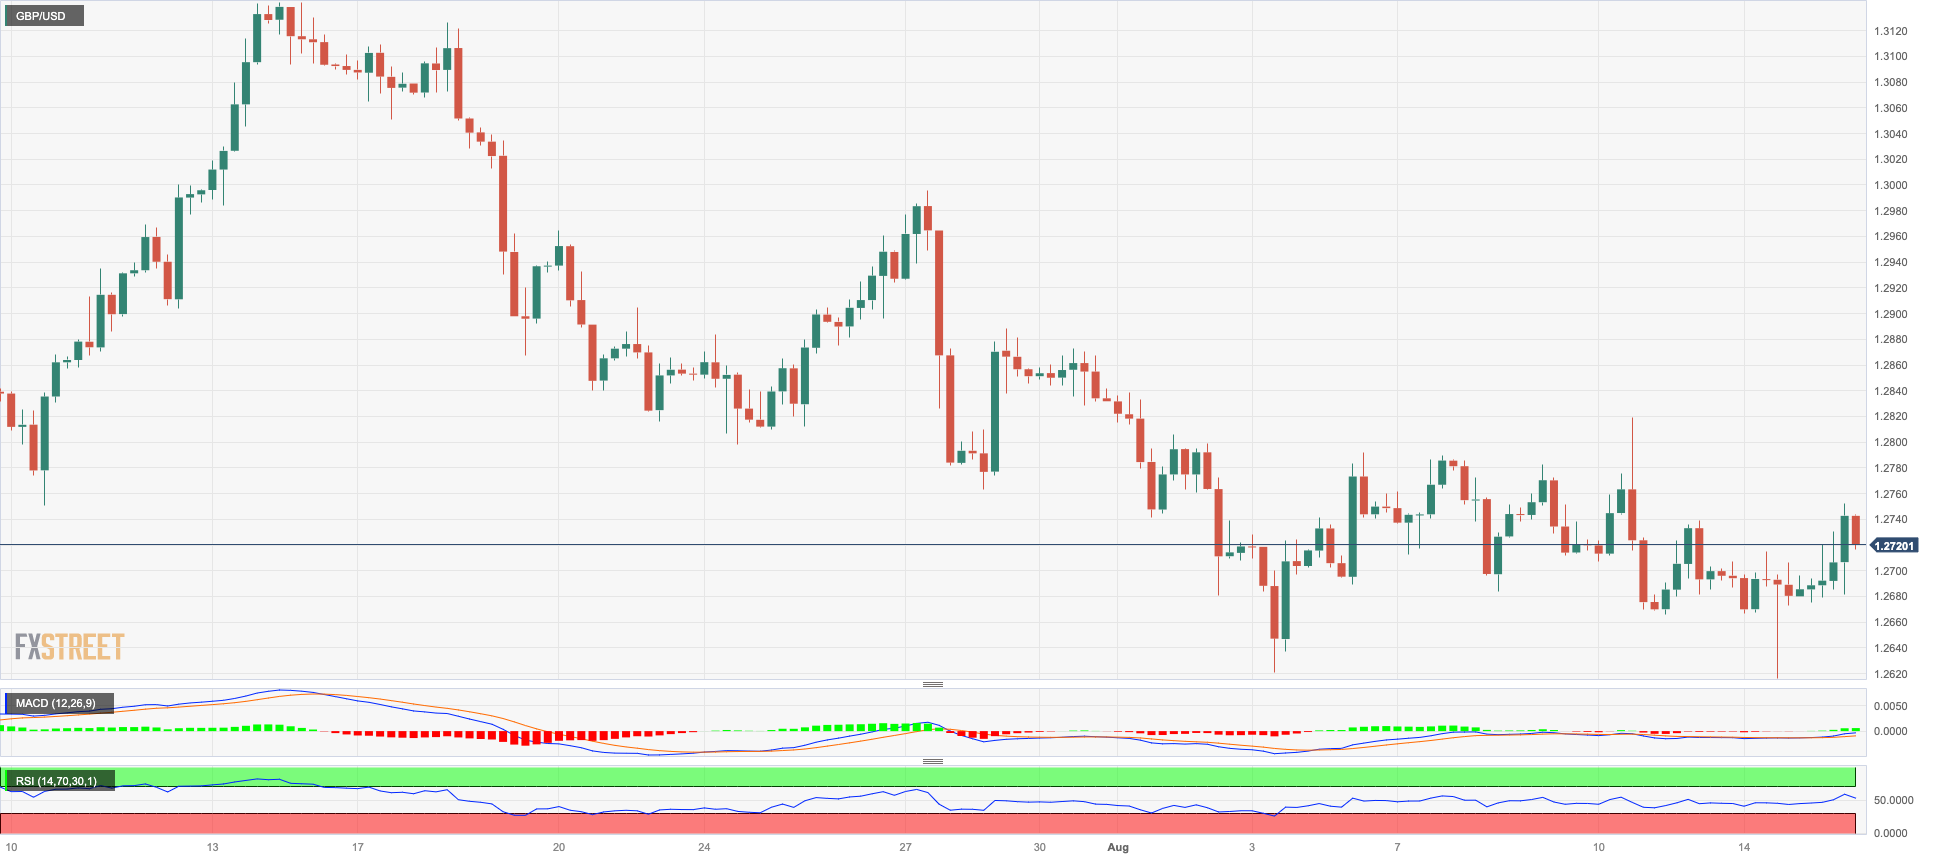
GBP/USD reversed the negative start of the week and surpassed once again the key barrier at 1.2700 the figure on Tuesday.
The corrective decline in the dollar allowed some recovery in the risk-associated universe and pushed Cable back to positive territory and near the transitory 55-day SMA in the 1.2750 area.
In addition, mixed results from the UK labour market showed that unemployment shrank by 66K individuals in May, while the jobless rate ticked higher to 4.2% and Average Earnings Inc. Bonus rose 8.2% in the year to June.
In the meantime, there is a suggestion that there is a probability of over 25% for a 50 bps increase on September 21 and expectations of 25 bps increases on November 2 and December 14. These hikes would result in the bank rate reaching a peak of approximately 6.0%, compared to the starting rate of 5.75% at the beginning of this week.
The weekly high of 1.2818 (August 10) is the first barrier to the upward for GBP/USD, followed by another weekly high of 1.2995 (July 27). The 2023 peak of 1.3142 (14 July) is to the north, followed by weekly highs of 1.3146 (April 14 2022) and 1.3298 (March 15 2022). Cable might reclaim the August low of 1.2616 (August 14), which looks supported by the vicinity of the transitory 100-day SMA (1.2611) and lies ahead of the weekly low of 1.2590 (June 29). The 2021-2023 trendline is about 1.2470, just above the June low of 1.2368 (June 5) and the 200-day SMA at 1.2354. From here, the May low of 1.2308 (May 25) appears. The RSI on a daily basis rose past the 45 mark.
Resistance levels: 1.2752 1.2777 1.2818 (4H chart)
Support levels: 1.2616 1.2591 1.2368 (4H chart)
AUDUSD
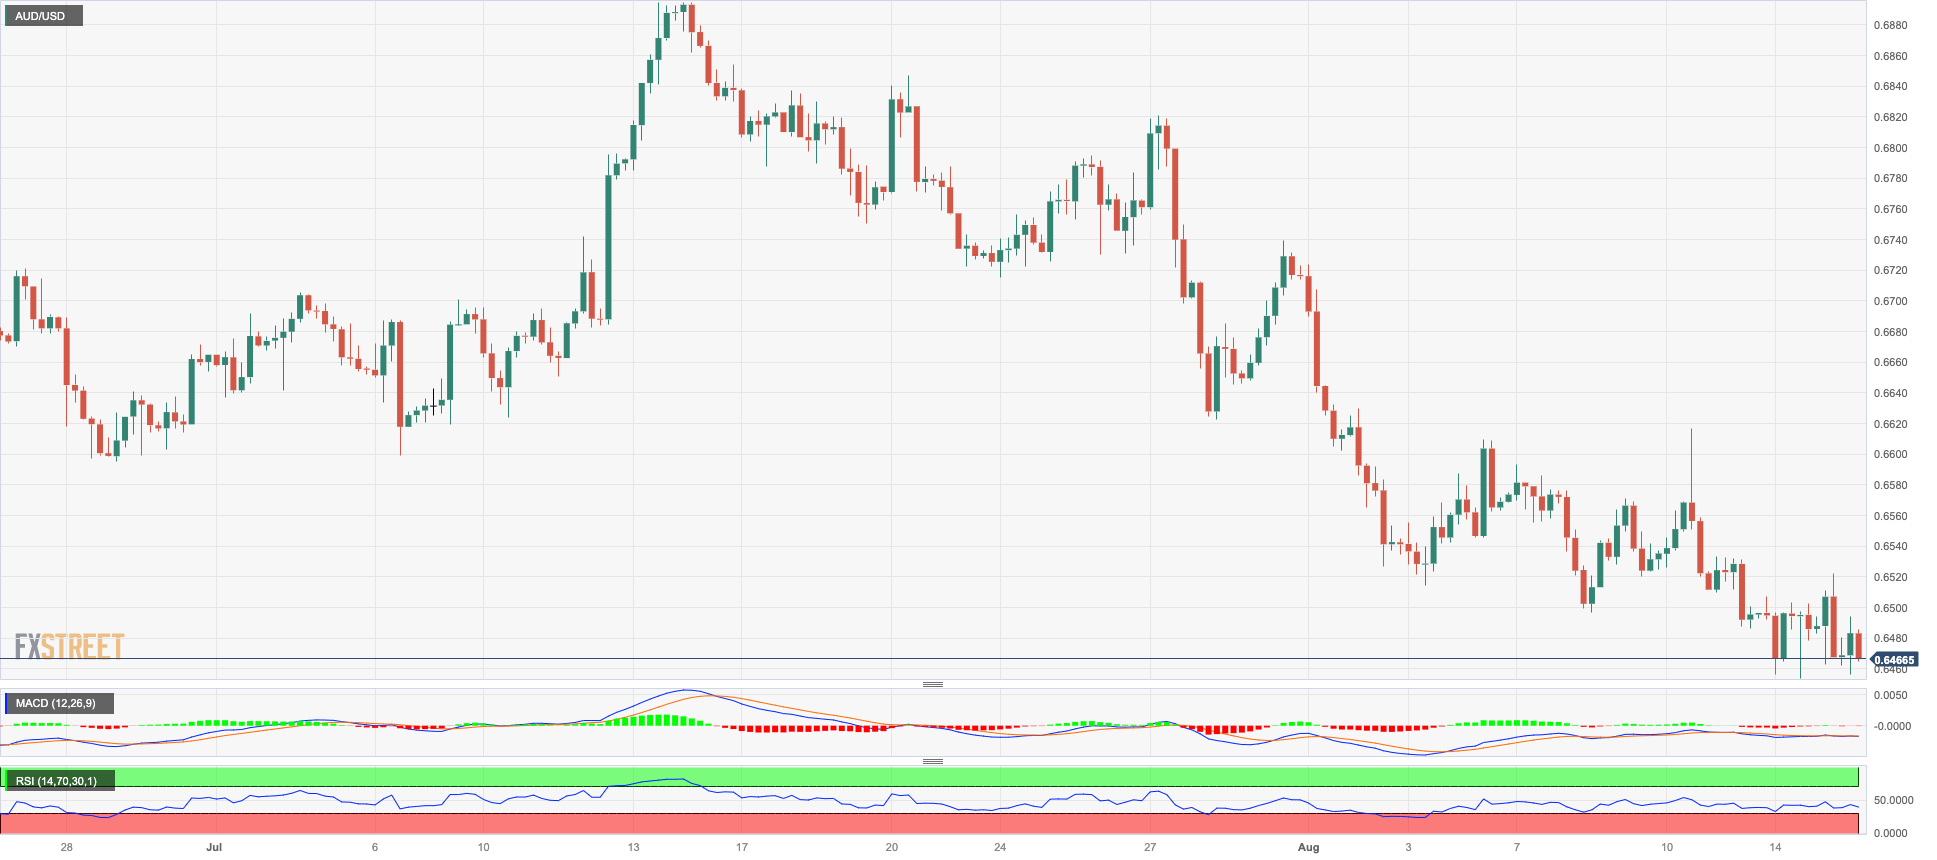
AUD/USD continued its weakness on Tuesday, dropping once again to the 0.6465/60 band - an area near the so far yearly bottom.
The pair’s decline was unusual, as it went against the general downward trend in the value of the greenback. It seems the move was solely because of another round of disappointing economic reports from China for the month of July. These lacklustre statistics from Australia's largest trading partner not only dragged on the Aussie dollar but also weighed on commodity prices globally.
In the Australian docket, the Wage Price Index rose less than expected 3.6% in the April-June period, while according to the RBA Minutes, members noted that there was a plausible trajectory to achieve the inflation target while keeping the cash rate at its current level. The use of this language indicates that a significant threshold has been set for any further rate hikes.
Immediately to the downside for AUD/USD emerges the 2023 bottom of 0.6453 (August 14) seconded by the November 2022 low of 0.6272 (November 3) and the 2022 low of 0.6179 (October 13). By contrast, the 55-day SMA of 0.6683 seems as an intermediate barrier before the important 200-day SMA of 0.6735. The July high of 0.6894 (July 13) appears higher, just ahead of the June top of 0.6899 (June 16). This sector's breakthrough may inspire spot to target the important 0.7000 yardstick prior to the weekly peak of 0.7029 (February 14) and the 2023 high of 0.7157 (February 2). The daily RSI retreated to the sub-33 region.
Resistance levels: 0.6521 0.6616 0.6669 (4H chart)
Support levels: 0.6453 0.6386 0.6272 (4H chart)
GOLD
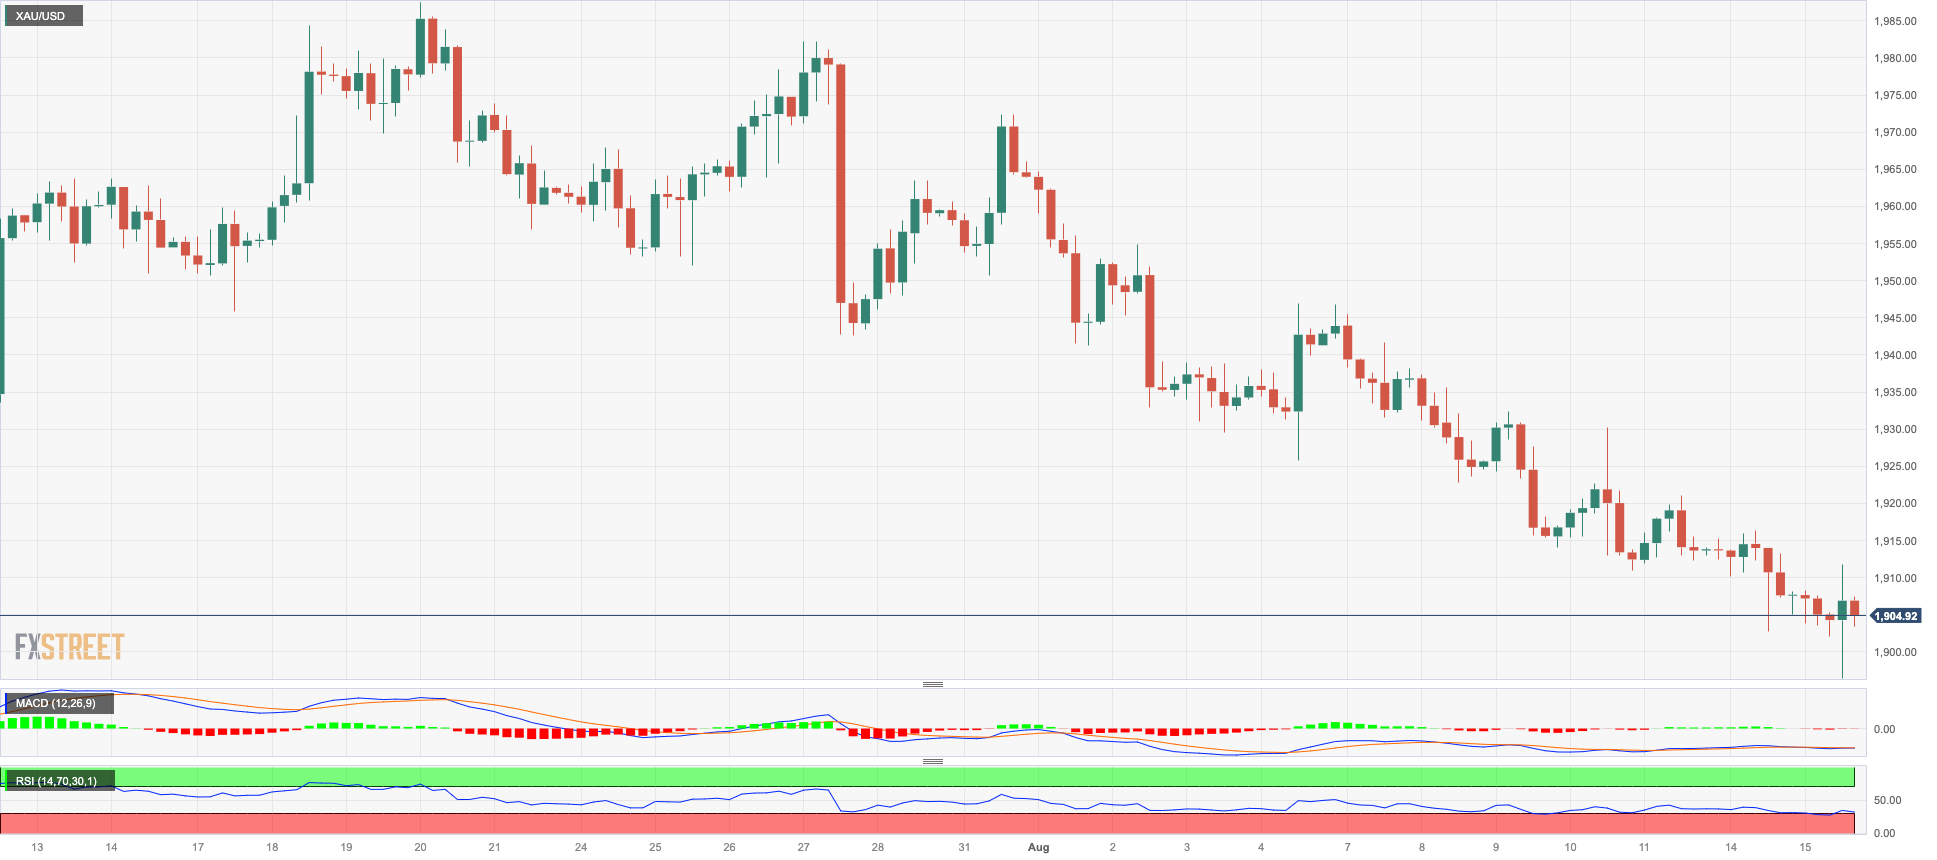
Gold prices steadied on Tuesday after briefly dipping below the key $1900 per troy ounce.
The small rebound came as the dollar trimmed part of its early losses, while US Treasury yields regained momentum and added to the recent strength.
Looking ahead, the ongoing disinflationary trends in the US, coupled with a cooling labor market are likely to keep the Fed on hold for the time being. This should be supportive of some recovery in gold prices in the short-term horizon.
Gold faces the next support of note at the June low of $1893 (June 29), followed by the 2023 low of $1804 (February 28) and the key contention region of $1800. On the flip side, there are provisional hurdles at the 55-day and 100-day SMAs at $1941and $1965, respectively, prior to the July high of $1987 (July 20). If this level is broken, the price could rise to the crucial $2000 level. Beyond that, the path is likely to lead to the 2023 high of $2067 (May 4), which is ahead of the 2022 top of $2070 (March 8) and the record peak of $2075 (August 7, 2020).
Resistance levels: $1924 $1930 $1946 (4H chart)
Support levels: $1893 $1885 $1809 (4H chart)
CRUDE WTI
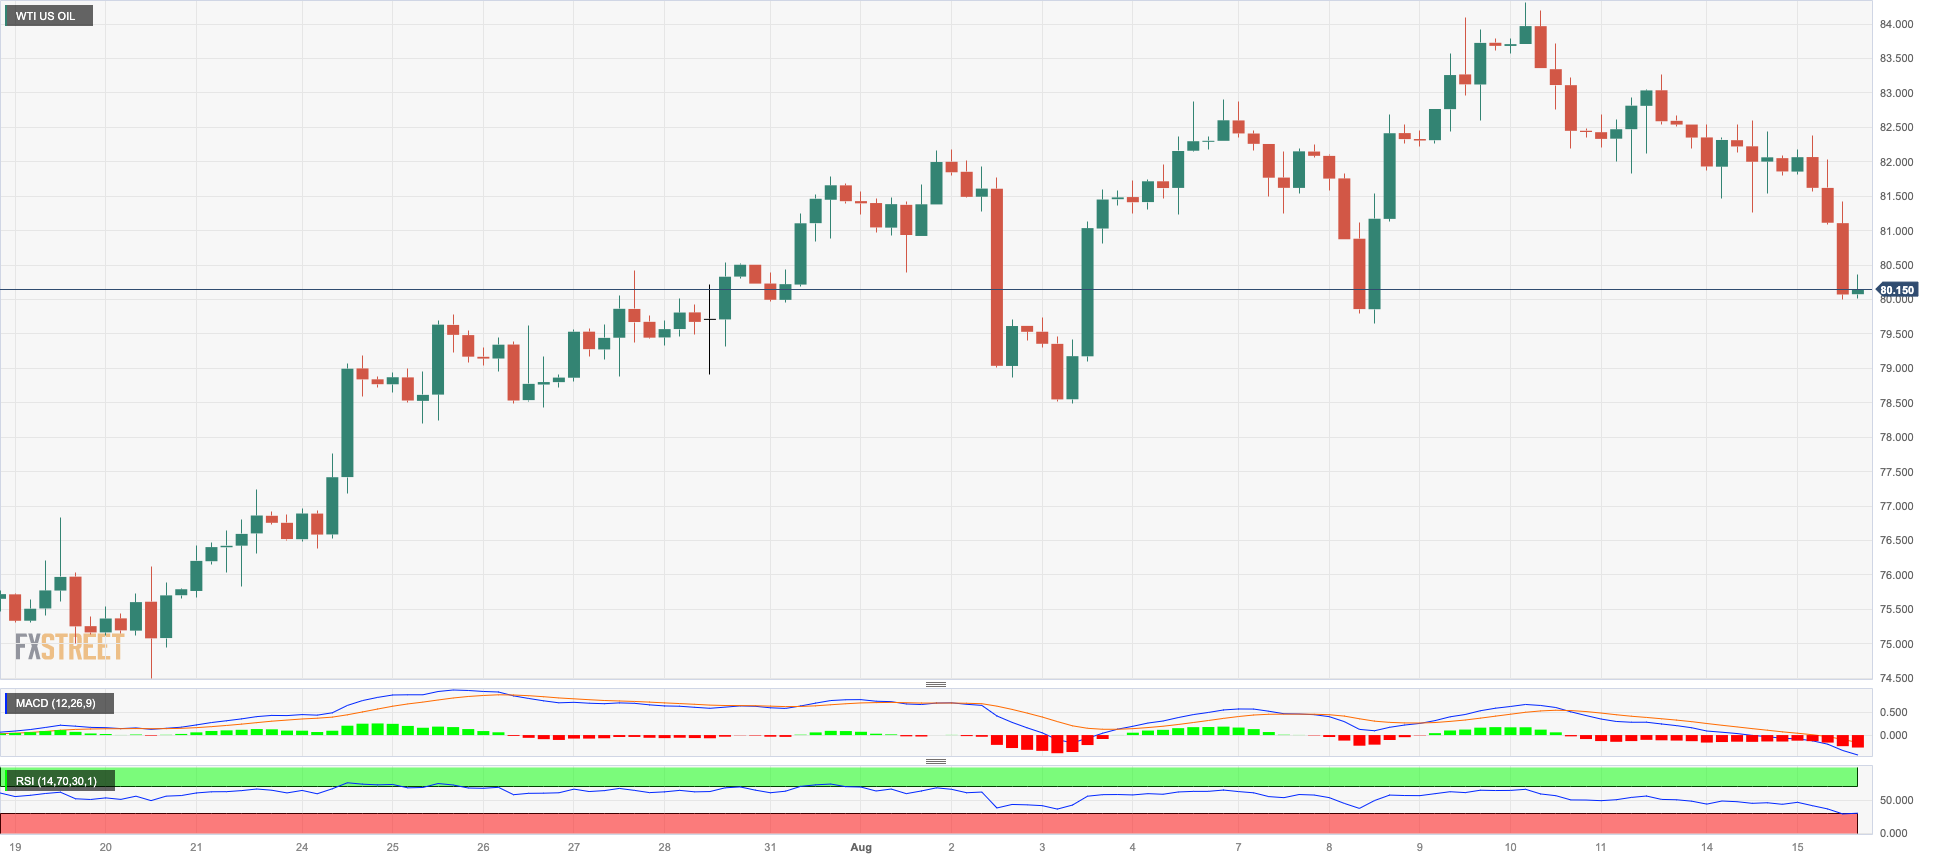
WTI prices extended their decline from Friday and approached the significant $80.00 per barrel level, or multi-day lows, on Tuesday.
The decline in the commodity was mainly driven by growing concerns about the Chinese economy, particularly due to another set of weaker-than-expected fundamentals that further dampened traders' sentiment on Tuesday.
Adding to the downward pressure on prices, investors considered the 15 bps rate cut by the PBoC to its Medium-Term Lending Facility (MLF) rate (now at 2.50%) as inadequate.
Later during the North American session, the American Petroleum Institute (API) will release its report on the weekly inventories of US crude oil for the week ending on August 11, ahead of the official report by the Department of Energy (DoE) on Wednesday.
In case the selling pressure intensifies, WTI should meet the next support at the August low of $78.74 (August 4), which is above the crucial 200-day SMA of $76.37 and the weekly low of $73.89 (July 17). If the latter is cleared, the intermediate 100-day and 55-day SMAs of $74.96 and $74.72 would be exposed, respectively. If WTI falls below this region, it may reach a June low of $66.86 (June 12) before falling to a 2023 low of $63.61 (May 4). A further decline might hit the December 2021 low of $62.46 (December 2), which is close to the crucial level $60.00 per barrel barrier. On the upside, immediate resistance emerges at the 2023 top of $84.85 (August 10) ahead of the November 2022 high of $93.73 (November 7) and the weekly best of $97.65 (August 30, 2022).
Resistance levels: $84.85 $88.5 $90.08 (4H chart)
Support levels: $80.36 $78.66 $77.41 (4H chart)
GER40
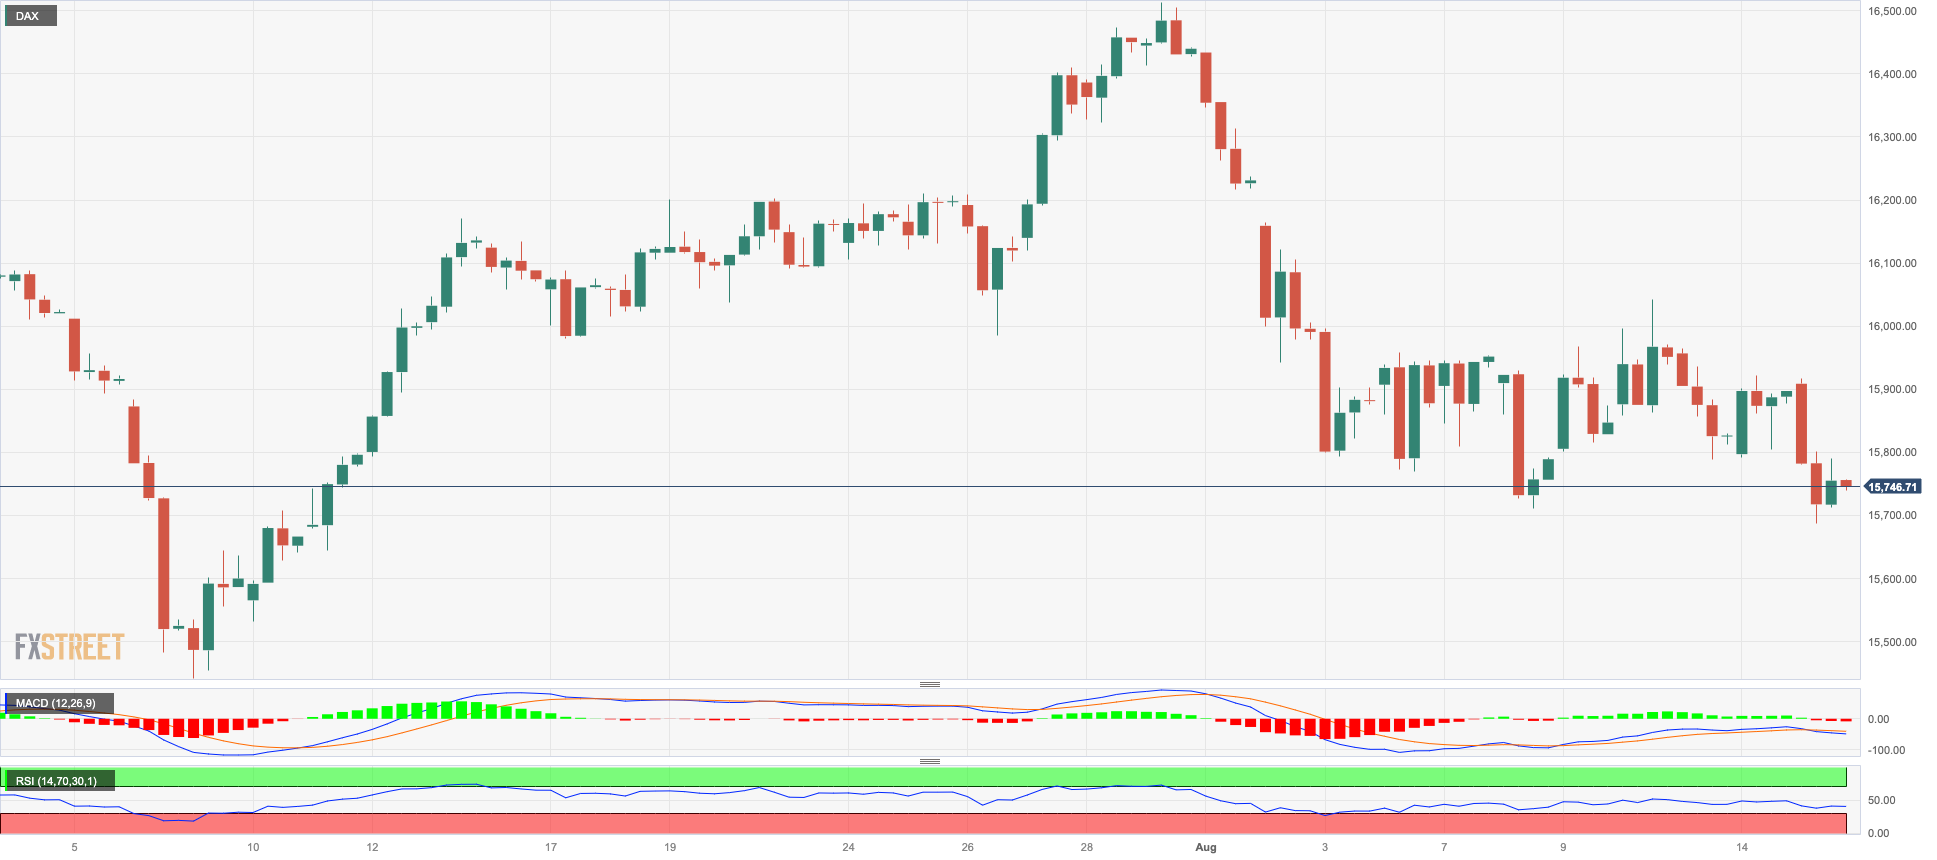
German stocks experienced a drop, reaching their lowest point in five weeks, approximately around the 15700 range, as indicated by the DAX40 benchmark index during Tuesday's trading.
In fact, European blue-chip indices found themselves immersed in a pervasive decline on Tuesday, symbolizing a day of widespread losses.
This trend was influenced by the deepening negative sentiment surrounding China, coupled with the ongoing sluggishness in the economic recovery. This sentiment was further exacerbated by the release of another set of disappointing results early in the day.
Additionally, the PBoC’s decision to trim the 1-year Medium-term Lending Facility rate by 15 bps fell short of expectations.
Interestingly, the index experienced a decline on the same day that German 10-year bund yields displayed improvement, crossing the 2.70% threshold.
For the DAX40, the August low of 15703 (August 15) now seems to be ahead of the July bottom of 15456 (July 7), which comes before the critical 200-day SMA of 15335. If this zone is breached, the index is anticipated to fall to the March low of 14458 (March 20) before testing the December 2022 bottom of 13791 (December 20) and the 2022 low of 11862. A break above the weekly high of 16060 (August 10) should propel the index to its all-time high of 16528 (July 31). The daily RSI broke below the 42 yardstick.
Best Performers: Sartorius AG VZO, Adidas, Heidelbergcement
Worst Performers: E.ON SE, Siemens Energy AG, Vonovia
Resistance levels: 16060 16146 16528 (4H chart)
Support levels: 15703 15456 14809 (4H chart)
NASDAQ
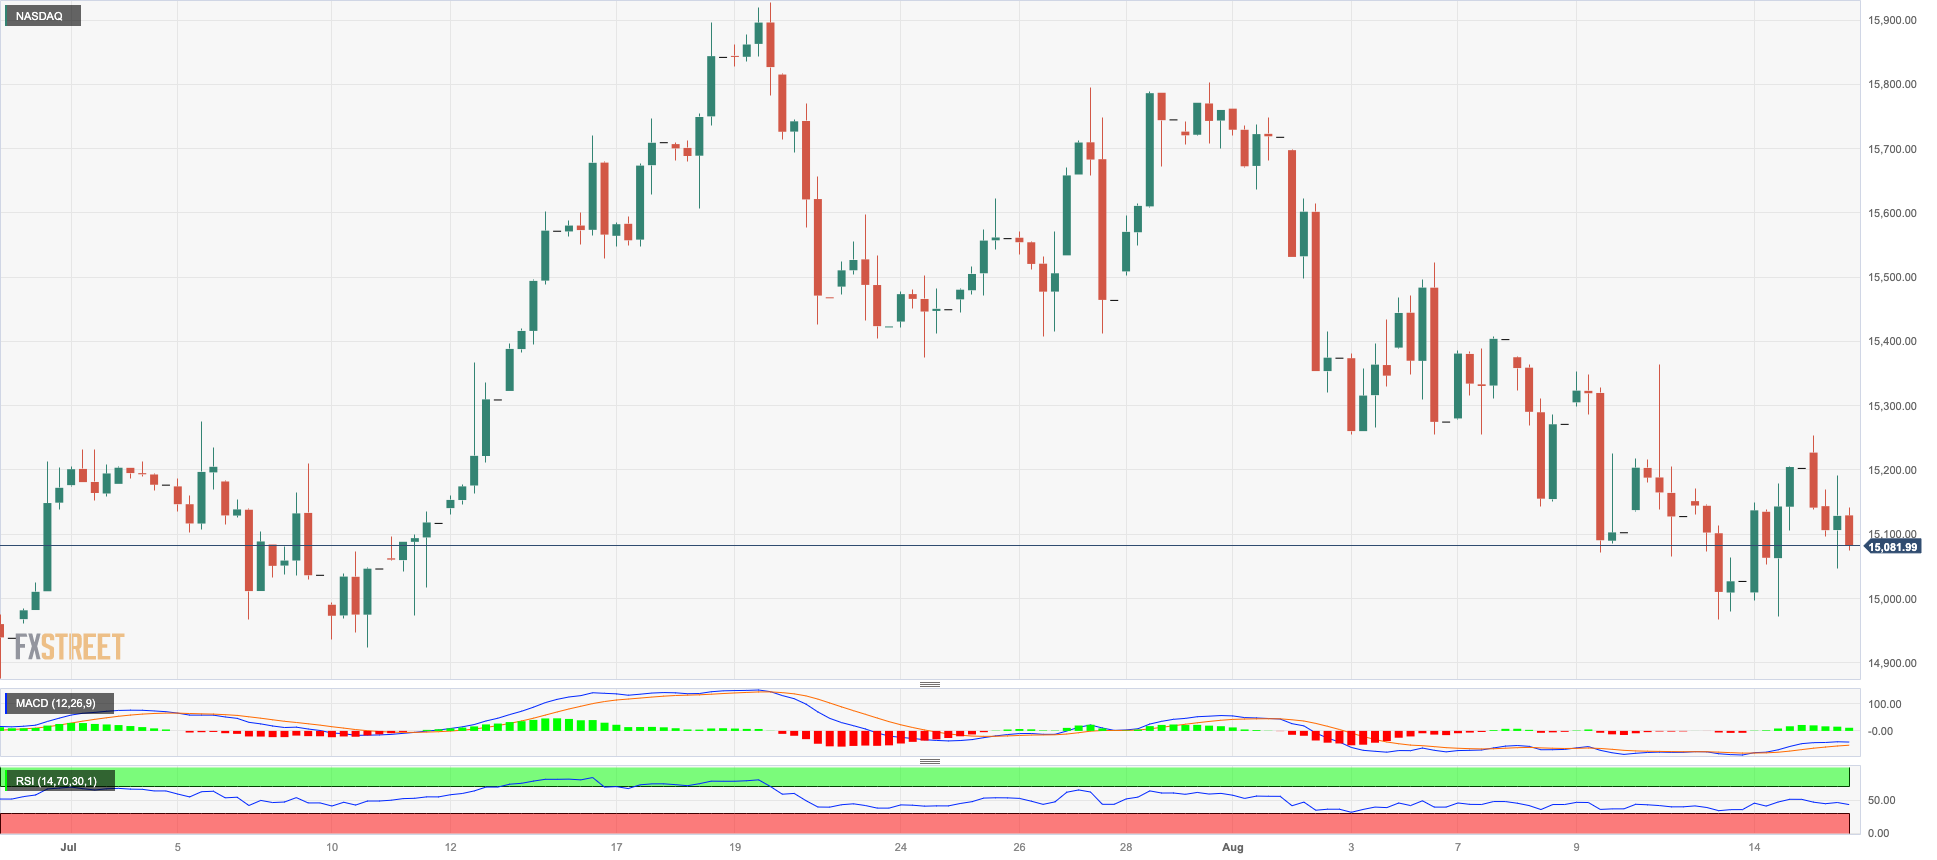
Even the mighty US tech sector couldn't escape the grip of the market's wide-reaching selling spree on Tuesday. This pressure caused the prominent Nasdaq 100 index to relinquish some of the positive momentum it had built up at the beginning of the trading week.
The air of worry around the US banking sector, combined with the surge in yields across various maturities in the US, and the unsettling notion that the Fed might hold interest rates at their current elevated levels for an extended duration, all conspired to quell any aspirations for bullish market moves on Tuesday.
Next on the downside for the Nasdaq 100 emerges the August low of 14972 (August 14). The breakdown of this level could open the door to a potential visit to the July low of 14924 (July 10) ahead of weekly lows of 14687 (June 26), 14283 (June 7), and 13520 (May 24) as it moves south. The 200-day SMA at 12989 appears to be confirming the May low of 12938 (May 4), which is higher than the April low of 12724 (April 25). Conversely, the weekly high of 15803 (July 31) keeps the 2023 top of 15932 (July 19) and the round level of 16000 from being attained. The RSI retreated to the proximity of 44.
Top Gainers: Amgen, Workday, NVIDIA
Top Losers: Lucid Group, PayPal Holdings Inc, PDD Holdings DRC
Resistance levels: 15419 15795 15932 (4H chart)
Support levels: 14972 14924 14687 (4H chart)
DOW JONES
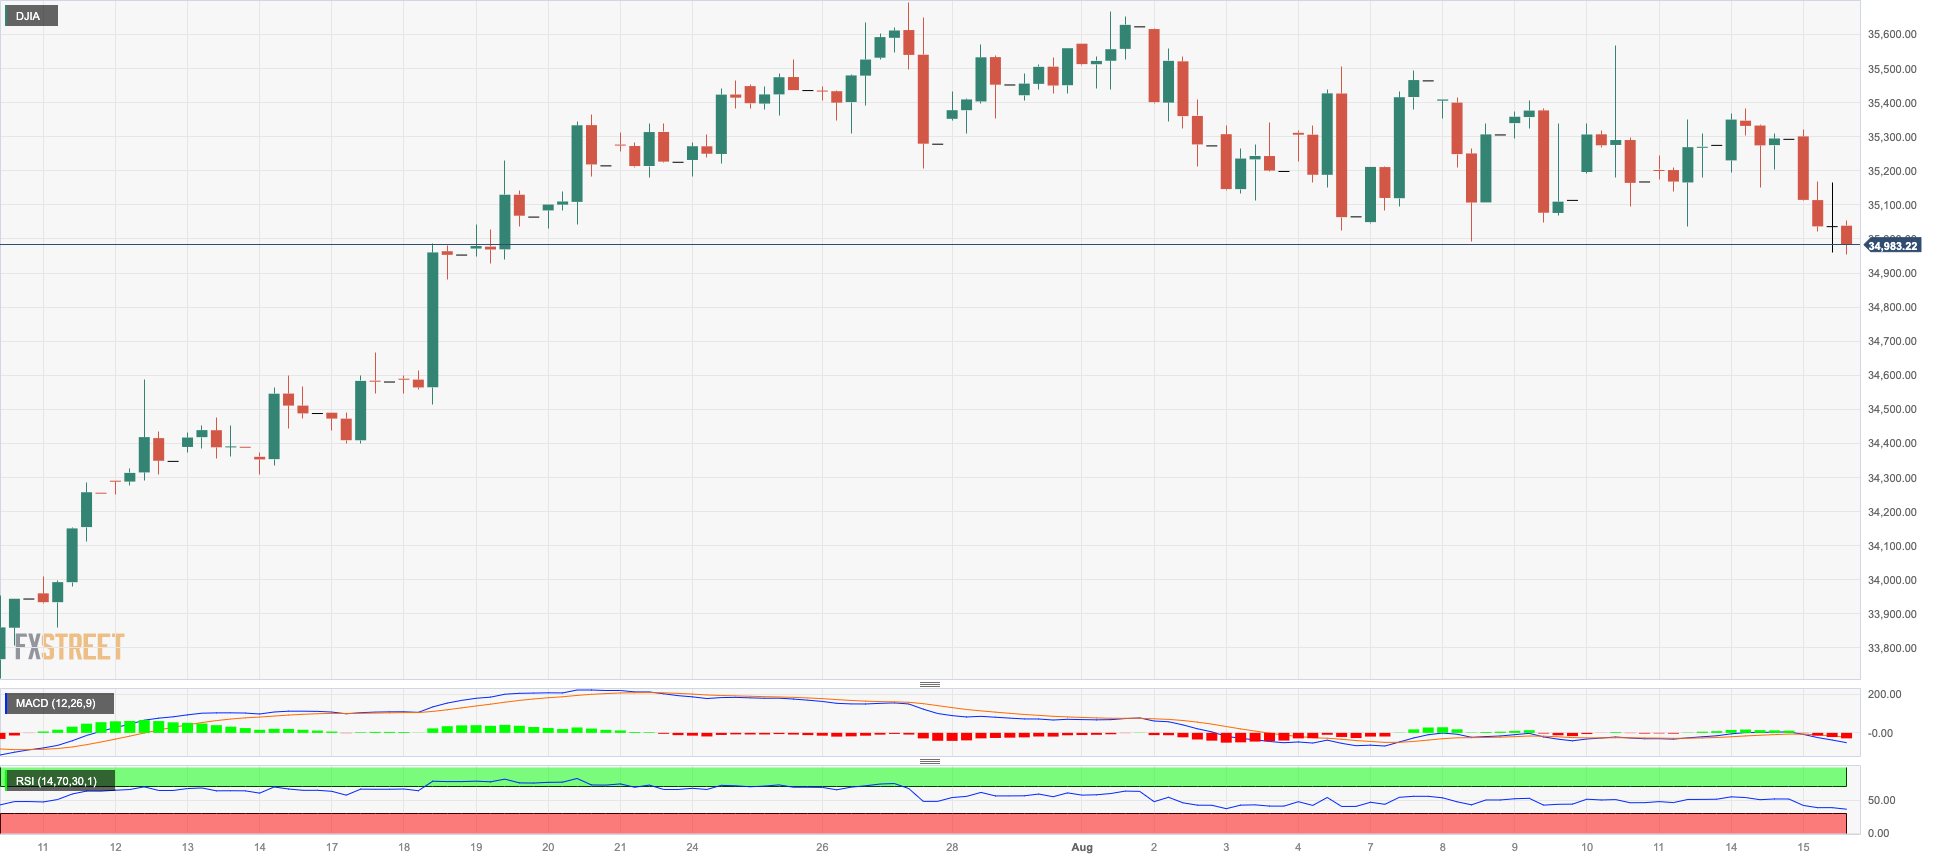
US equities left behind three consecutive daily advances and dropped to new four-week lows in the sub-35000 region on turnaround Tuesday.
The daily losses in the US benchmark index followed investors’ concerns that the Federal Reserve might maintain interest rates in restrictive territory for longer than previously anticipated, all after stronger-than-expected US Retail Sales underpinned the perception of resilient consumer spending.
Also adding to the generalized bearish note emerged renewed concerns over the US banking industry in response to the likelihood that credit agency Fitch could downgrade some US lenders.
On the whole, the Dow Jones retreated 0.85% to 35006, the S&P500 dropped 0.92% to 4442, and the tech-focused Nasdaq Composite deflated 0.81% to 13676.
Extra weakness in the Dow Jones could see the transitory 55-day and 100-day SMAs at 34445 and 33973, respectively, revisited. A deeper correction reveals the July low of 33705 (July 10) before the key 200-day SMA at 33657. The latter's collapse might put the May low of 32586 (May 25) to the test before the 2023 low of 31429 (March 15). Just the opposite, bulls continue to target the 2023 high of 35679 (August 1) prior to the February 2022 top of 35824 (February 9) and the all-time peak of 36952 (January 5, 2022). The daily RSI deflated to the sub-50 zone.
Top Performers: Amgen, Home Depot, J&J
Worst Performers: Dow, Chevron, Caterpillar
Resistance levels: 35679 35824 36513 (4H chart)
Support levels: 34966 33949 33705 (4H chart)
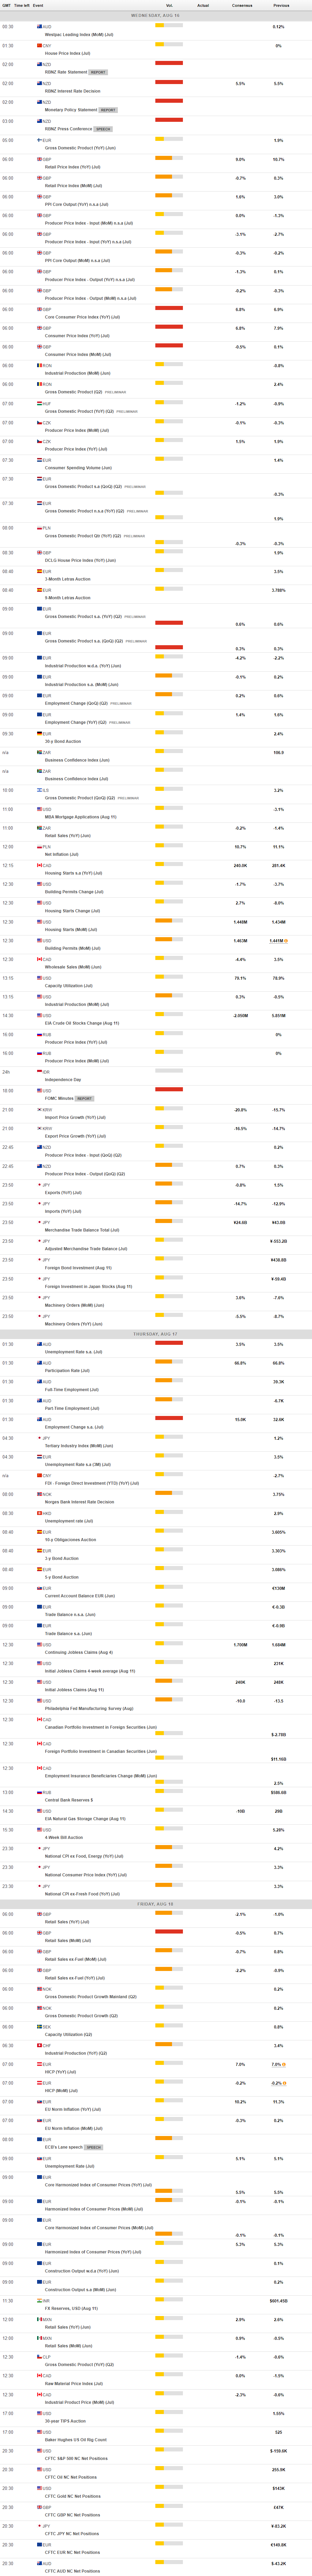
MACROECONOMIC EVENTS
All Information & Updates provided by:

All information relating to the financial markets available on this page has been prepared and issued by FXStreet (Forexstreet SL, Spain, Reg: B62498233) on the basis of publicly available information and all information believed to be reliable and does not conflict with Kuwaiti local laws, and all necessary care has been taken to before the company to ensure that the facts mentioned are correct from the source.
NCM Investment nor any of its directors or employees shall in any way be held responsible for the contents of this news, and the information contained on this page is intended only to provide clients with publicly available information and should not be construed as investment advice, report or analysis and/or constitute an offer or invitation to buy or sell financial instruments of any kind.
RISK WARNING: Forex and CFDs are highly risky leveraged products, as losses can exceed deposits. Please ensure you understand all the risks and take independent advice if necessary. NCM will segregate the clients based on the criteria of the regulator and its bylaws. NCM does not provide any advisory service; the material published does not constitute advice or a recommendation for a transaction in any financial instrument. NCM accepts no responsibility for any use of the content presented and any consequences of that use. Anyone acting on the information provided does so at their own risk.