
- Contact Us:
-

-

-

-


Daily Market Updates
17 Aug 2023
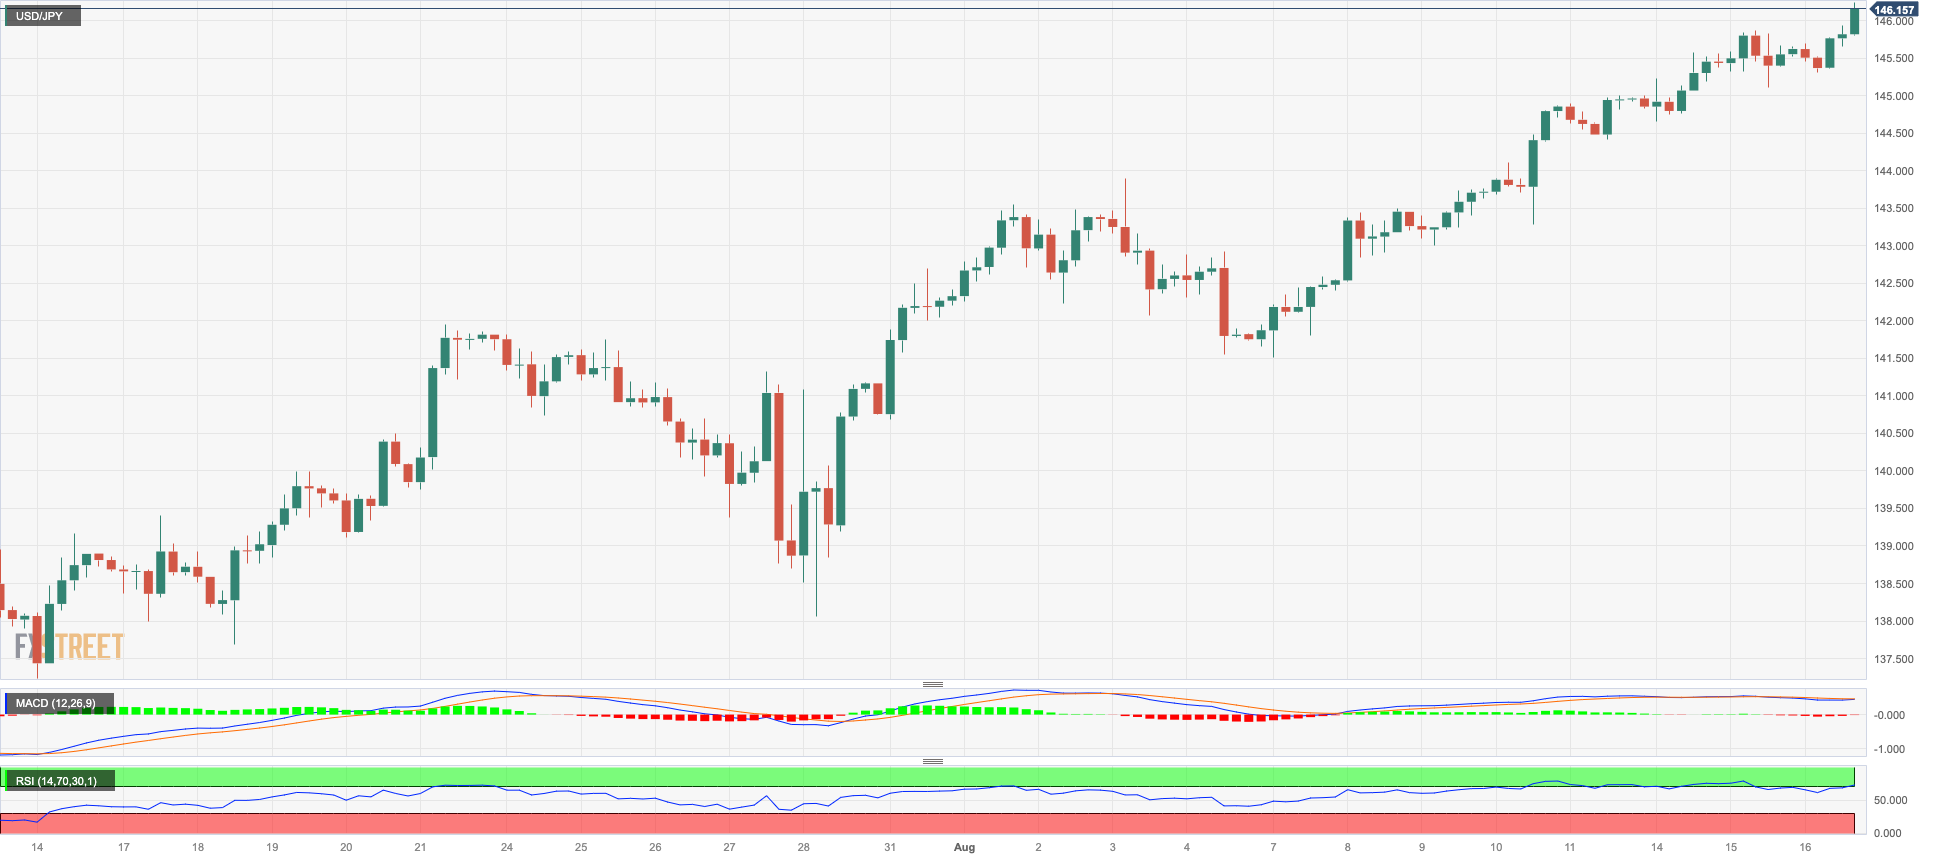
USDJPY
The upward movement in USD/JPY remained unabated and this time the pair surpassed the 146.00 mark to print new 2023 tops on Wednesday.
The pair exhibited another positive price movement in response to additional buying interest around the greenback, while further enthusiasm in the US money market also played a role in the solid daily performance.
Meanwhile, in Japan, the yields on JGB 10-year bonds slightly surpassed the 0.63% threshold, thereby prolonging the overall consolidative sentiment for the week.
In the domestic data space, the Reuters Tankan Index showed an improvement to 12 for the current month, up from the previous reading of 3.
The next obstacle for USD/JPY is the 2023 high at 146.24 (August 16), followed by the 2022 top at 151.94. (21 October). Having said that, the intermediate 55-day SMA at 141.80 is the immediate contention ahead of the August low of 141.50 (August 7). The loss of the latter exposes a potential drop to the weekly low of 138.05 (July 28) prior to the July low of 137.23 (July 14) and the 200-day SMA at 136.45. A deeper decline could open the door to the weekly low of 133.01 (April 26), seconded by the minor support at 132.01 (April 13), and the April low of 130.62 (April 5). The RSI flirted with the overbought nation above 69.
Resistance levels: 146.24 146.79 147.56 (4H chart)
Support levels: 145.10 144.39 143.25 (4H chart)
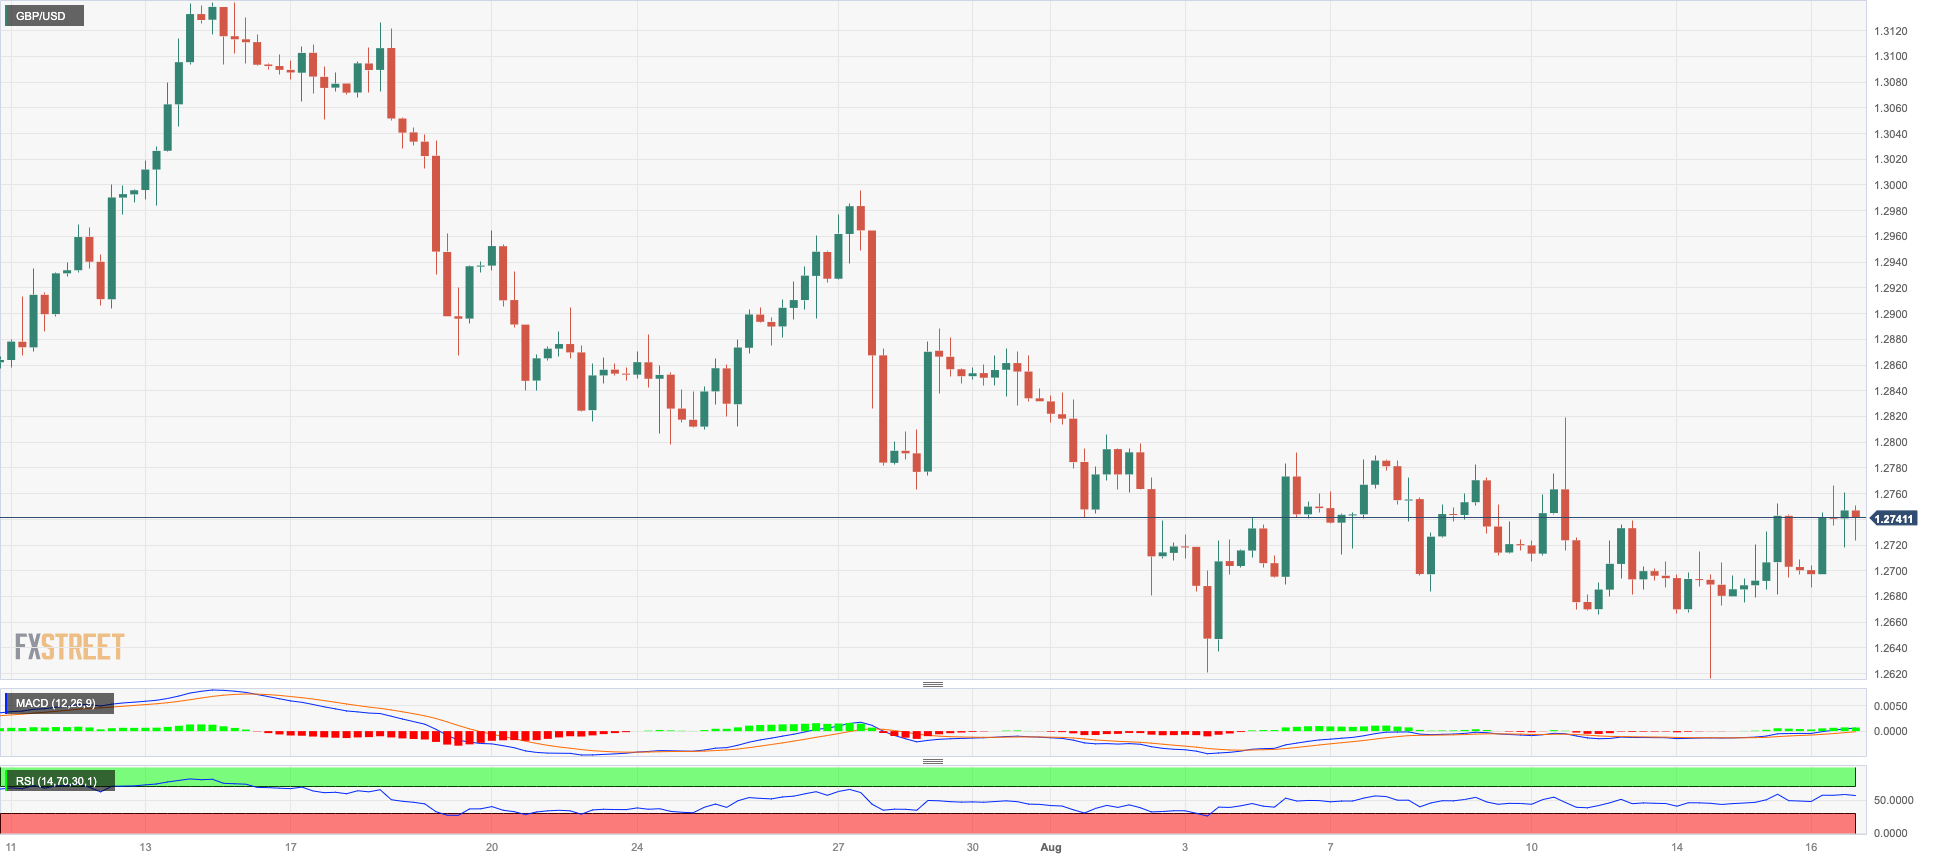
GBPUSD
GBP/USD extended its recovery on Wednesday, adding to the weekly gains and further breaking above the key 1.2700 resistance level.
Further strength in the greenback prompted the US Dollar Index (DXY) to revisit the area of recent peaks, although the sterling appears to have survived to the strong U-turn in the buck.
Furthermore, the quid received an additional lift from the latest UK inflation figures. Indeed, while headline inflation came in at 6.8% YoY in July (from 7.9%), core inflation remained sticky at 6.9% from a year earlier.
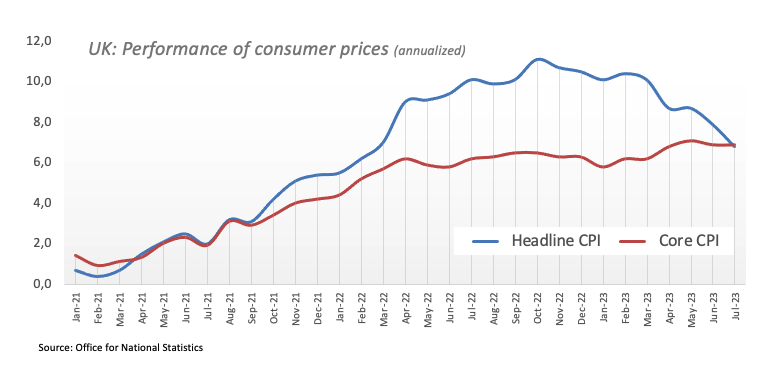
Following the release of the UK CPI data, expectations of further monetary tightening by the Bank of England have increased. Market pricing now implies over a 20% chance of a 50 bps hike in September, with 25 bps increases still anticipated in November and February. This forecasts the Bank Rate peaking near 6.0%, up from projections earlier this week of 5.75% and last month of 6.5%.
The initial hurdle to the upward for GBP/USD is the weekly high of 1.2818 (August 10), followed by another weekly high of 1.2995 (July 27). To the north, the 2023 top of 1.3142 (July 14) is seconded by weekly highs of 1.3146 (April 14 2022) and 1.3298 (March 15 2022). On the downside, the August low of 1.2616 (August 14) appears to be supported by the transitory 100-day SMA at 1.2619 and is ahead of the weekly low of 1.2590 (June 29). The 2021-2023 trendline is about 1.2460, prior to the June low of 1.2368 (June 5), which appears underpinned by the 200-day SMA of 1.2367. Down from here comes the May low of 1.2308 (May 25). The everyday RSI approached the 47 level.
Resistance levels: 1.2766 1.2777 1.2818 (4H chart)
Support levels: 1.2616 1.2591 1.2368 (4H chart)
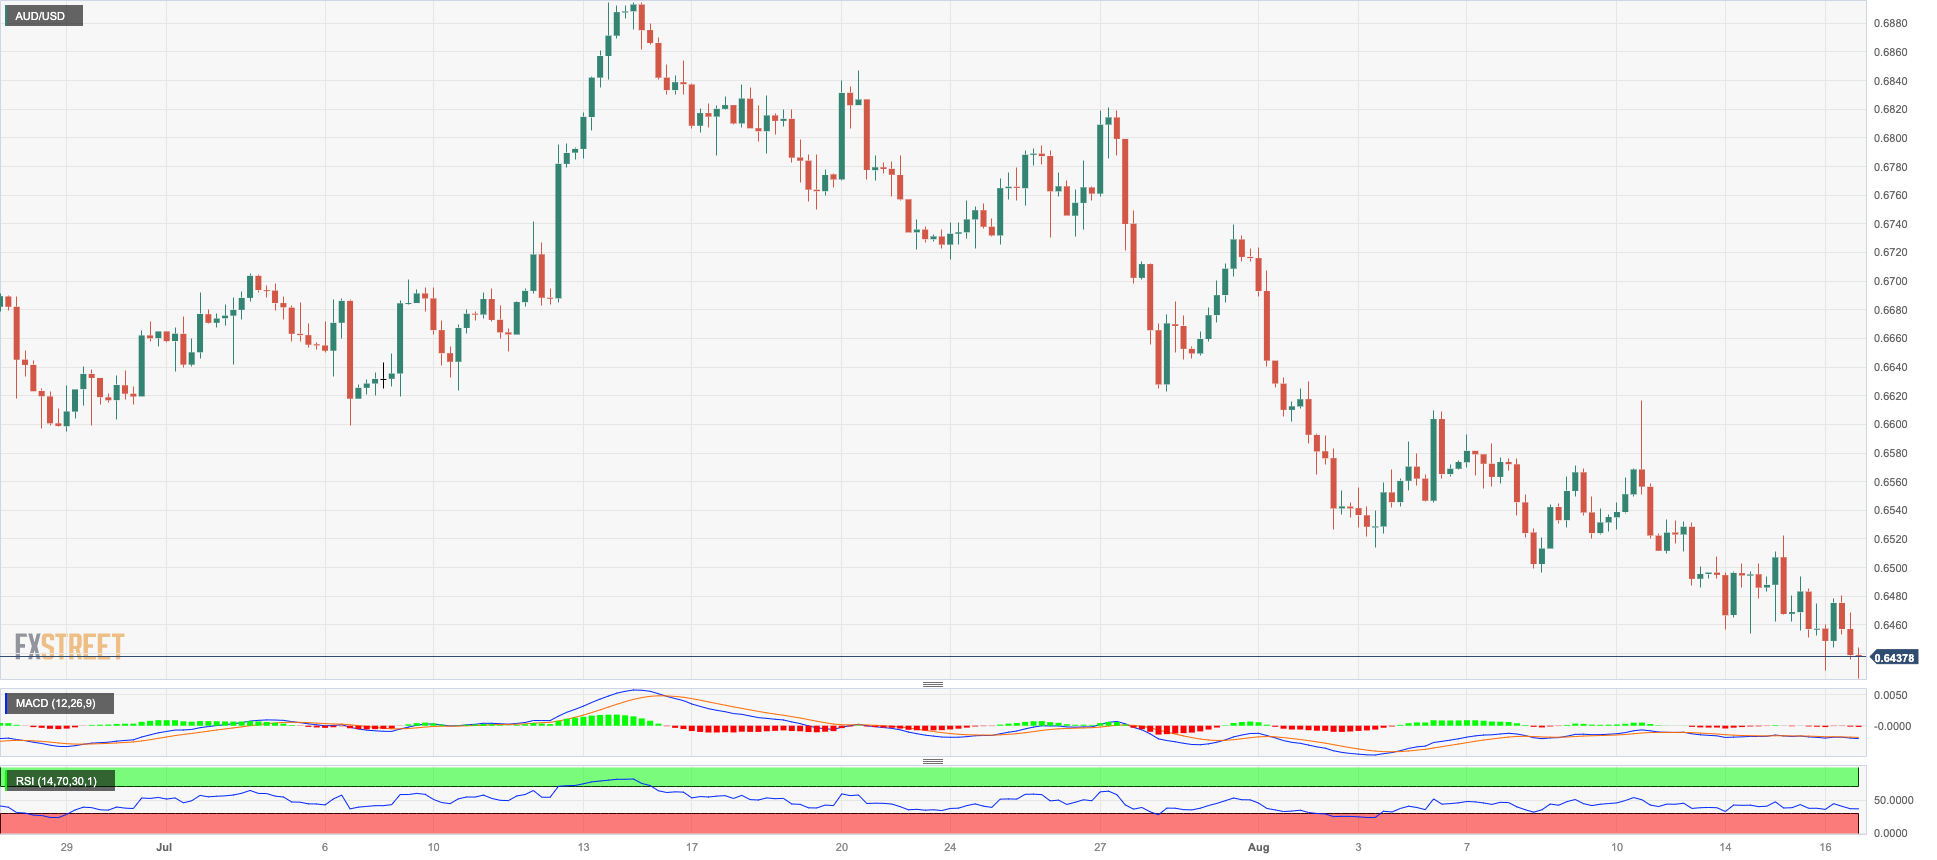
AUDUSD
AUD/USD traded well on the defensive on Wednesday and recorded a new yearly low near 0.6420.
The poor performance of the commodity complex, combined with a late rebound in the buck, weighed on the Aussie dollar. Concerns about the still-lacklustre recovery in China's economy also contributed to the downbeat mood among investors.
In the Australian calendar, the Westpac Leading Index came in flat on a monthly basis in July.
Immediately on the downside of AUD/USD, the 2023 low emerges at 0.6427 (August 16), followed by the November 2022 low at 0.6272 (3 November) and the 2022 low at 0.6179 (13 October). Just the opposite, there is a minor hurdle at the weekly high at 0.6616 (August 10) ahead of the provisional 55-day SMA at 0.6682. The breakout of this region could put the important 200-day SMA at 0.6735 to the test prior to the July top of 0.6894 (13 July), which is closely followed by the June peak of 0.6899 (June 16). The break of this sector could lead to targeting the key 0.7000 yardstick before the weekly peak of 0.7029 (February 14) and the 2023 top of 0.7157 (February 2). The RSI on the daily chart entered the oversold territory around 29.
Resistance levels: 0.6521 0.6616 0.6669 (4H chart)
Support levels: 0.6422 0.6386 0.6272 (4H chart)
GOLD
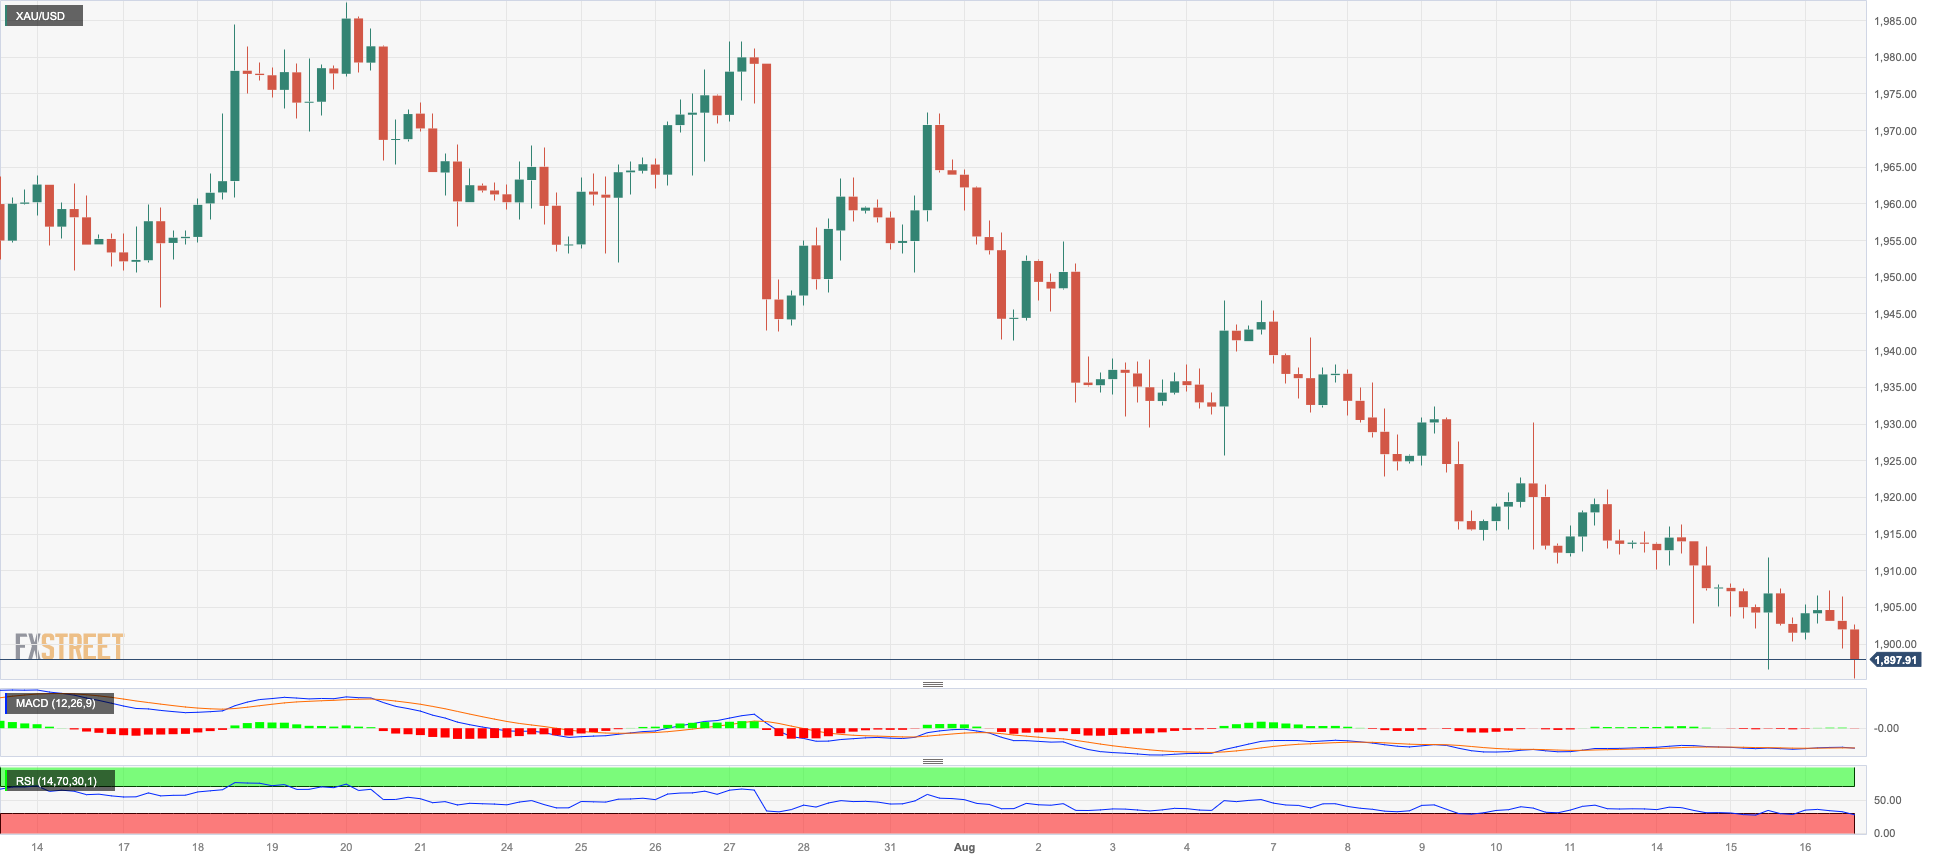
The price movement of gold exhibited a negative pattern and broke below the crucial $1900 mark per troy ounce on Wednesday.
A late recovery in the greenback, coupled with a bounce in yields across various maturities in the US debt market, exerted downward pressure on the precious metal. This dynamic maintained the ongoing four-week stretch of declines intact.
As we peer into the future, the price trajectory of gold is expected to tread carefully in light of the unwavering strength of the US economy. This strength contrasts with the prevailing trends of persistent disinflationary pressures and a slight cooling in the labour market, all of which seem to support the view of a tighter-for-longer Fed in the months to come.
The next level of support for gold is at the June low of $1893 (June 29), followed by the 2023 low of $1804 (February 28) and the crucial contention region of $1800. On the upside, there are preliminary resistance levels at the 55-day and 100-day SMAs of $1940 and $1964, respectively, prior to the July high of $1987 (July 20). If this level is surpassed, the price may surge to the critical $2000 mark. Beyond that, the road is anticipated to go to the 2023 high of $2067 (May 4), which will be followed by the 2022 top of $2070 (March 8) and the record peak of $2075 (August 7, 2020).
Resistance levels: $1911 $1930 $1946 (4H chart)
Support levels: $1893 $1885 $1809 (4H chart)
CRUDE WTI
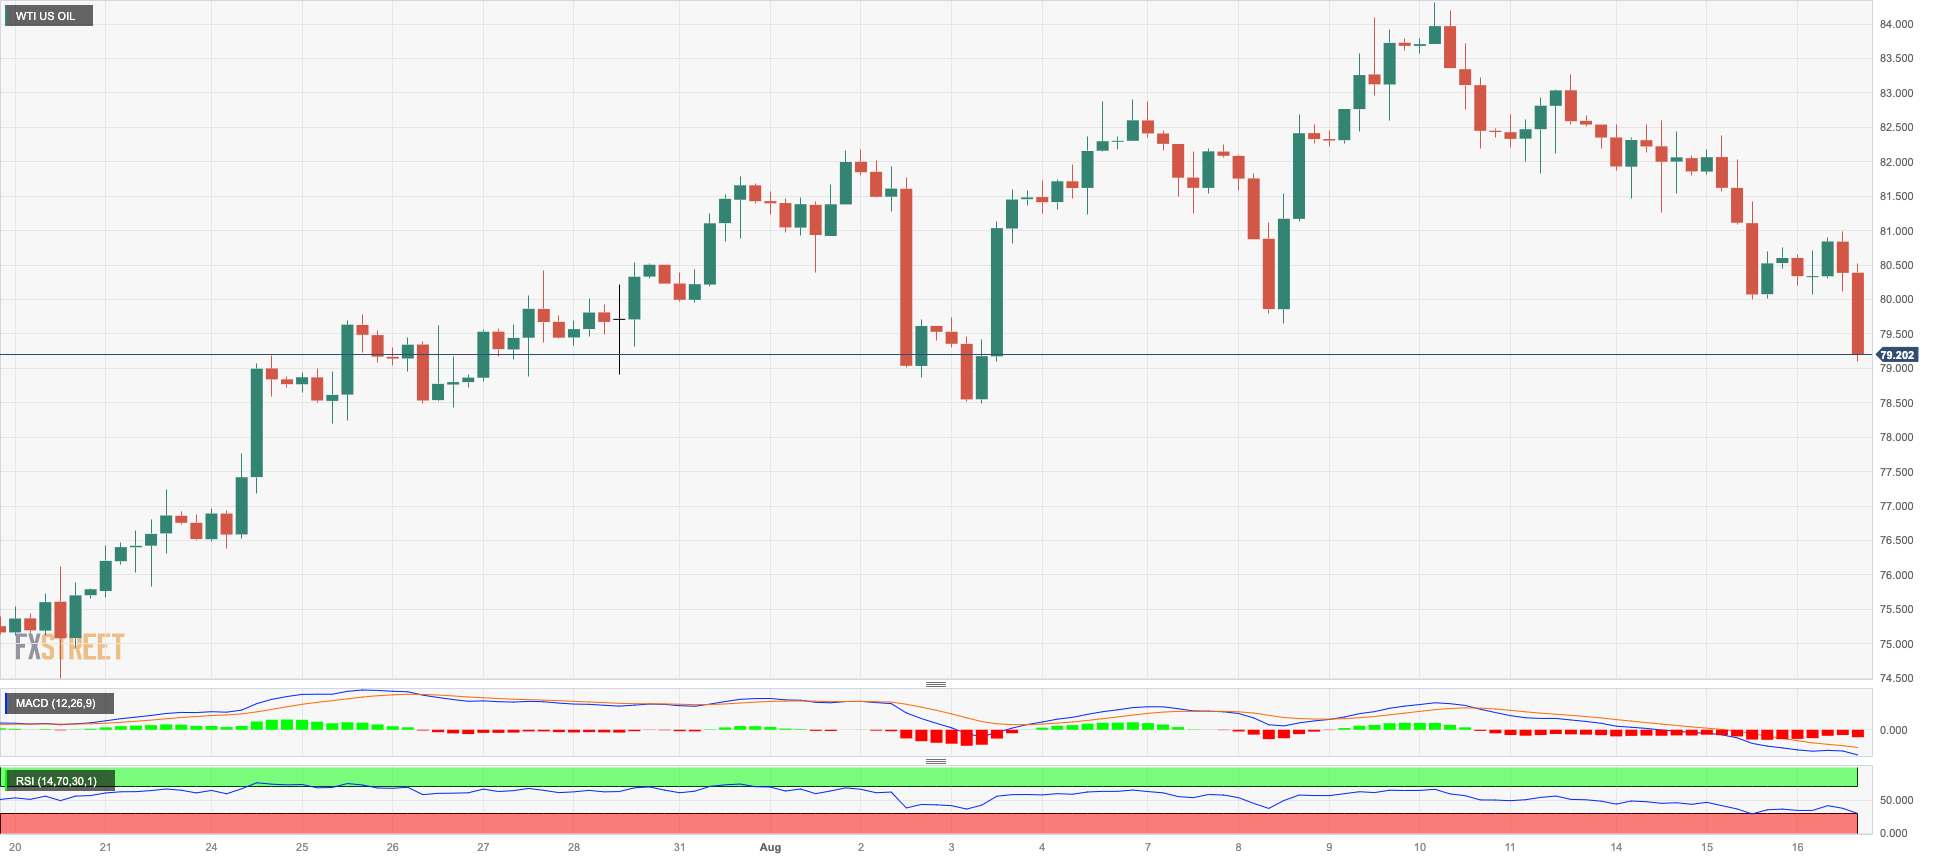
The prices of WTI crude oil continued to experience downward pressure for the third consecutive session and breached the key $80.00 mark per barrel on Wednesday.
Once again, worries revolving around the yet-to-materialize economic rebound in China influenced traders' outlook and contributed to the prevalence of selling pressure in the crude oil market, while the stronger dollar and a hawkish message from the FOMC Minutes also played in favour of daily losses in the commodity.
In a somewhat opposing trend emerged the persistent narrative of limited supply as well as the unexpected decrease in US crude oil inventories, as reported by the EIA.
On the latter, the agency reported that US crude oil inventories unexpectedly went down by 5.960M barrels in the week to August 11, while supplies at Cushing shrank by 0.837M barrels, Weekly Distillate Stocks increased by 0.296M barrels and gasoline stockpiles dropped by 0.261M barrels.
If selling pressure increases, WTI should find support around the August low of $78.74 (August 4), which is above the critical 200-day SMA of $76.33 and the weekly low of $73.89 (July 17). If the latter is cleared, the intermediate 100-day and 55-day SMAs should offer contention around the $75.00 region prior to the June low of $66.86 (June 12) and the 2023 low of $63.61 (May 4). A further drop might lead to the December 2021 low of $62.46 (December 2), which is close to the critical level of $60.00 per barrel. On the upside, the 2023 high of $84.85 (August 10) serves as immediate resistance ahead of the November 2022 top of $93.73 (November 7) and the weekly best of $97.65 (August 30, 2022).
Resistance levels: $84.85 $88.5 $90.08 (4H chart)
Support levels: $79.50 $78.66 $77.41 (4H chart)
GER40
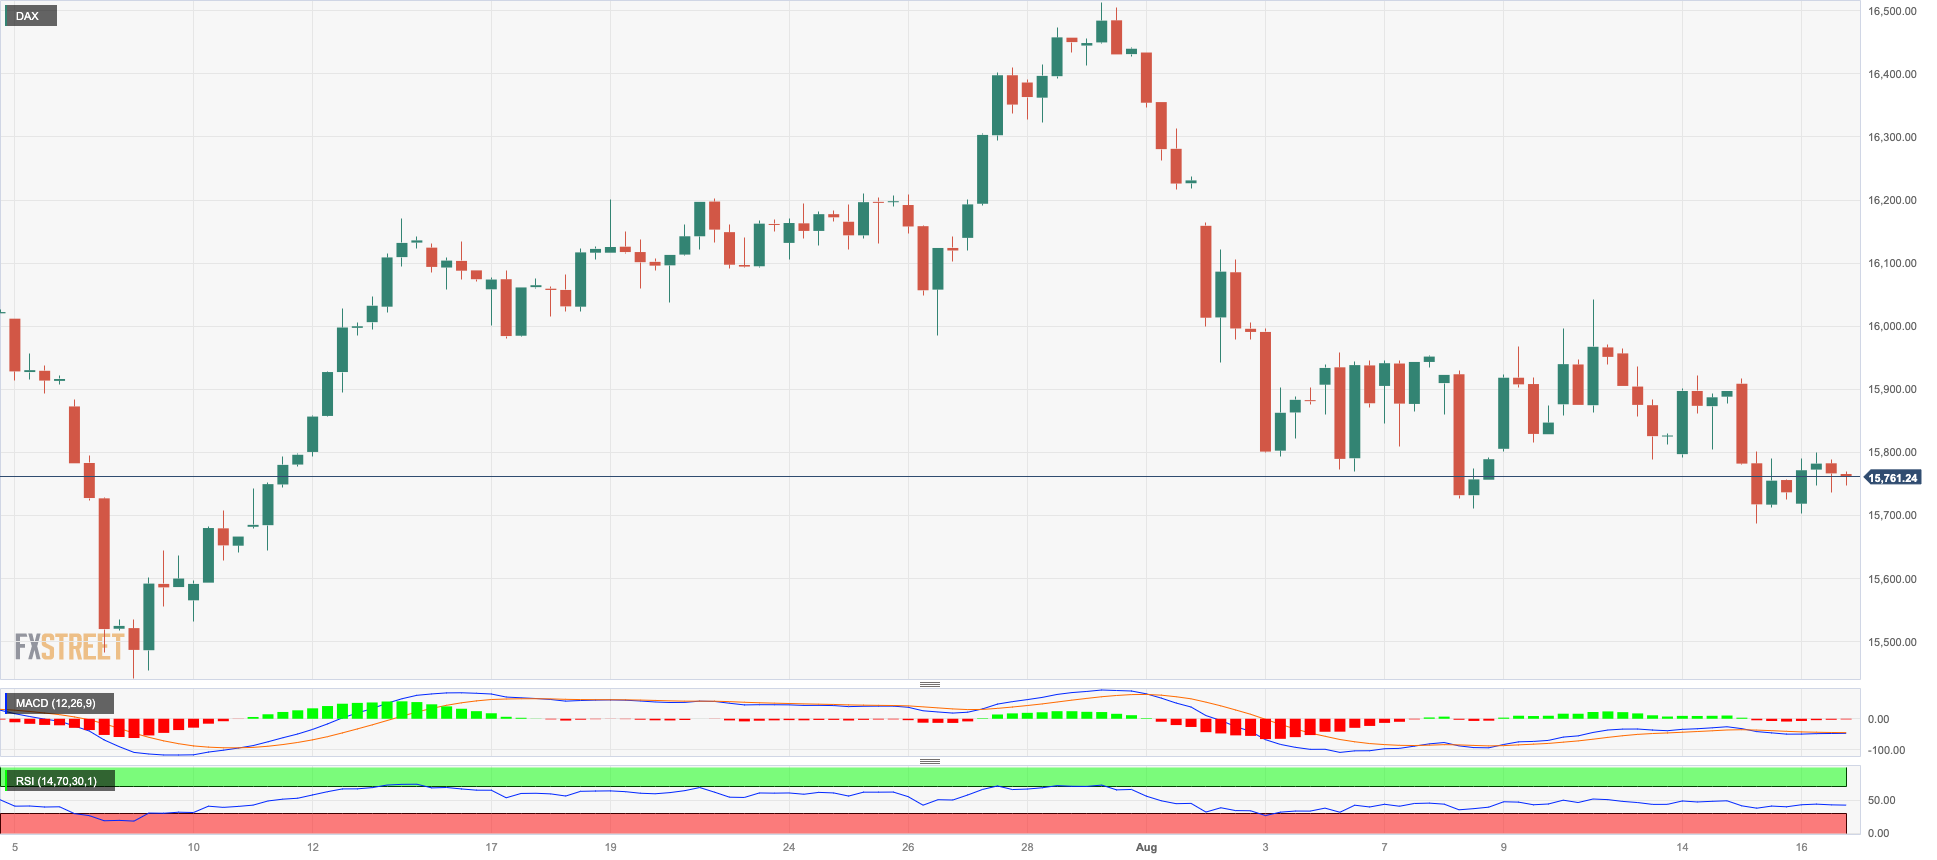
Germany's benchmark index, the DAX40, made a modest recovery on Wednesday, rebounding after the marked downturn it experienced on Tuesday.
This increase in the index occurred amidst a varied performance of stock markets across Europe in the middle of the week. Market participants were engaged in ongoing discussions regarding earnings reports, the enduring inflationary trends in the UK, and the less optimistic outlook for the Chinese economy.
The daily rise in the index coincided with a corrective decline in the yield of the German 10-year bund, which followed five consecutive days of gains.
Immediately to the downside for the DAX40 emerges the August low of 15703 (August 15) prior to the July low of 15456 (July 7), which comes before the crucial 200-day SMA of 15348. A drop below the latter could put a potential test of the March low of 14458 (March 20) back on the radar ahead of the December 2022 low of 13791 (December 20) and the 2022 low of 11862 (September 28). On the contrary, a break above the weekly high of 16060 (August 10) could motivate the index to challenge its all-time top of 16528 (July 31). The daily RSI ticked a tad higher past the 42 mark.
Best Performers: Adidas, Munich Re Group, Siemens Energy AG
Worst Performers: Rheinmetall AG, Bayer, Qiagen
Resistance levels: 16060 16146 16528 (4H chart)
Support levels: 15703 15456 14809 (4H chart)
NASDAQ
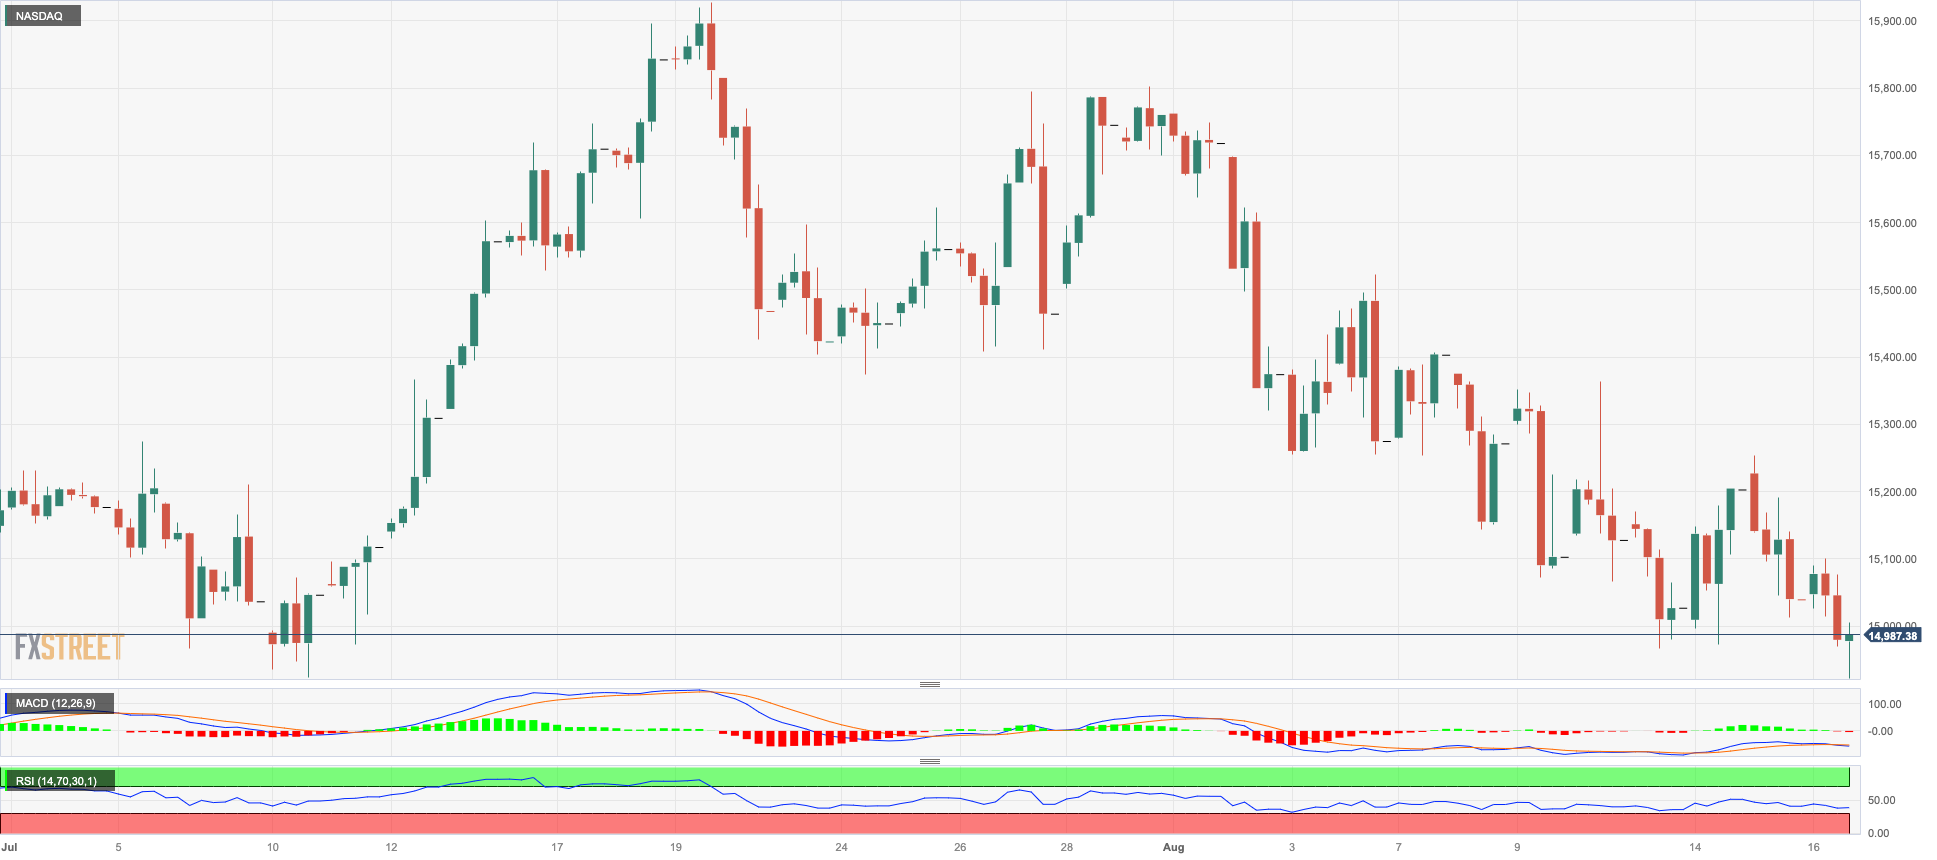
American technology stocks remained under pressure on Wednesday, causing the Nasdaq 100 index to decline for the second straight session.
The ongoing view that the Fed may maintain interest rates at their current high levels for an extended time, along with the late rebound of the dollar and further rises in US bond yields, suppressed price movements in the index.
Furthermore, discouraging news from electric vehicle maker Tesla also helped keep selling momentum in control during the middle of the week.
The August low of 14972 (August 14) is the next stop for the Nasdaq 100 on the downside. As it proceeds south, a collapse of this level might lead to a visit to the July low of 14924 (July 10) ahead of weekly lows of 14687 (June 26), 14283 (June 7), and 13520 (May 24). The 200-day SMA at 13008 aligns before the May low of 12938 (May 4) and the April low of 12724 (April 25). Conversely, the weekly high of 15803 (July 31) turns up before the 2023 top of 15932 (July 19) and the round level of 16000. The RSI deflated to the proximity of 41.
Top Gainers: Moderna, Datadog, Ross Stores
Top Losers: JD.com Inc Adr, AMD, Illumina
Resistance levels: 15416 15795 15932 (4H chart)
Support levels: 14972 14924 14687 (4H chart)
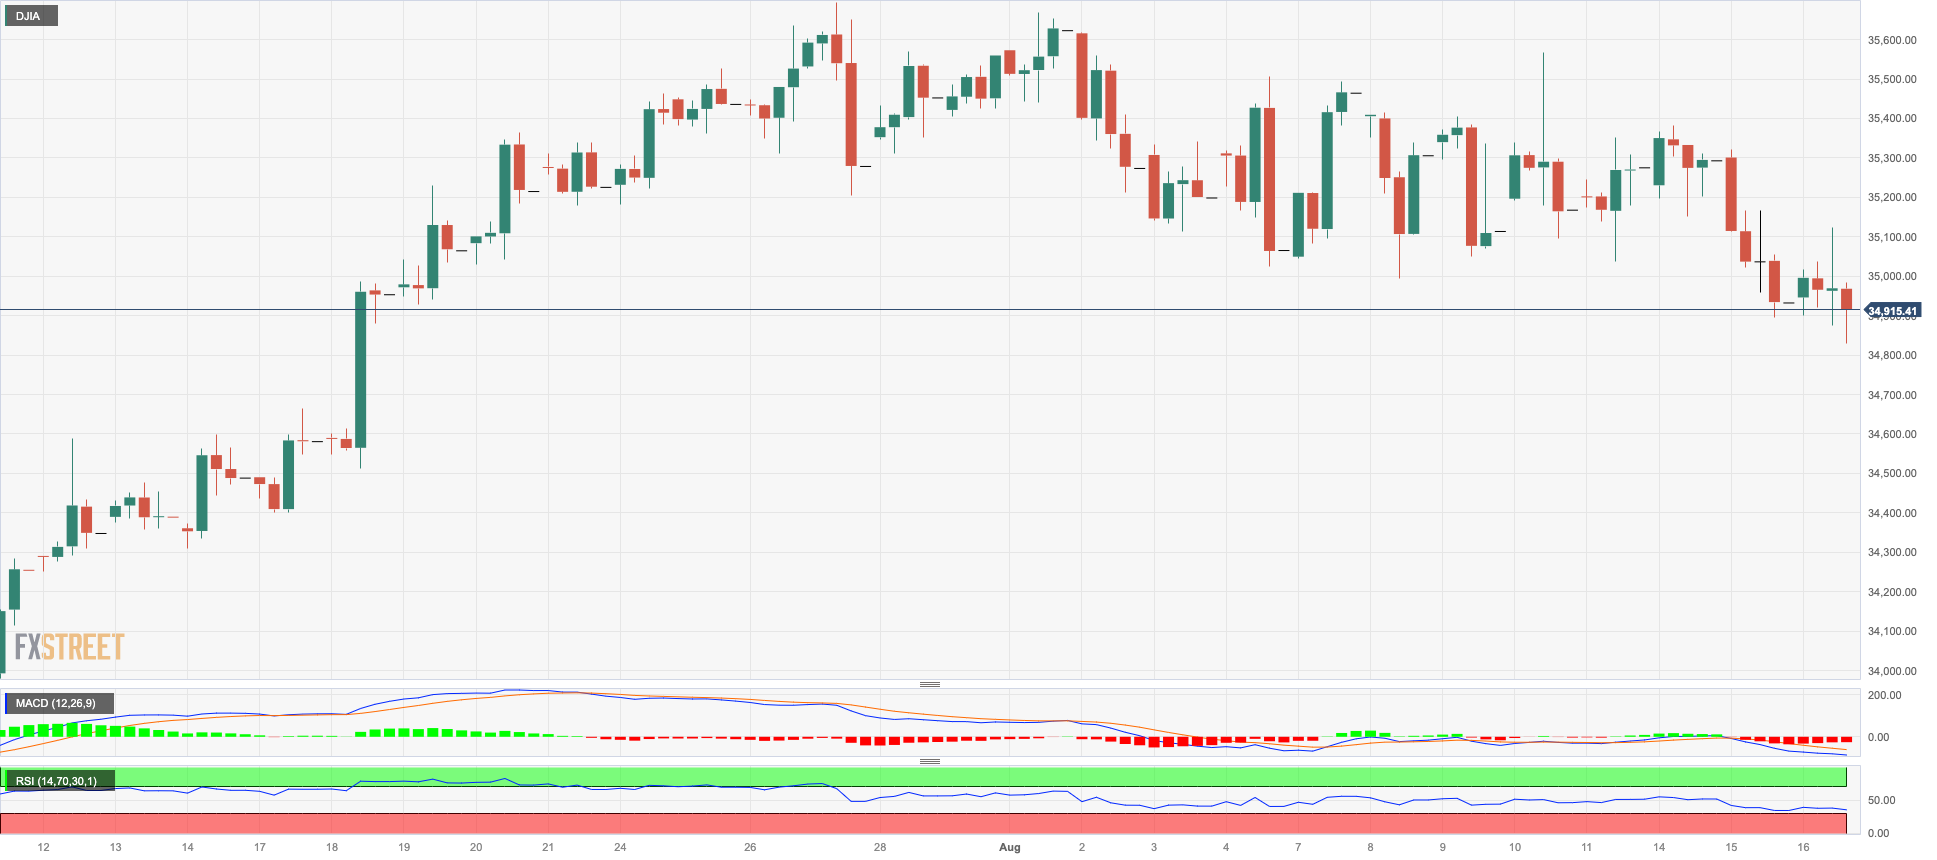
DOW JONES
The Dow Jones traded in a choppy fashion and around Tuesday’s closing levels just below the ley 35000 threshold on Wednesday.
Following Target's auspicious earnings announcement, confidence appears to have expanded to the rest of the sectors, with positive results from other retailers such as Walmart, Macy's, and Home Depot contributing to the broad-based optimistic mood.
The initial upbeat mood among investors, however, was put to the test soon after the FOMC Minutes highlighted that members remained concerned about the elevated inflation, leaving the door open to extra tightening if needed.
All in all, the Dow Jones gained 0.04% to 34959, the S&P500 dropped 0.06% to 4434, and the tech-benchmark Nasdaq Composite dropped 0.38% to 13578.
If the Dow Jones falls further, the transitory 55-day and 100-day SMAs at 34479 and 34001, respectively, may be revisited. A deeper correction exposes the July low of 33705 (July 10) prior to the critical 200-day SMA at 33671. The latter's decline might test the May low of 32586 (May 25) before the 2023 low of 31429 (March 15). Bulls, on the other hand, continue to eye the 2023 high of 35679 (August 1) before the February 2022 top of 35824 (February 9) and the all-time peak of 36952 (January 5, 2022). The daily RSI rose past the 50 barrier.
Top Performers: Travelers, Chevron, Nike
Worst Performers: Intel, Walgreen Boots, Goldman Sachs
Resistance levels: 35679 35824 36513 (4H chart)
Support levels: 34886 33976 33705 (4H chart)
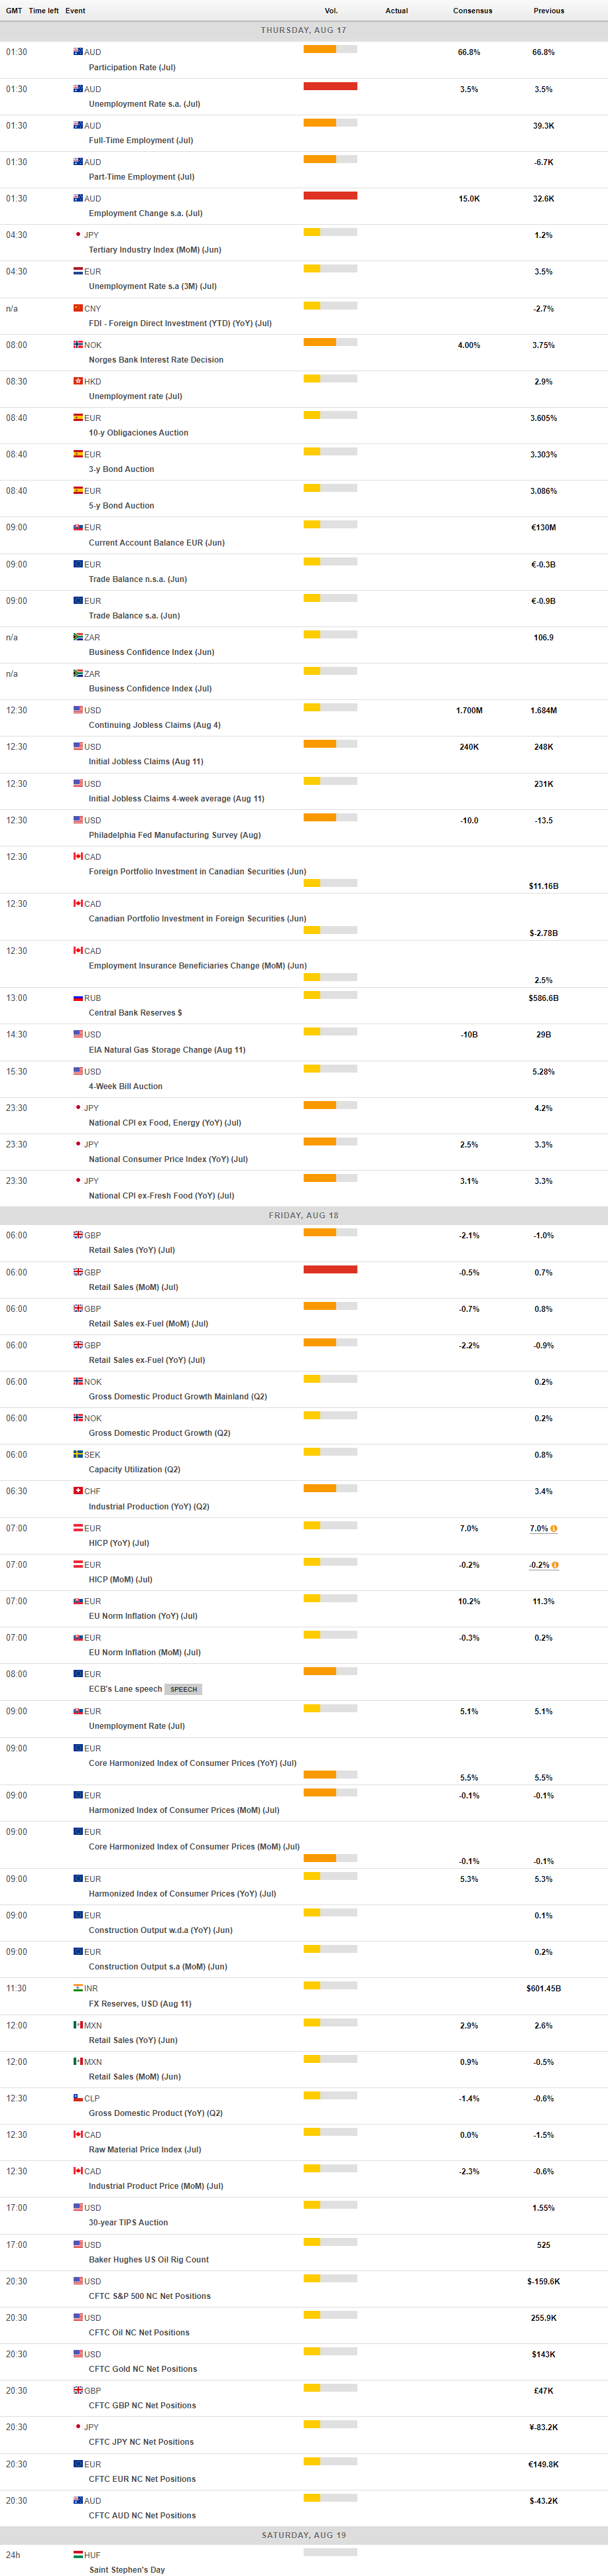
MACROECONOMIC EVENTS
All Information & Updates provided by:

All information relating to the financial markets available on this page has been prepared and issued by FXStreet (Forexstreet SL, Spain, Reg: B62498233) on the basis of publicly available information and all information believed to be reliable and does not conflict with Kuwaiti local laws, and all necessary care has been taken to before the company to ensure that the facts mentioned are correct from the source.
NCM Investment nor any of its directors or employees shall in any way be held responsible for the contents of this news, and the information contained on this page is intended only to provide clients with publicly available information and should not be construed as investment advice, report or analysis and/or constitute an offer or invitation to buy or sell financial instruments of any kind.
RISK WARNING: Forex and CFDs are highly risky leveraged products, as losses can exceed deposits. Please ensure you understand all the risks and take independent advice if necessary. NCM will segregate the clients based on the criteria of the regulator and its bylaws. NCM does not provide any advisory service; the material published does not constitute advice or a recommendation for a transaction in any financial instrument. NCM accepts no responsibility for any use of the content presented and any consequences of that use. Anyone acting on the information provided does so at their own risk.