
- Contact Us:
-

-

-

-


Daily Market Updates
18 Aug 2023
USDJPY
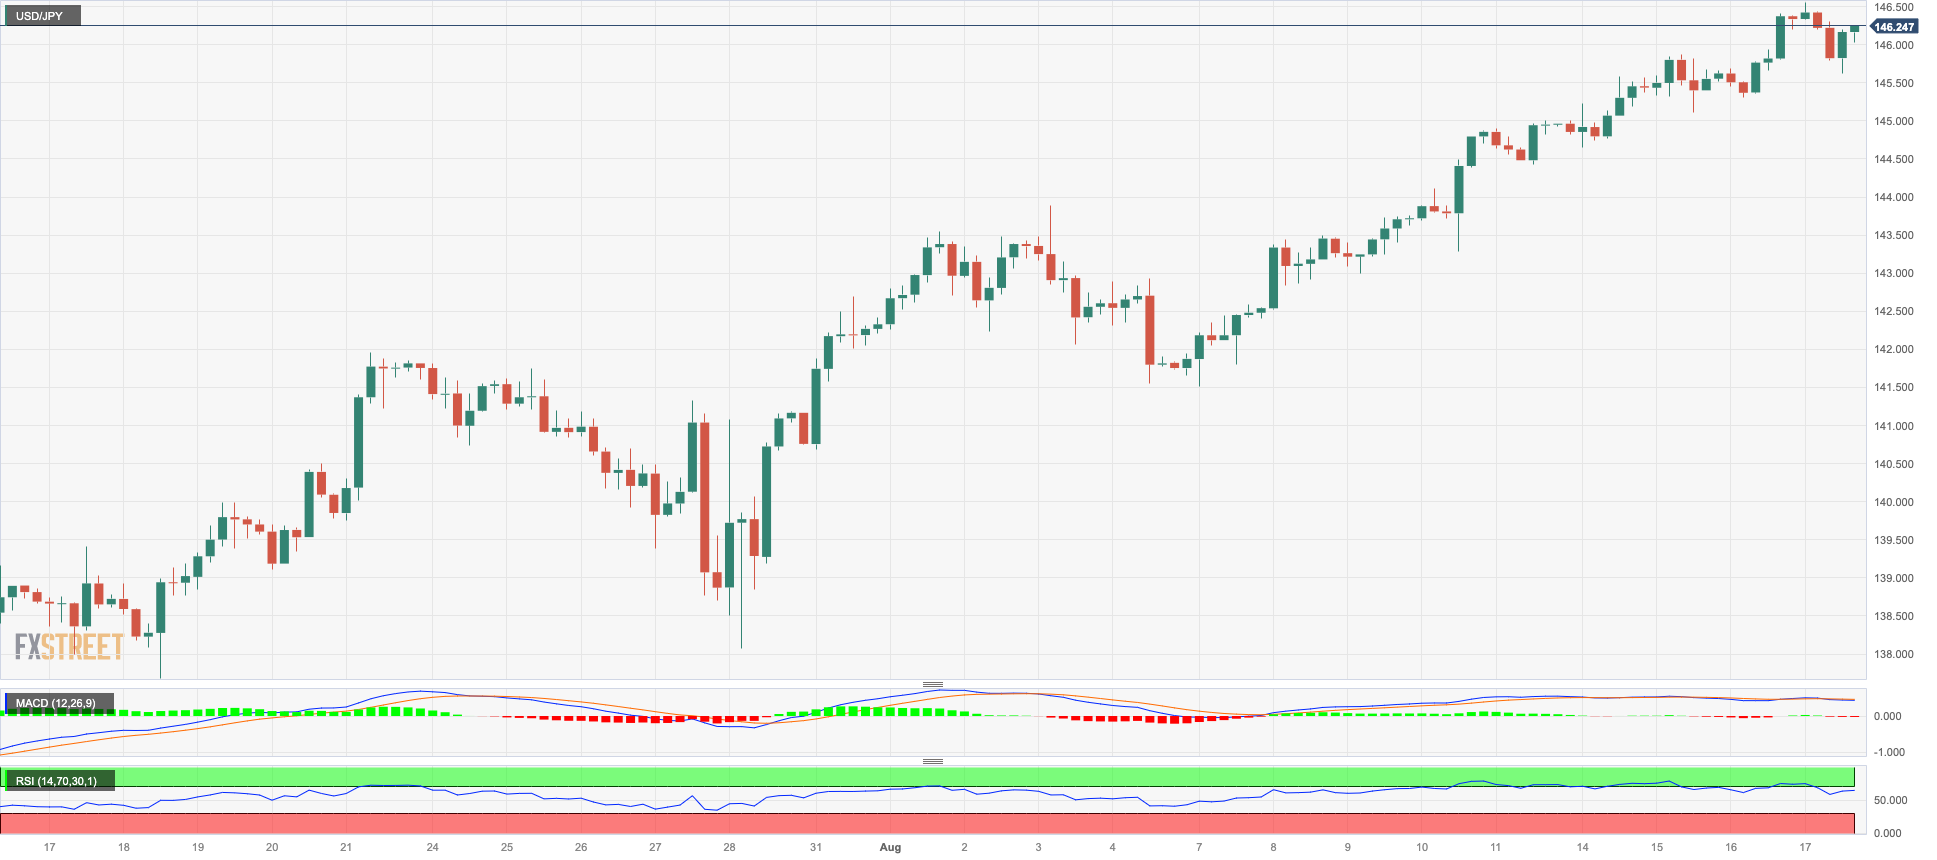
After eight consecutive days of gains, USD/JPY faced selling pressure and experienced its first session of losses. However, before this decline, the pair reached new yearly highs, hitting the range of 146.55/60 on Thursday.
The downward pressure on spot can be attributed to a correction in the greenback from earlier tops alongside increased gains in US yields across various maturities, especially in the 10-year-30-year segment of the curve. Additionally, the yields of 10-year JGB also rose, reaching new highs of around 0.66%.
In the Japanese data space, the trade deficit came in at ¥78.7B in July and Foreign Bond Investment shrank by ¥334.6B in the week to August 12. In addition, Machinery Orders contracted at an annualized 5.8% in June and the Tertiary Industry Index dropped 0.4% MoM in June.
The next hurdle for USD/JPY is the 2023 high at 146.56 (August 17), followed by the 2022 top at 151.94. (October 21). Instead, the provisional 55-day SMA at 141.95 is the immediate obstacle before the August low at 141.50 (August 7). If the latter mark is breached, there is a risk of a decline to the weekly low of 138.05 (July 28) prior to the July low of 137.23 (July 14) and the 200-day SMA at 136.48. A deeper fall could pave the way to the weekly low of 133.01 (April 26), seconded by minor support at 132.01 (April 13) and the April low of 130.62 (April 5). The RSI receded to the sub-70 area.
Resistance levels: 146.56 146.79 147.56 (4H chart)
Support levels: 145.10 144.35 143.25 (4H chart)
GBPUSD
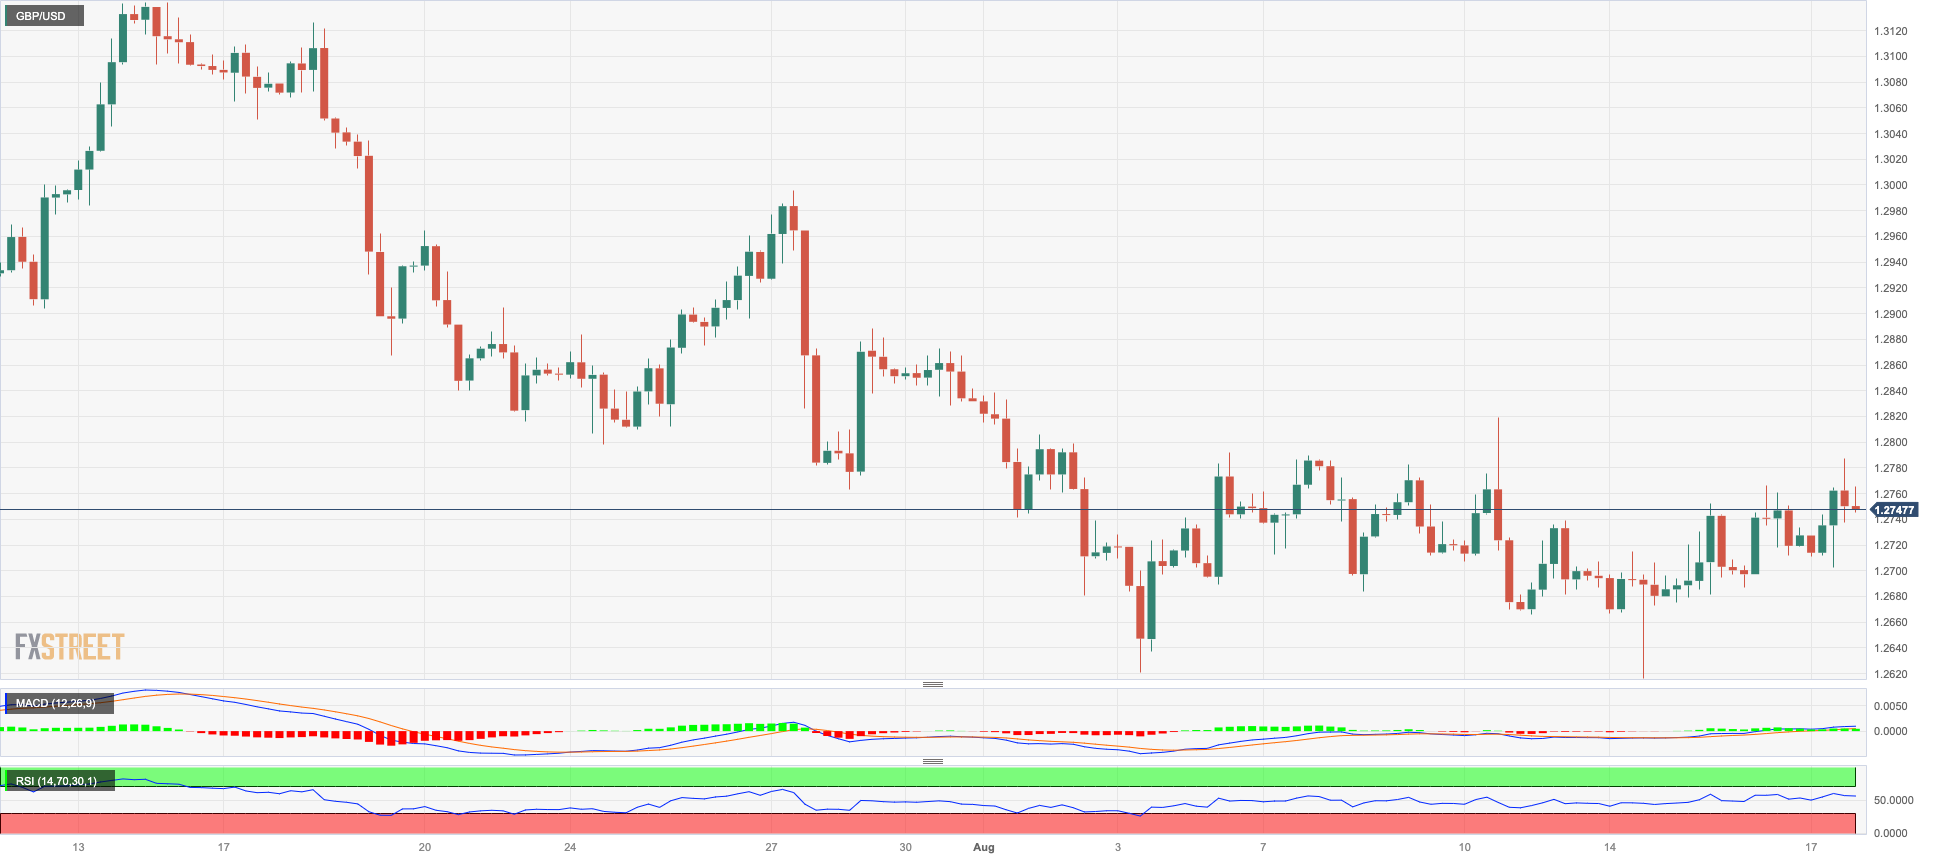
For the third consecutive session, GBP/USD made progress, surging to highs not seen in several days, hovering around 1.2790. This upward movement was driven by the resumption of some selling pressure targeting the greenback on Thursday.
In fact, the U-turn in the buck prompted the USD Index (DXY) to retreat from its previous highs near 103.60 and face a challenge around the 103.00 mark.
With no new data releases from the UK on Thursday, all the focus turned towards the upcoming release of crucial Retail Sales figures scheduled for Friday.
The weekly high of 1.2818 (August 10) is the first obstacle for GBP/USD, followed by another weekly top of 1.2995 (July 27). To the north, the 2023 peak of 1.3142 (July 14) is followed by weekly highs of 1.3298 (March 15 2022) and 1.3146 (April 14 2022). On the downside, the transitory 100-day SMA at 1.2622 looks to be supporting the August low of 1.2616 (August 14), which is ahead of the weekly low of 1.2590 (June 29). South from here emerges the 2021-2023 trendline at 1.2460 prior to the June low of 1.2368 (June 5), which remains underpinned by the 200-day SMA of 1.2372. The loss of this region should expose the May low of 1.2308 (May 25). The daily RSI improved past the 48 yardstick.
Resistance levels: 1.2787 1.2818 1.2888 (4H chart)
Support levels: 1.2616 1.2591 1.2368 (4H chart)
AUDUSD
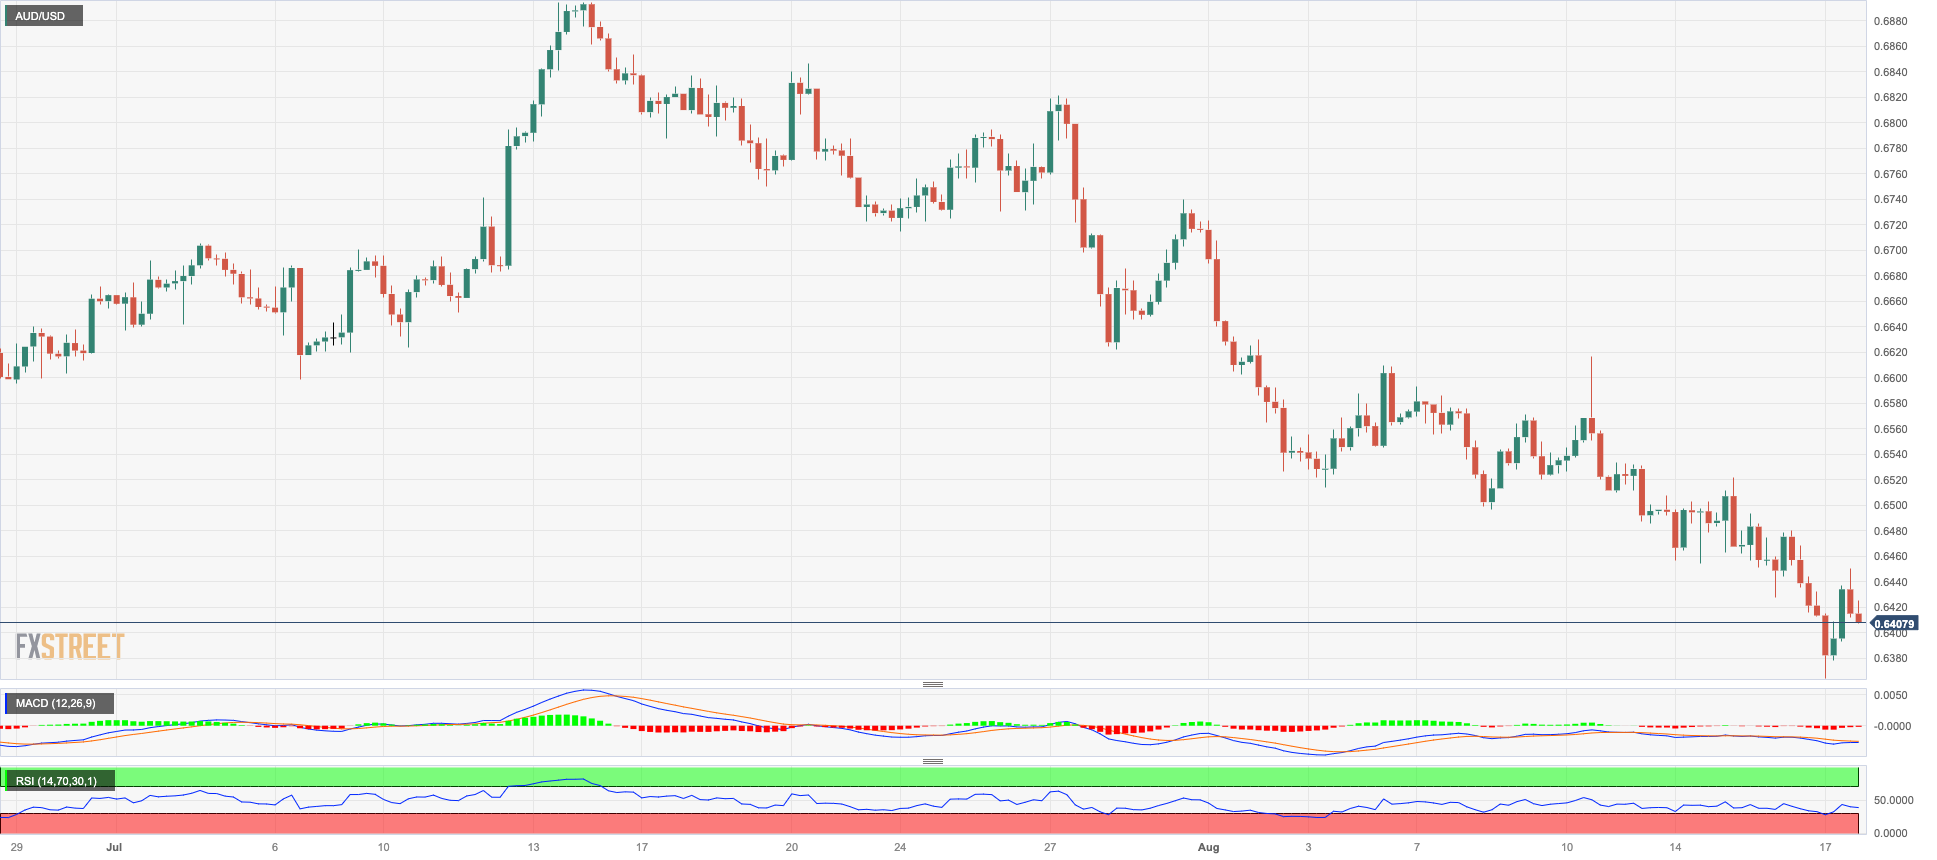
AUD/USD experienced its eighth consecutive session of decline, reaching a new low at levels last observed in November 2022 within the 0.6365/60 band on Thursday.
Persistent concerns revolving around China, the increased strength of the greenback, and discouraging results from the Australian jobs report all exerted downward pressure on the Aussie dollar on Thursday.
Looking at the economic schedule, the Employment Change figure showed a decrease of 14.6K individuals in July, while the unemployment rate inched up to 3.7% from its previous level of 3.5%.
Following the release of these data points, investors have become skeptical about the possibility of a rate hike in both the September and October meetings. However, the likelihood of a rate hike sees a modest increase to around 30% in November, and it reaches its peak at approximately 65% in the first quarter.
The 2023 low for AUD/USD is 0.6427 (August 16), followed by the November 2022 low of 0.6272 (3 November) and the 2022 low of 0.6179 (13 October). On the contrary, there is a little stumbling block at the weekly high of 0.6616 (August 10) ahead of the preliminary 55-day SMA of 0.6682. The breakout of this zone might put the 200-day SMA at 0.6735 to the test before the July high of 0.6894 (13 July), which is closely followed by the June high of 0.6899 (June 16). The breakdown of this sector might lead to a goal of 0.7000 before the weekly high of 0.7029 (February 14) and the 2023 high of 0.7157 (February 2). The RSI on the daily chart entered the oversold territory around 28.
Resistance levels: 0.6521 0.6616 0.6656 (4H chart)
Support levels: 0.6364 0.6272 0.6210 (4H chart)
GOLD
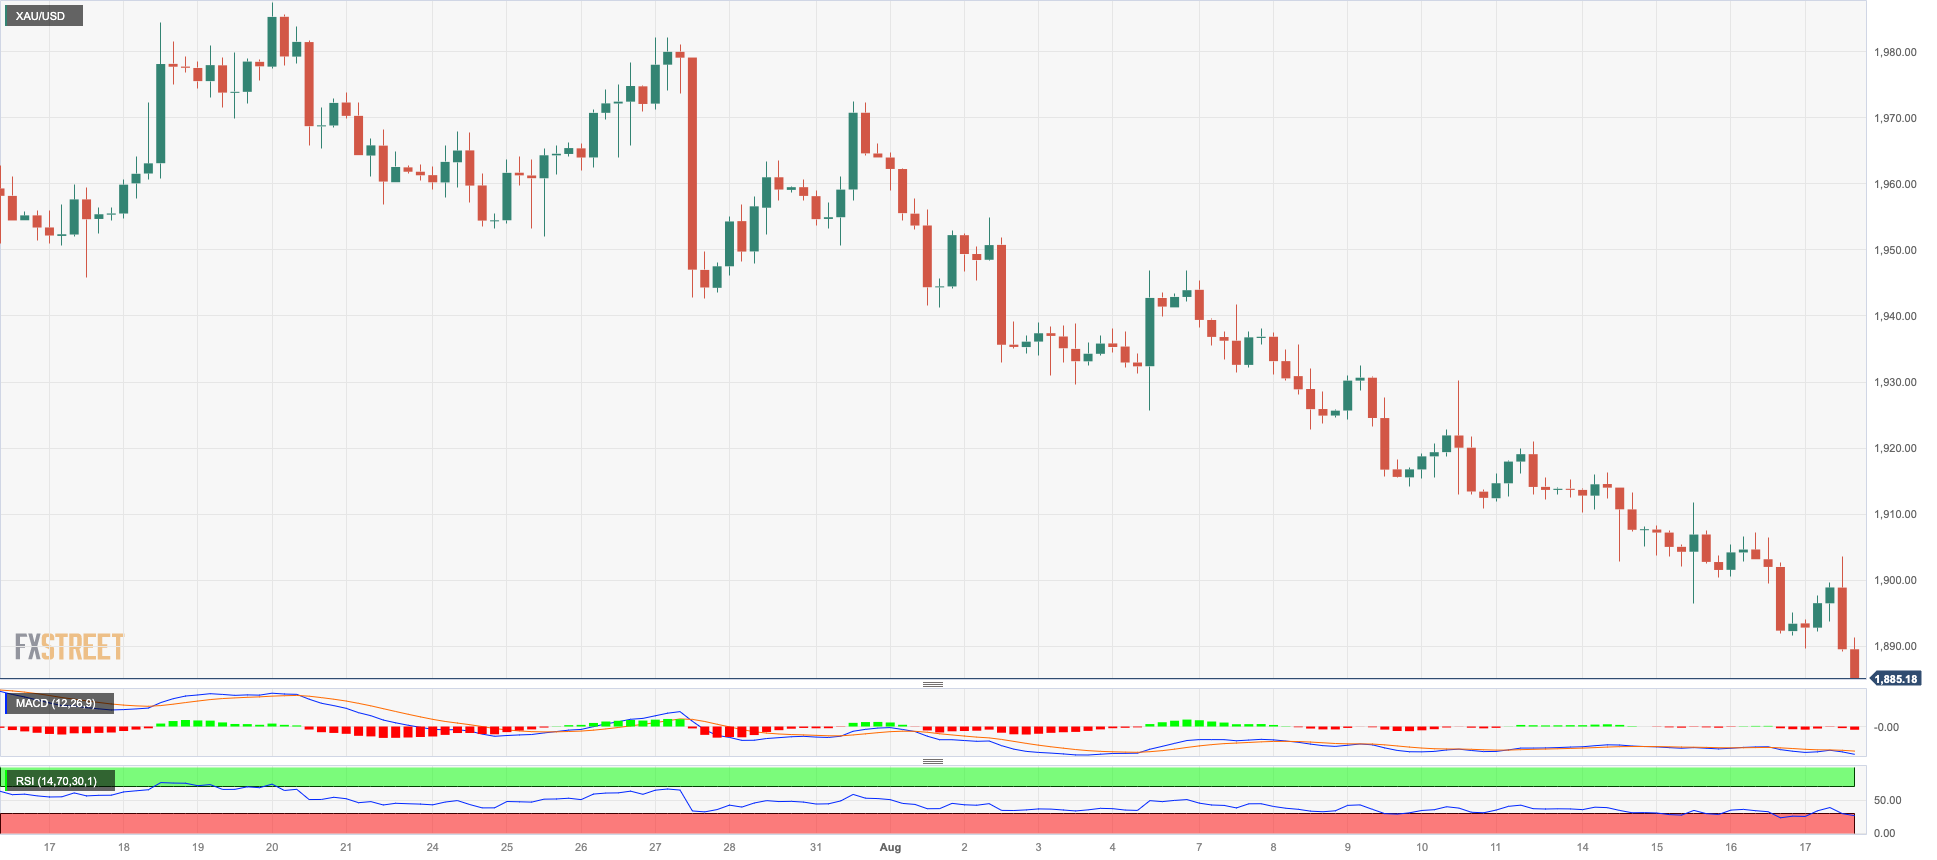
There was no relief from the selling pressure on Thursday for the yellow metal.
In fact, gold continued to decline and broke through the important 200-day SMA of $1905, as well as the key contention region of $1900 to hit lows around $1890, a level not seen since mid-March.
The late recovery in the value of the dollar, along with the ongoing increase in US bond yields and growing speculation that the Federal Reserve may maintain its restrictive stance for a longer period than initially anticipated, all contributed to the decline in the price of gold.
Gold prices recorded a new monthly low of $1889 (August 17). The loss of this level could open the door to the 2023 low of $1804 (February 28) prior to the critical contention zone of $1800. Having said that, the transitory 55-day and 100-day SMAs at $1938 and $1963, respectively, emerge as the immediate up-barriers ahead of the July high of $1987 (July 20). Once the latter is cleared, gold prices might advance to the crucial $2000 hurdle. Beyond that, the path is expected to go to the 2023 high of $2067 (May 4), followed by the 2022 top of $2070 (March 8) and the record peak of $2075 (August 7, 2020).
Resistance levels: $1911 $1930 $1946 (4H chart)
Support levels: $1889 $1885 $1809 (4H chart)
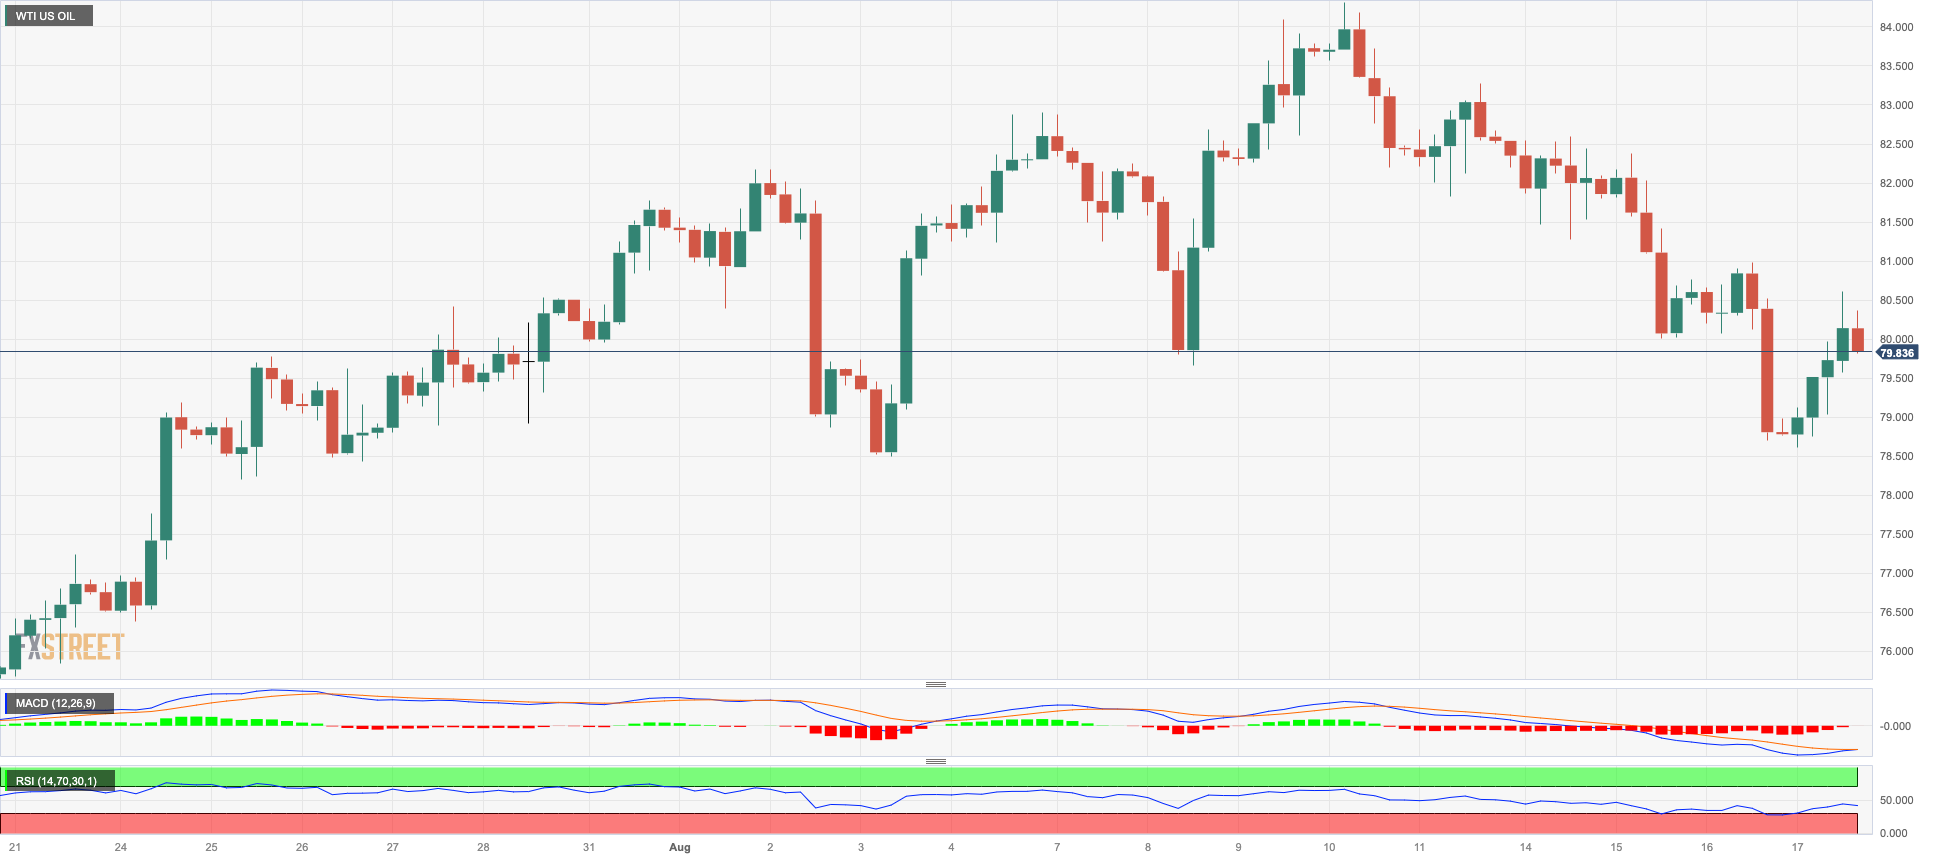
CRUDE WTI
Positive news from the PBoC allowed the resurgence of hopes of an economic recovery in China, which seem to have reignited optimism among traders on Thursday. On this, prices of the American benchmark for the sweet light crude oil surpassed the key $80 per barrel level, extending gains after three straight days of declines earlier in the week.
The bullish sentiment around the commodity was further boosted by data from the EIA showing a drawdown in US crude inventories last week.
Indeed, the combination of renewed hopes of China's economic rebound, falling US stockpiles and persistent supply tightness gave fresh momentum to the oil price rally on Thursday.
If selling pressure builds up, WTI should find support at the August low of $78.74 (August 4) ahead of the crucial 200-day SMA of $76.27. South from here comes the $75.00 region, where the provisional 55-day and 100-day SMAs converge. The breach of this zone exposes the weekly low of $73.89 (July 17) prior to the June low of $66.86 (June 12) and the 2023 low of $63.61. (May 4). A further reduction might lead to the December 2021 low of $62.46 (December 2) just before the key level of $60.00 per barrel. On the upside, the 2023 high of $84.85 (August 10 ) acts as immediate resistance, followed by the November 2022 top of $93.73 (November 7) and the weekly peak of $97.65 (August 30).
Resistance levels: $81.30 $83.77 $84.85 (4H chart)
Support levels: $79.50 $78.66 $77.41 (4H chart)
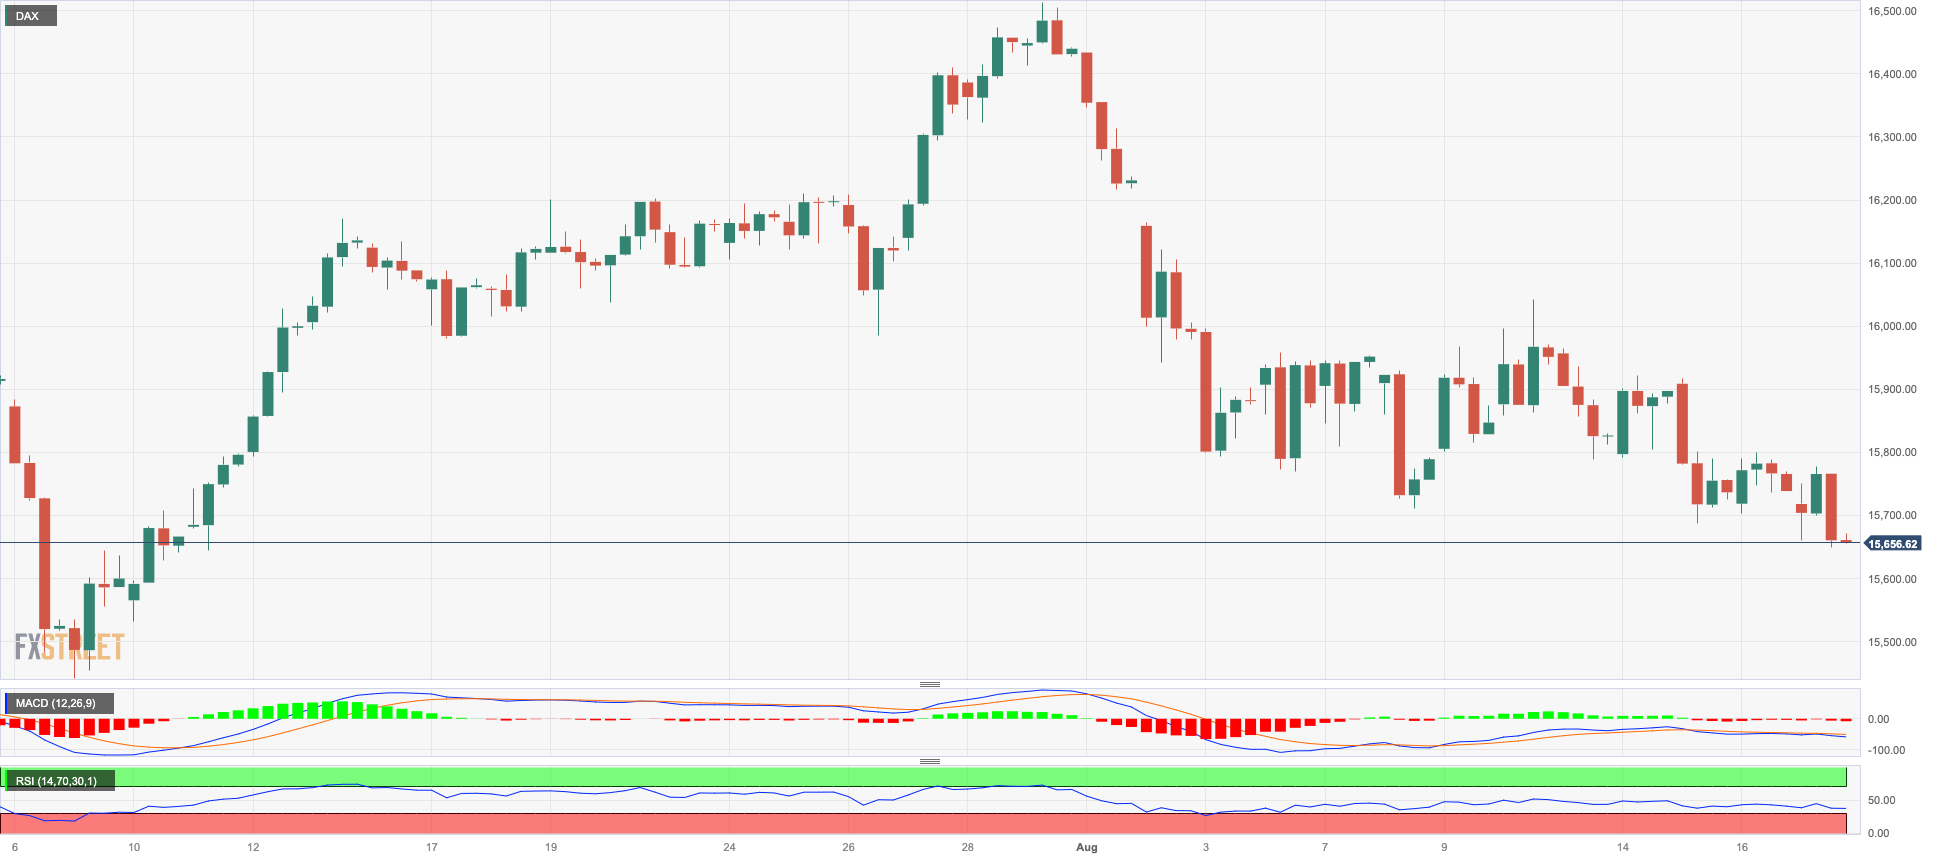
GER40
The German blue-chip reference DAX40 resumed the downtrend and probed fresh five-week lows near 15600 on Thursday.
Concerns surrounding a probable tighter-for-longer stance by the Fed were reignited following the hawkish tilt from the FOMC Minutes on Wednesday, while auspicious results from the US docket on Thursday also added to that view and kept traders’ sentiment on the sour side.
Further pessimism emerged from the omnipresent worries surrounding China, although the PboC's announcements early on Thursday that it plans to keep ample liquidity seem to have soothed those fears somewhat.
The decline in the index on Thursday coincided with a further rise in the yield on the 10-year German bund, which surpassed 2.70% and aligned with climbing US Treasury yields.
For the DAX40, the August low of 15664 (August 7) comes before the July bottom of 15456 (July 7). The breach of this level could put the critical 200-day SMA of 15359 to the test in the near term ahead of the March low of 14458 (March 20) and the December 2022 low of 13791 (December 20), all preceding the 2022 low of 11862 (September 28). Just the opposite, a break above the weekly high of 16060 (August 10) might spur the index to challenge its all-time top of 16528 (July 31). The daily RSI slipped back below the 40 level.
Best Performers: Adidas, Munich Re Group, E.ON SE, Covestro
Worst Performers: SAP, Infineon, Deutsche Boerse
Resistance levels: 16060 16146 16528 (4H chart)
Support levels: 15664 15456 14809 (4H chart)
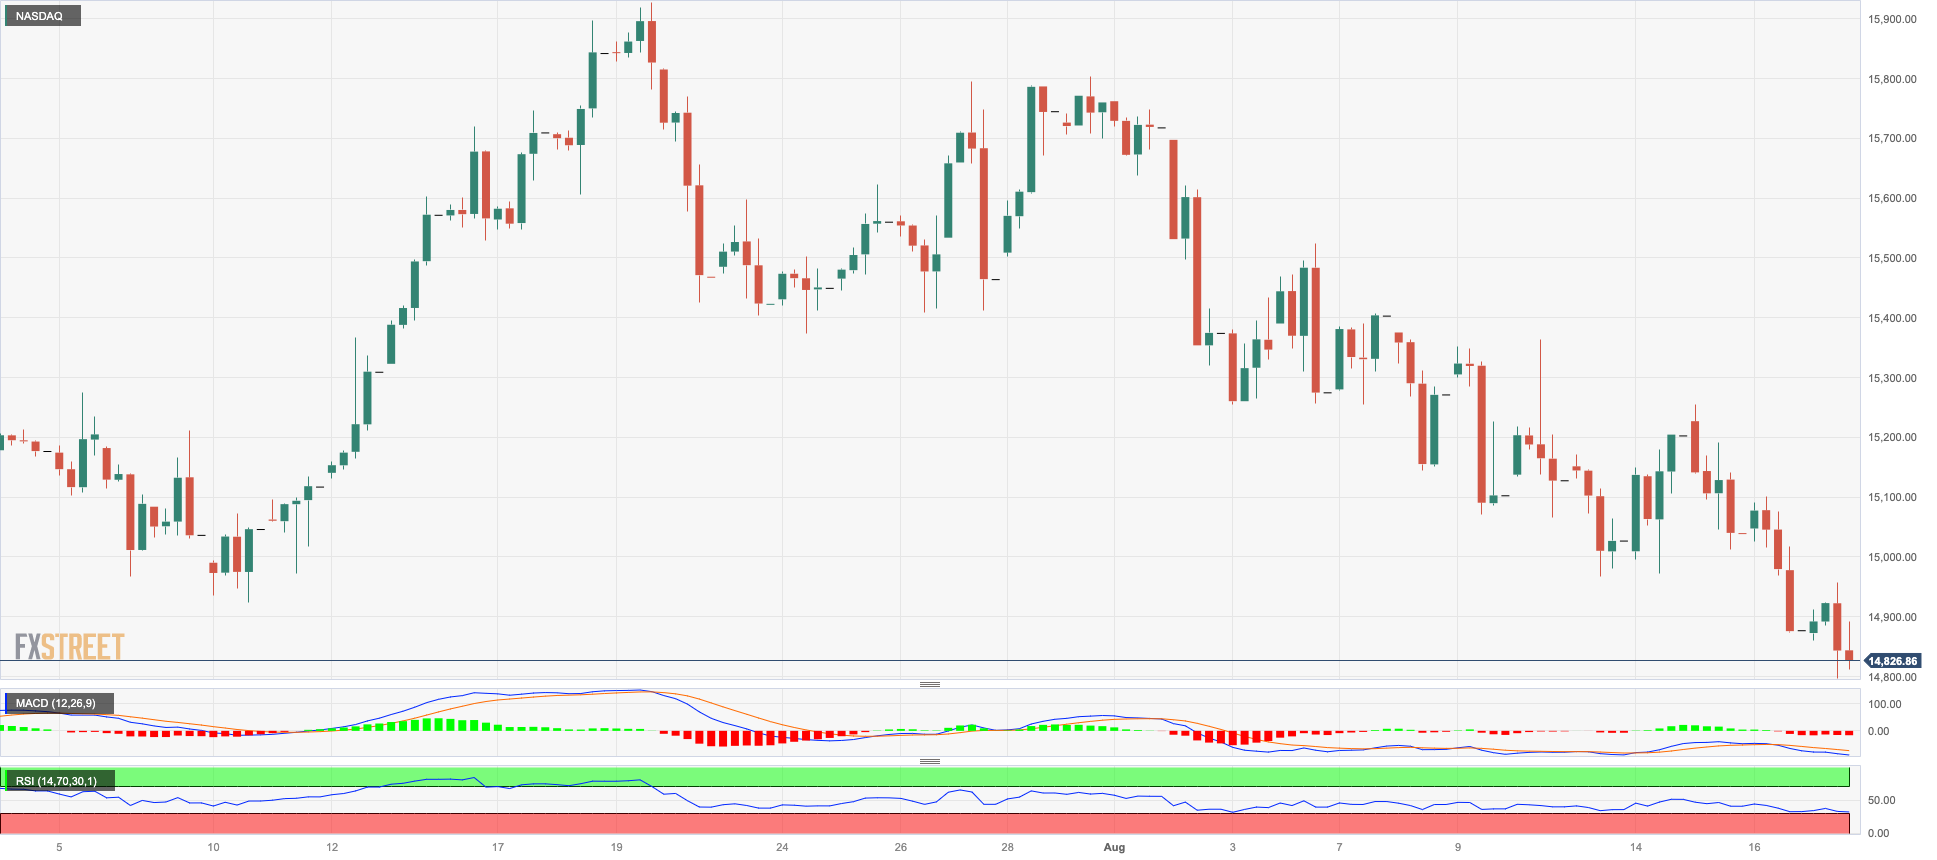
NASDAQ
In line with the rest of its American peers, the tech benchmark Nasdaq 100 traded within a vacillating range and closed Thursday’s session in the sub-15000 region.
In fact, market participants kept the prudence well in place in the tech sector against the backdrop of increasing speculation that the Fed might remain in restrictive territory longer than was initially thought, while new multi-month highs in 10-year bond yields also weighed on the sentiment.
The Nasdaq 100's next downward target is the August low of 14801 (August 7). As it moves south, a breakdown of this level might lead to a visit to the weekly lows of 14687 (June 26) and 14283 (June 7). Further down aligns the weekly low of 13520 (May 24) seconded by the 200-day SMA at 13024 and the April low of 12724 (April 25). In contrast, the weekly high of 15803 (July 31) seems ahead of the 2023 peak of 15932 (July 19) and the round level of 16000. The RSI settled around 38.
Top Gainers: Moderna, Cisco, Alphabet C
Top Losers: Walgreen Boots, Crowdstrike Holdings, Zscaler
Resistance levels: 15409 15803 15932 (4H chart)
Support levels: 14801 14687 14253 (4H chart)
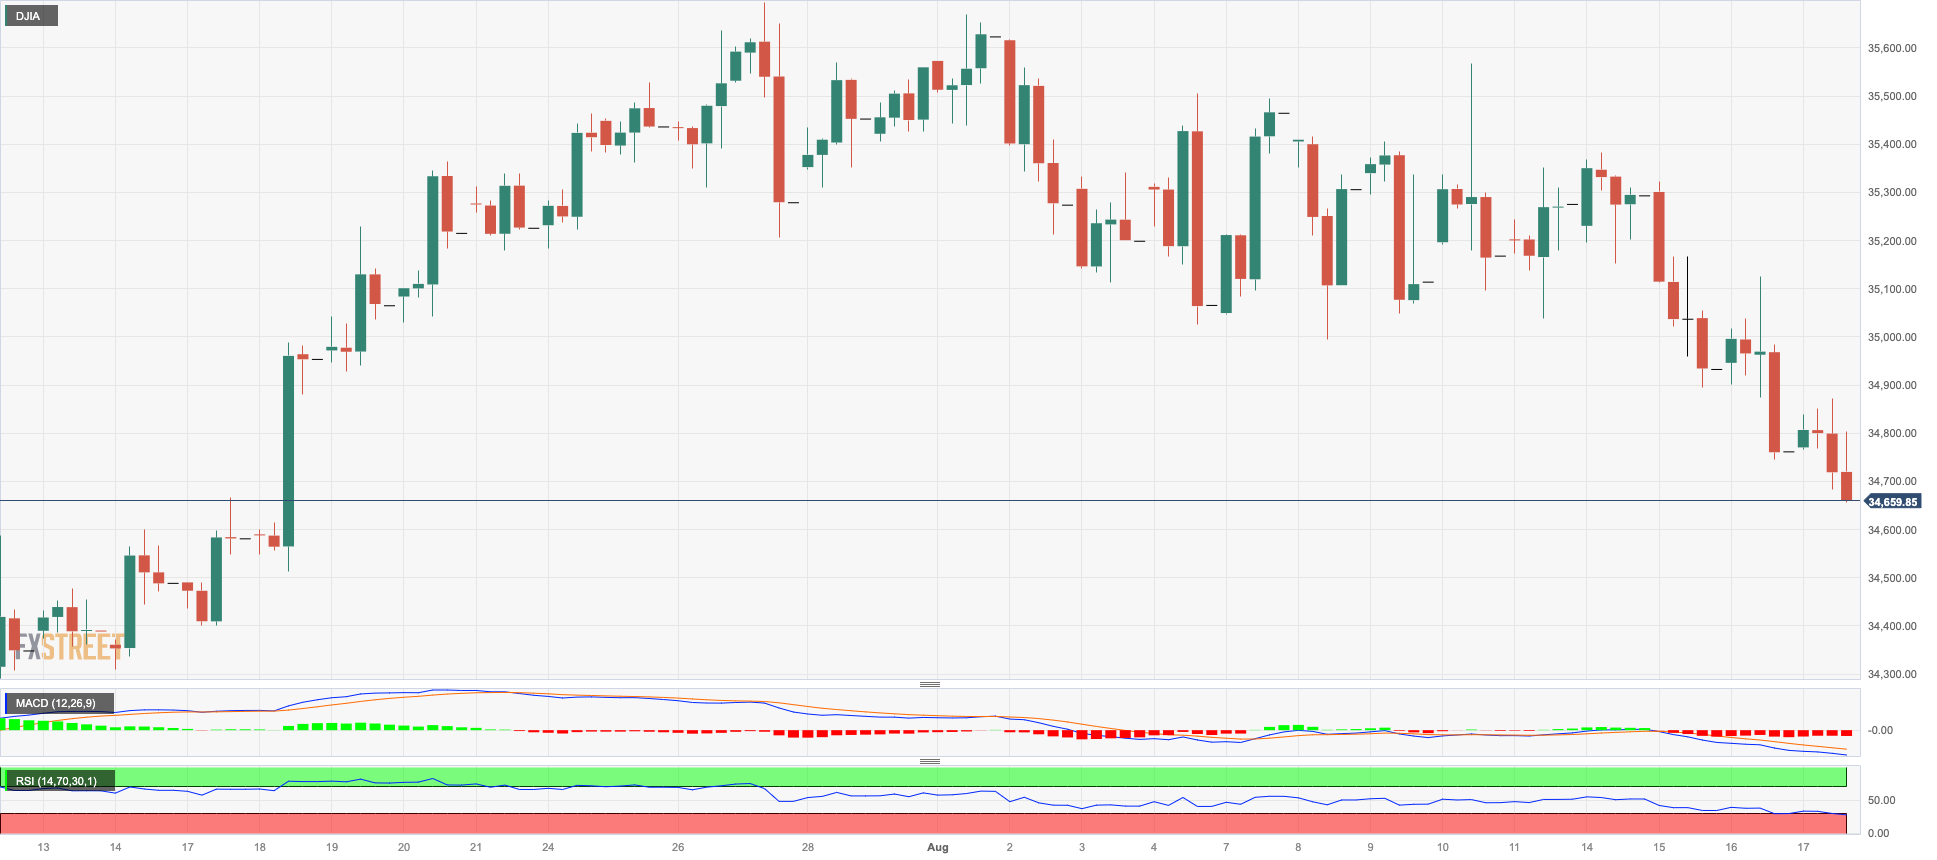
DOW JONES
US equities gauged by the Dow Jones traded in a choppy fashion on Thursday, ending the session around the previous day’s close near the 34800 zone.
Indeed, investors kept the trade cautious in response to better-than-expected results from the US calendar, which reinforced once again the resilience of the economy as well as the tight condition of the labour market, all of which did nothing but prop up prospects for a Fed’s tighter-for-longer stance.
Overall, the Dow Jones rose 0.02% to 34769, the S&P500 gained 0.16% to 4411, and the tech-focused Nasdaq Composite dropped 0.01% to 13478.
If the Dow Jones continues to decline, the 55-day and 100-day SMAs at 34505 and 34023, respectively, may be revisited. A deeper correction reveals the July low of 33705 (July 10) before the 200-day SMA at 33679. The latter's drop might touch the May low of 32586 (May 25) before reaching the 2023 low of 31429. (March 15). Bulls, on the other hand, continue to target the 2023 high of 35679 (August 1) before the February 2022 top of 35824 (February 9) and the all-time peak of 36952 (January 5, 2022). The daily RSI remained stable around 45.
Top Performers: Cisco, Chevron, Dow
Worst Performers: Walgreen Boots, Intel, Walmart
Resistance levels: 35679 35824 36513 (4H chart)
Support levels: 34688 34002 33705 (4H chart)
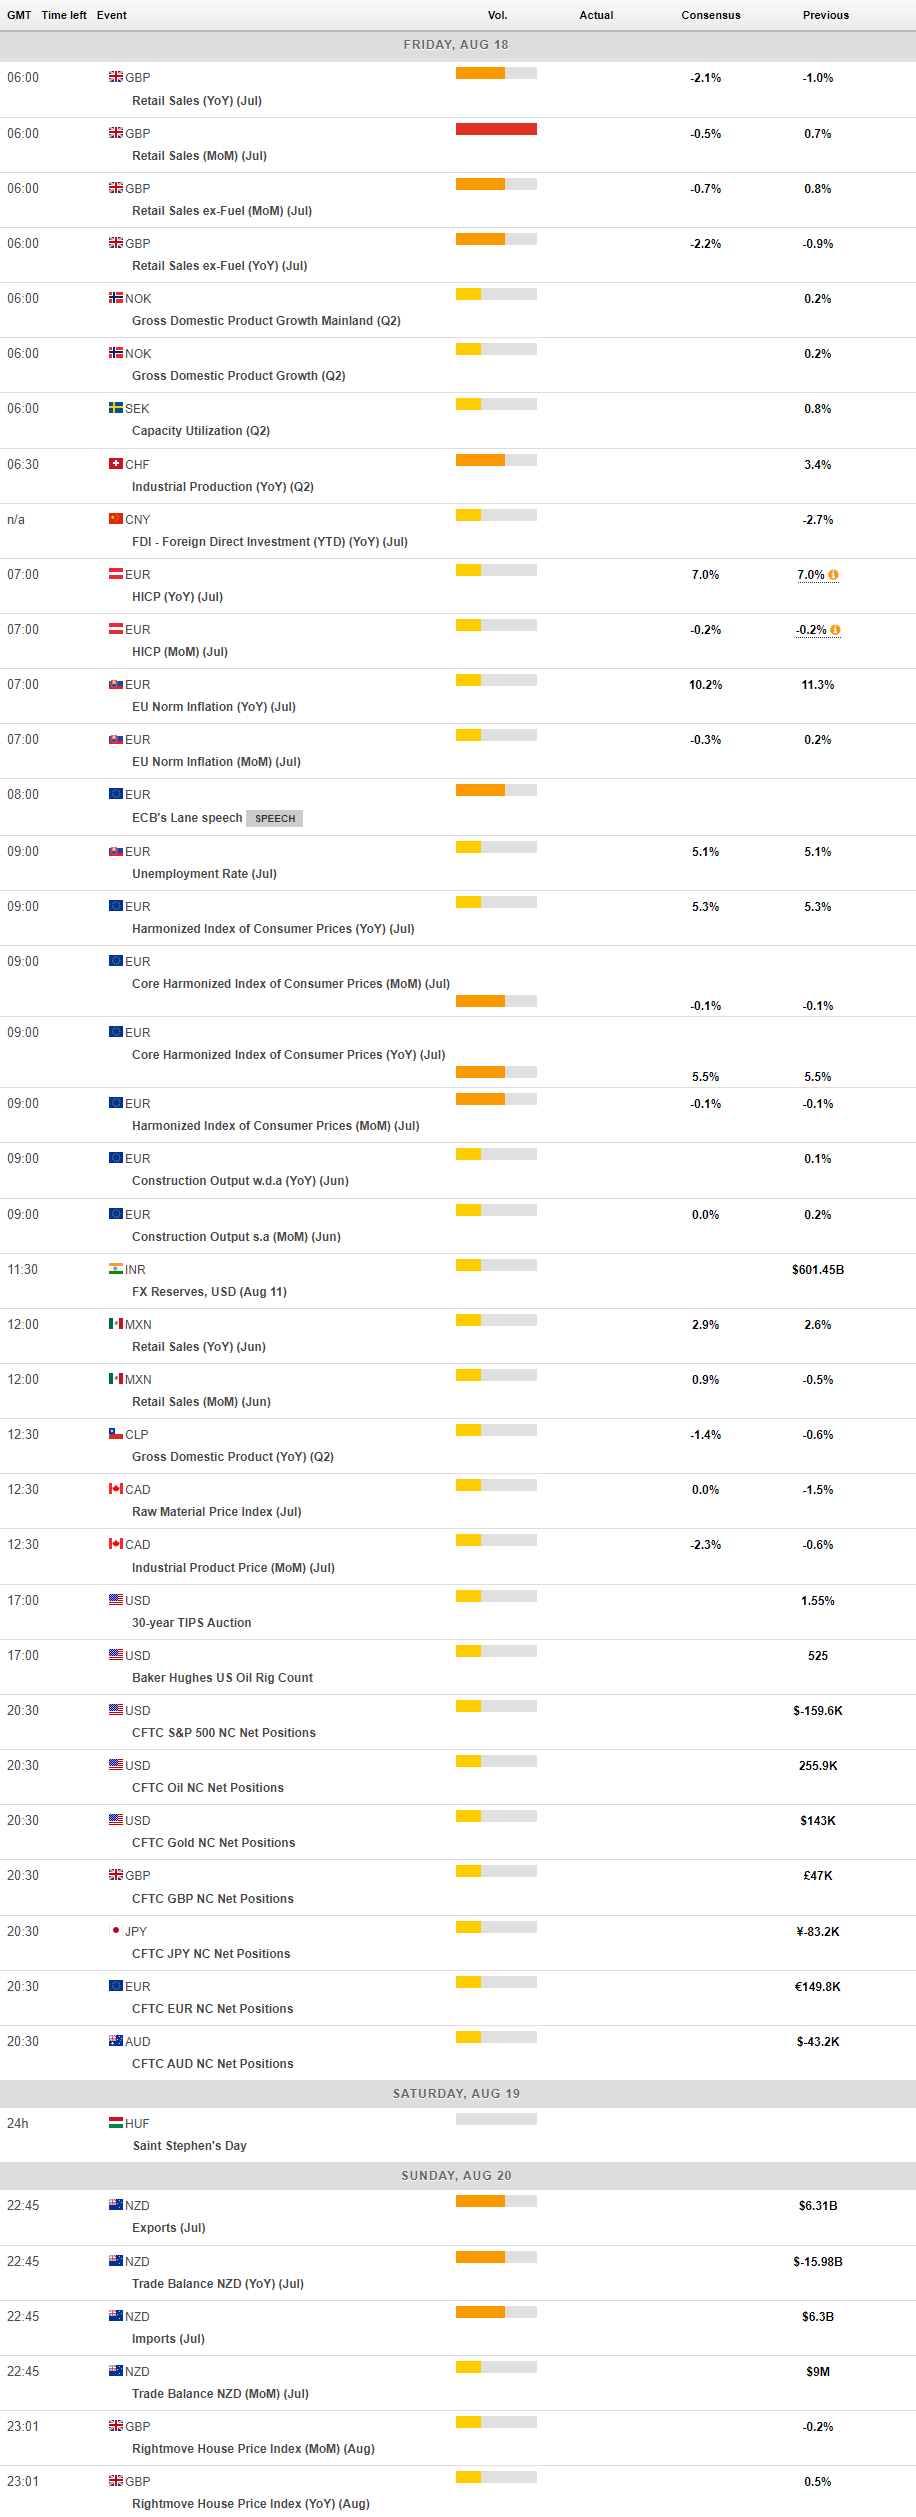
MACROECONOMIC EVENTS
All Information & Updates provided by:

All information relating to the financial markets available on this page has been prepared and issued by FXStreet (Forexstreet SL, Spain, Reg: B62498233) on the basis of publicly available information and all information believed to be reliable and does not conflict with Kuwaiti local laws, and all necessary care has been taken to before the company to ensure that the facts mentioned are correct from the source.
NCM Investment nor any of its directors or employees shall in any way be held responsible for the contents of this news, and the information contained on this page is intended only to provide clients with publicly available information and should not be construed as investment advice, report or analysis and/or constitute an offer or invitation to buy or sell financial instruments of any kind.
RISK WARNING: Forex and CFDs are highly risky leveraged products, as losses can exceed deposits. Please ensure you understand all the risks and take independent advice if necessary. NCM will segregate the clients based on the criteria of the regulator and its bylaws. NCM does not provide any advisory service; the material published does not constitute advice or a recommendation for a transaction in any financial instrument. NCM accepts no responsibility for any use of the content presented and any consequences of that use. Anyone acting on the information provided does so at their own risk.