
- Contact Us:
-

-

-

-


Daily Market Updates
21 Aug 2023
USDJPY
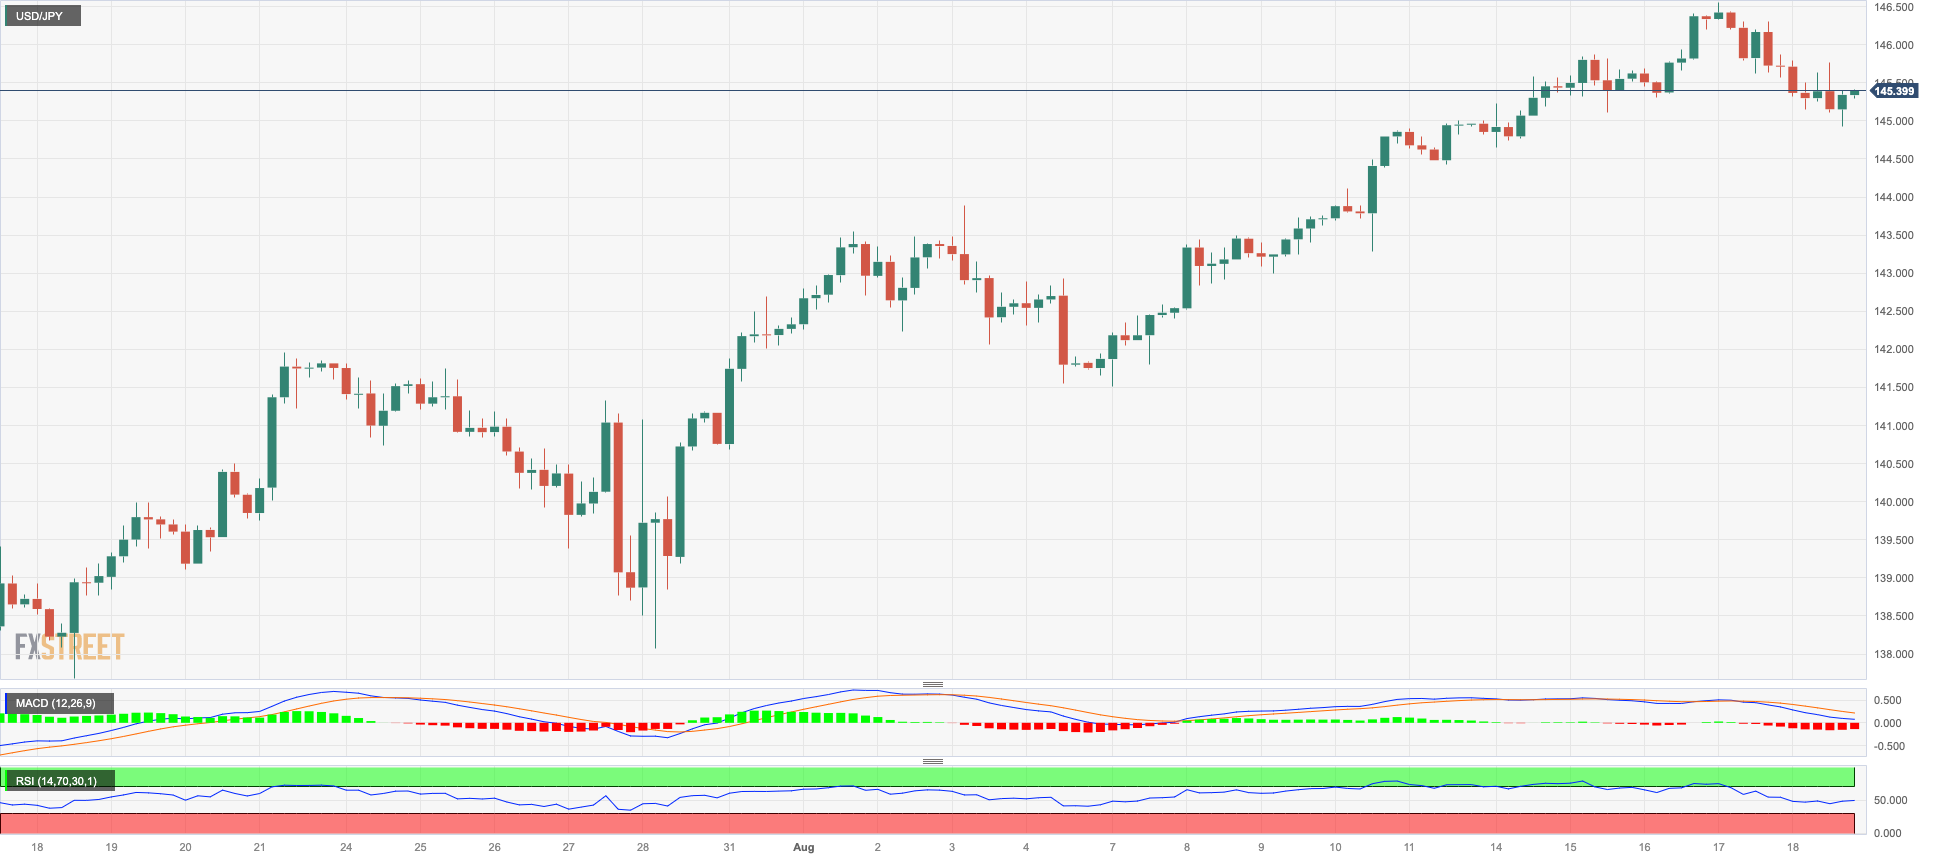
After a remarkable streak of eight consecutive days of gains, USD/JPY came under renewed downside pressure and printed two consecutive daily pullbacks in the second half of the week, ending Friday’s session in the 145.00 neighbourhood.
The downward pressure on spot can be attributed to a tepid knee-jerk in the greenback along with a corrective retracement in US yields across different maturity periods. Still in the bonds market, the yields on 10-year JGB Bonds also dropped for the first time since Monday.
In terms of Japanese economic data, the Inflation Rate exceeded expectations, rising by 3.3% in July compared to the same month in 2022. Meanwhile, the Core Inflation Rate increased by 3.1%, and the Inflation Rate Excluding Food and Energy rose by 4.3% on a yearly basis.
Looking ahead, the next obstacle for the USD/JPY pair is the 2023 high at 146.56 (August 17) prior to the 2022 peak at 151.94 (October 21). On the flip side, the immediate contention is seen at the transitory 55-day SMA at 142.04 ahead of the August low at 141.50 (August 7). The breakdown of this level paves the way for a move to the weekly low of 138.05 (July 28), befoe the July low of 137.23 (July 14) and the 200-day SMA at 136.51. A deeper decline could potentially put the weekly low of 133.01 (April 26) to the test followed by the minor level at 132.01 (April 13) and the April low of 130.62 (April 5). The everyday RSI deflated to the sub-63 levels.
Resistance levels: 146.56 146.79 147.56 (4H chart)
Support levels: 144.92 144.35 143.25 (4H chart)
GBPUSD
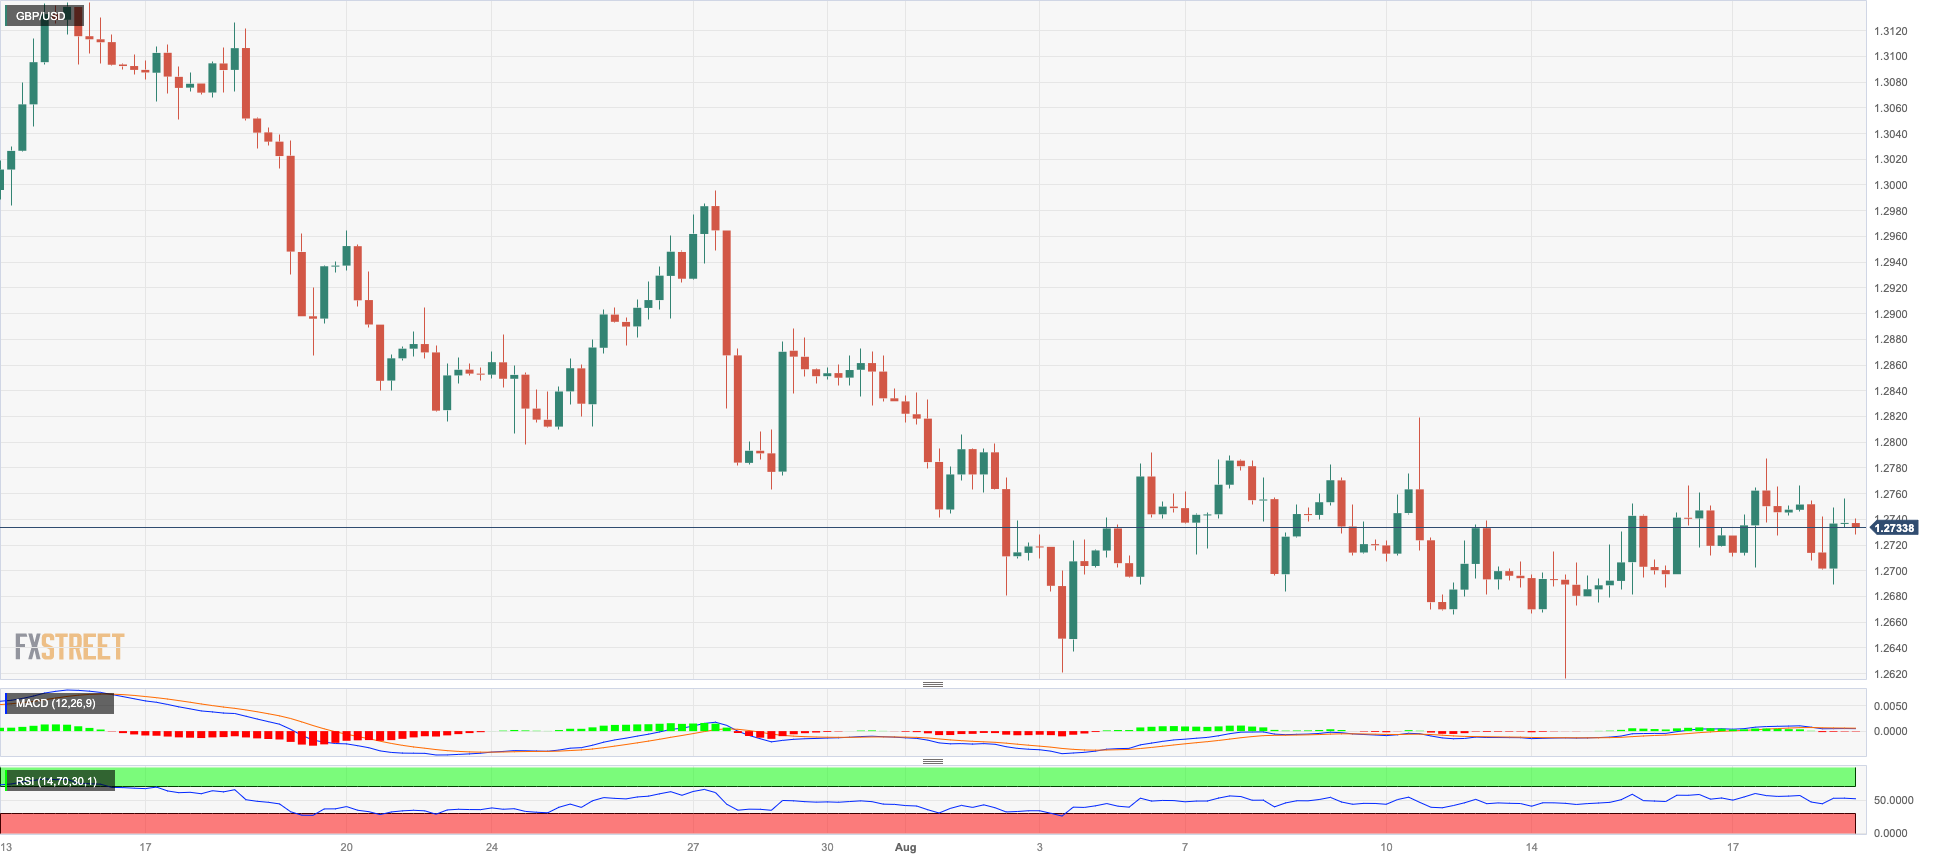
In line with the rest of its risky peers, GBP/USD traded in an irresolute fashion and closed marginally lower in the low-1.2700s at the end of the week, an area also coincident with the provisional 55-day SMA.
The pair’s directionless development also followed the same mood in the greenback after the US Dollar Index (DXY) hit new multi-month tops near the 103.70 level,
In the meantime, the British pound experienced some weakness due to the disappointing release of Retail Sales data, which showed a contraction of 1.2% on a monthly basis in July and a 3.2% decline over the past twelve months.
As investors digested the mixed outcomes from the UK economic indicators throughout the week, the Bank of England (BoE) is anticipated to maintain its pattern of interest rate hikes. On this, market expectations indicate a 25% probability of a 50 bps increase at the September 21 meeting. Additionally, there are expectations of 25 bps hikes in both November and December. These cumulative increases would result in a peak bank rate of around 6.0%, compared to the 6.5% rate at the beginning of the previous month.
Looking at the technical levels, the first hurdle for GBP/USD is the weekly high of 1.2818 (August 10) before another weekly peak at 1.2995 (July 27), which appears just ahead of the key 1.3000 threshold. Further upwards, the 2023 top of 1.3142 (July 14) comes into play before the weekly peaks of 1.3298 (March 15, 2022) and 1.3146 (April 14, 2022). On the downside, the temporary 100-day SMA at 1.2626 reinforces the August low of 1.2616 (August 14) and the weekly low of 1.2590 (June 29). Further downwards, the trendline spanning 2021 to 2023 becomes relevant around 1.2460, prior to the June low of 1.2368 (June 5), which is further supported by the proximity of the 200-day SMA at 1.2377. If this zone is breached, it could expose the May low of 1.2308 (May 25). The daily RSI climbed closer to the 47 area.
Resistance levels: 1.2787 1.2818 1.2888 (4H chart)
Support levels: 1.2689 1.2616 1.2591 (4H chart)
AUDUSD
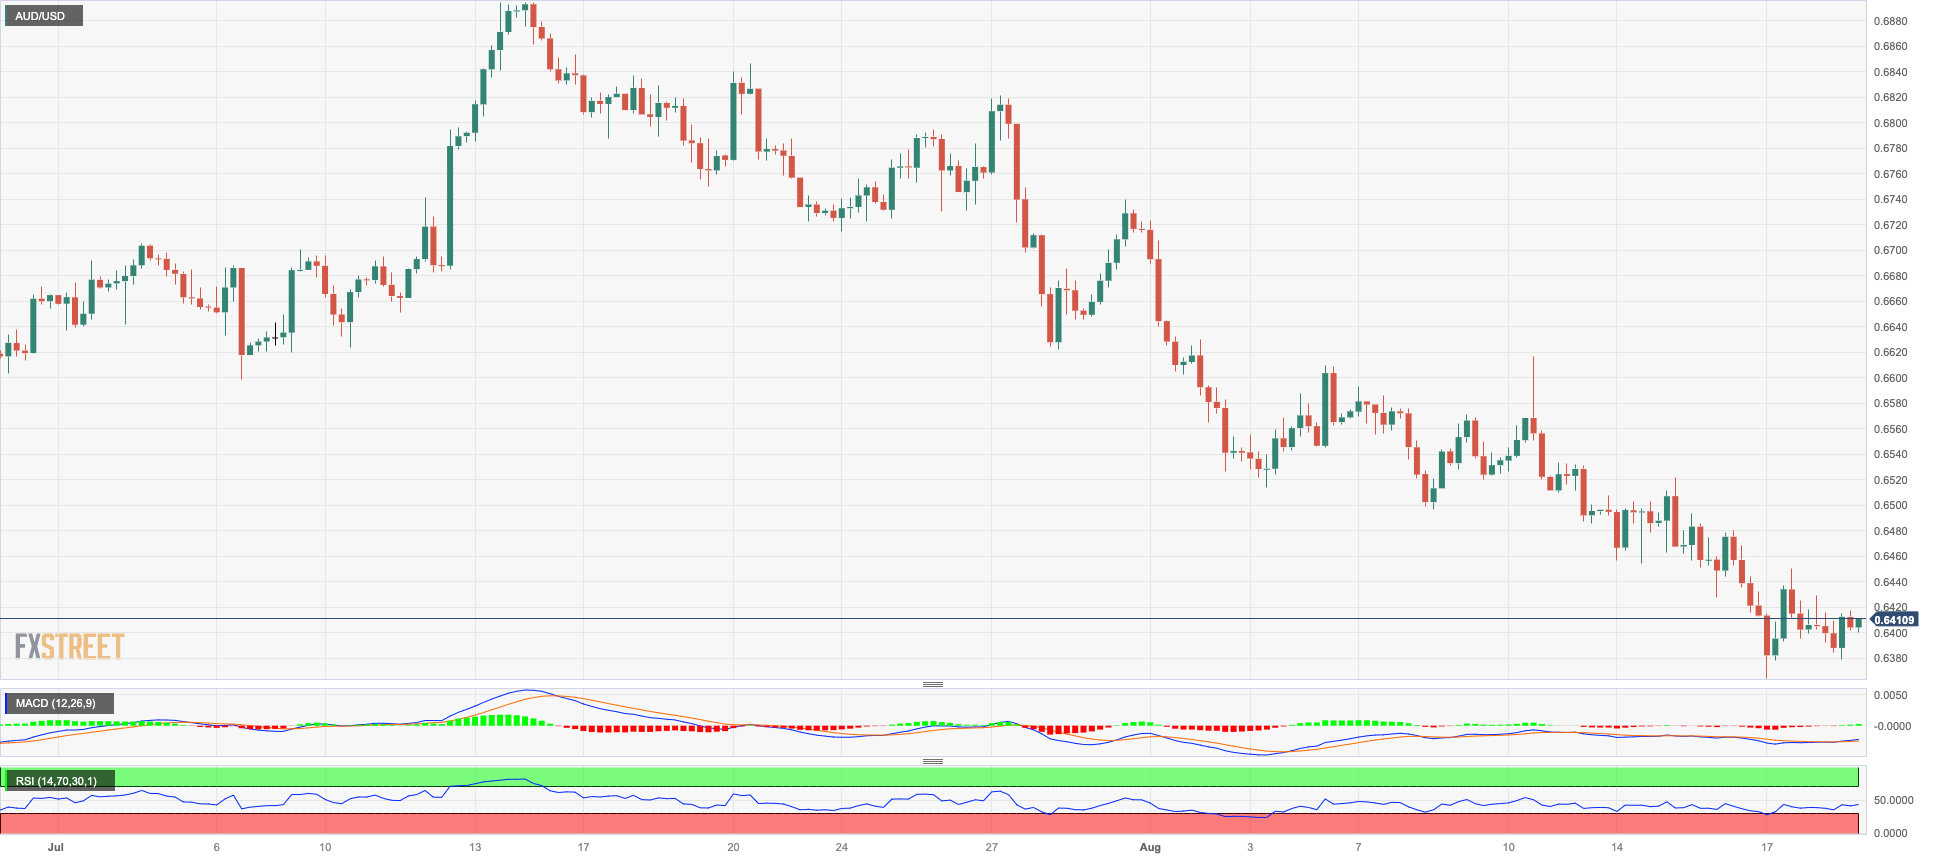
AUD/USD finally managed to see a session of gains, leaving behind eight consecutive daily declines on Friday and bouncing off its lowest level since November 2022 near 0.6365 (August 17).
The flat mood around the buck in combination with the generalized upbeat performance in the commodity galaxy all contributed to the small advance in the Aussie dollar at the end of the week.
The Australian docket was empty on Friday, leaving all the attention to the release of the preliminary PMIs on August 23.
The resumption of the selling pressure could force AUD/USD to revisit the 2023 low of 0.6364 (August 17) in the relatively short-term horizon. Down from here comes the November 2022 low of 0.6272 (November 7) ahead of the 2022 low of 0.6179 (October 13). Just the opposite, initial resistance emerges at the weekly high of 0.6616 (August 10) prior to the 0.6668/74 zone, where the temporary 55-day and 100-day SMAs converge. Once surpassed this region, the pair could test the 200-day SMA of 0.6733 ahead of the July high of 0.6894 (July 14) and the June high of 0.6899 (June 16). North from here emerges the key 0.7000 threshold ahead of the weekly peak of 0.7029 (February 14) and the 2023 high of 0.7157 (February 2). On the daily chart, the RSI held steady near 28, still in the oversold territory.
Resistance levels: 0.6521 0.6616 0.6656 (4H chart)
Support levels: 0.6364 0.6272 0.6210 (4H chart)
GOLD
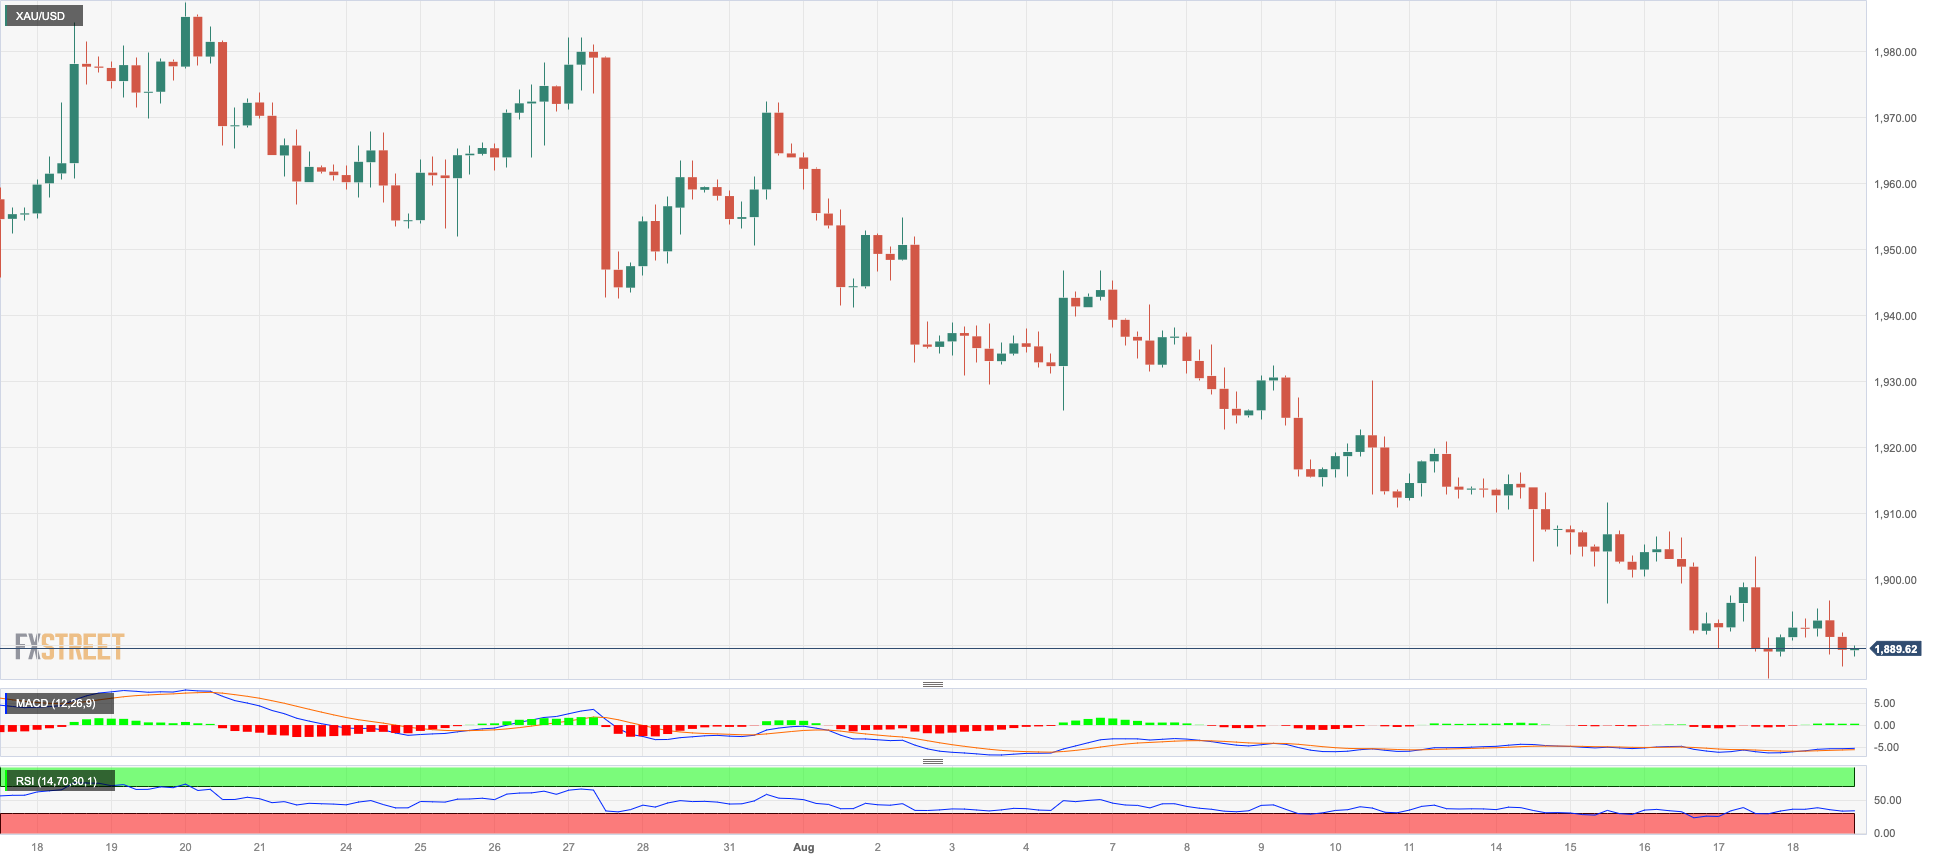
Friday saw prices of the yellow metal trade within a tight range and settle once again around the $1890 region per troy ounce, while any attempt to reclaim the key 200-day SMA ($1905) and beyond remained subdued.
There were no changes to the current scenario around the precious metal, as the greenback traded in the upper end of the recent range near multi-week tops and yields remained elevated despite Friday’s knee-jerk, all underpinned by growing speculation that the Federal Reserve might maintain its restrictive stance for a longer duration than initially expected.
Gold prices hit a new monthly low of $1885 on August 17. If this level is breached, it could potentially open the door to the 2023 low of $1804 (February 28), which comes just ahead of the critical support zone of $1800. Instead, there is an immediate hurdle at the key 200-day SMA at $1905 before the transitory 55-day and 100-day SMAs at $1937 and $1962, respectively. Beyond that, the July high of $1987 serves as an important barrier to overcome. If that level is cleared, gold prices could advance towards the psychological level of $2000. Further up, the path for gold is expected to lead to the 2023 high of $2067 (May 4), followed by the 2022 peak of $2070 (March 8) and the all-time top of $2075 (August 7, 2020).
Resistance levels: $1911 $1927 $1946 (4H chart)
Support levels: $1889 $1885 $1809 (4H chart)
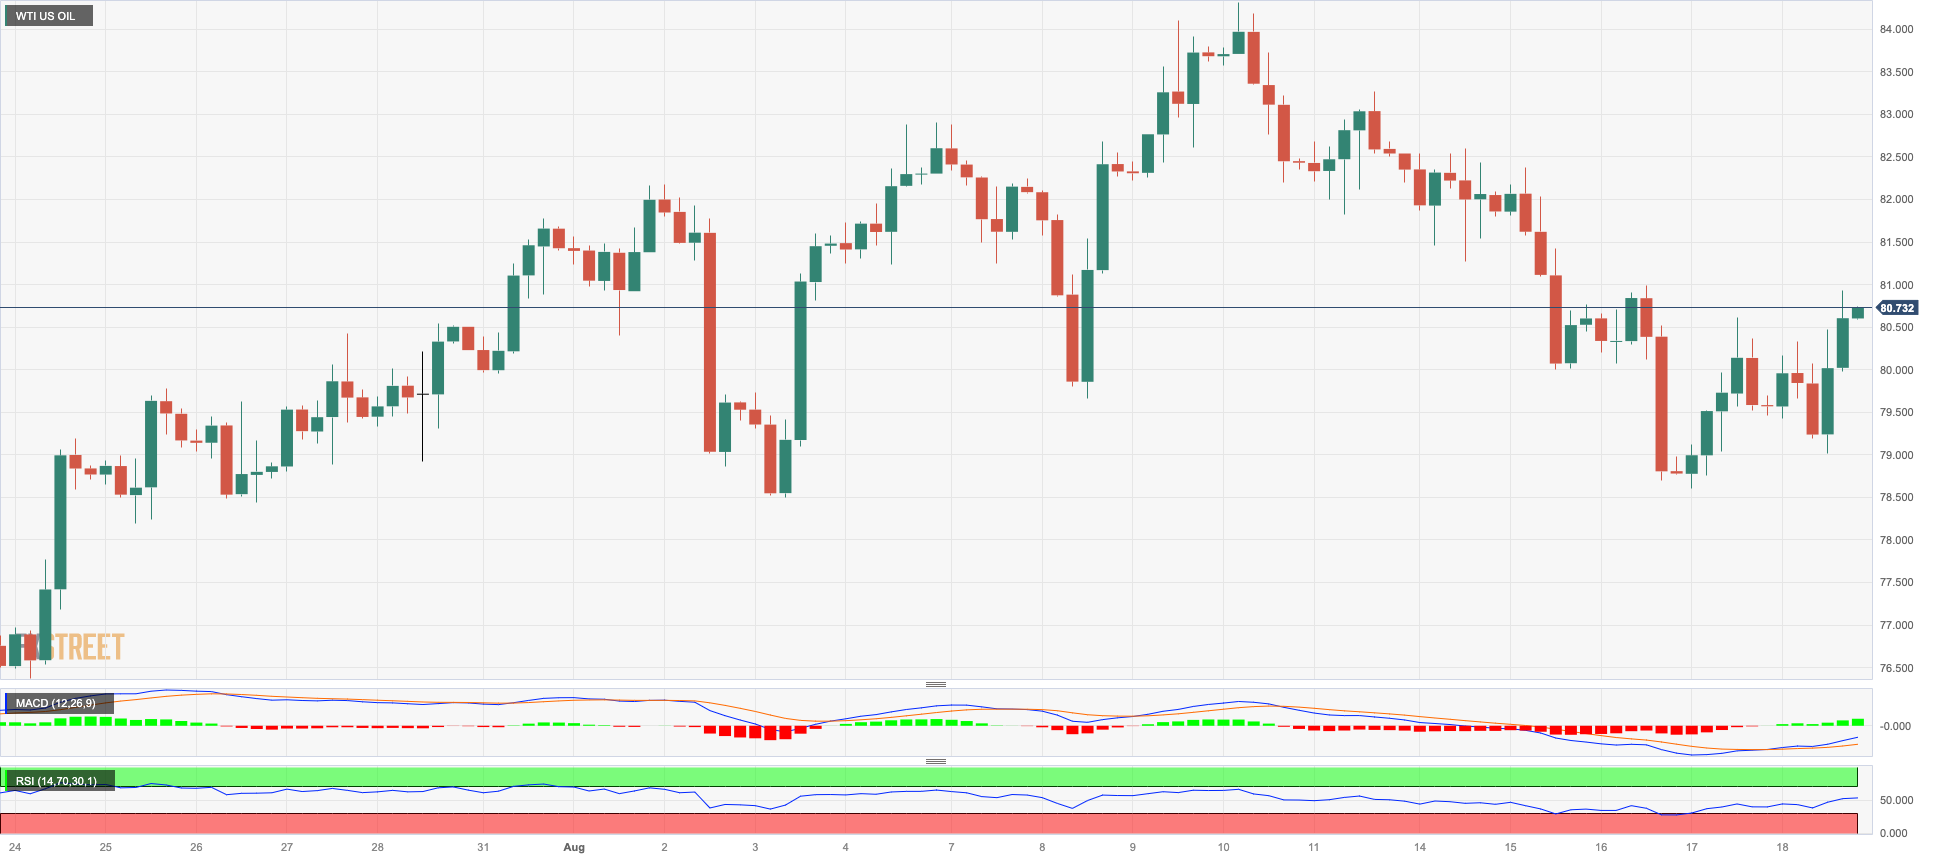
CRUDE WTI
WTI prices continued their upward trajectory for the second consecutive session on Friday. Despite experiencing losses at the end of the first week following seven consecutive advances, the market sentiment remained positive.
The tight supply narrative continued to support the outlook among traders, leading to the continuation of the recovery on Friday that pushed prices above the $81.00 mark per barrel. Additionally, the weekly decrease in crude oil supplies in the United States (as per the EIA’s report) also contributed to the upward movement in prices.
Despite concerns surrounding demand from China, the positive factors outweighed these worries, resulting in the sustained uptick in WTI prices.
In the docket, driller Baker Hughes reported that US total oil rigs went down by 5 to 520 in the week to August 18.
Further rebound could motivate WTI prices to challenge the 2023 top at $84.85 (August 10) prior to the November 2022 high at $93.73 (November 7) and the weekly high at $97.65 (August 30 2022). If selling pressure builds, WTI should find support at the August low of $78.74 (August 4) prior to the crucial 200-day SMA at $76.21. South of this is the $75.20 area where the preliminary 55-day and 100-day SMAs sit. If this zone is breached, the commodity could weaken to the weekly low of $73.89 (July 17) followed by the June low at $66.86 (June 12) and the 2023 low at $63.61 (May 4). A deeper retracement could take it to the December 2021 low of $62.46 (December 2), short of the key $60.00 per barrel.
Resistance levels: $81.30 $83.77 $84.85 (4H chart)
Support levels: $78.92 $73.81 $72.64 (4H chart)
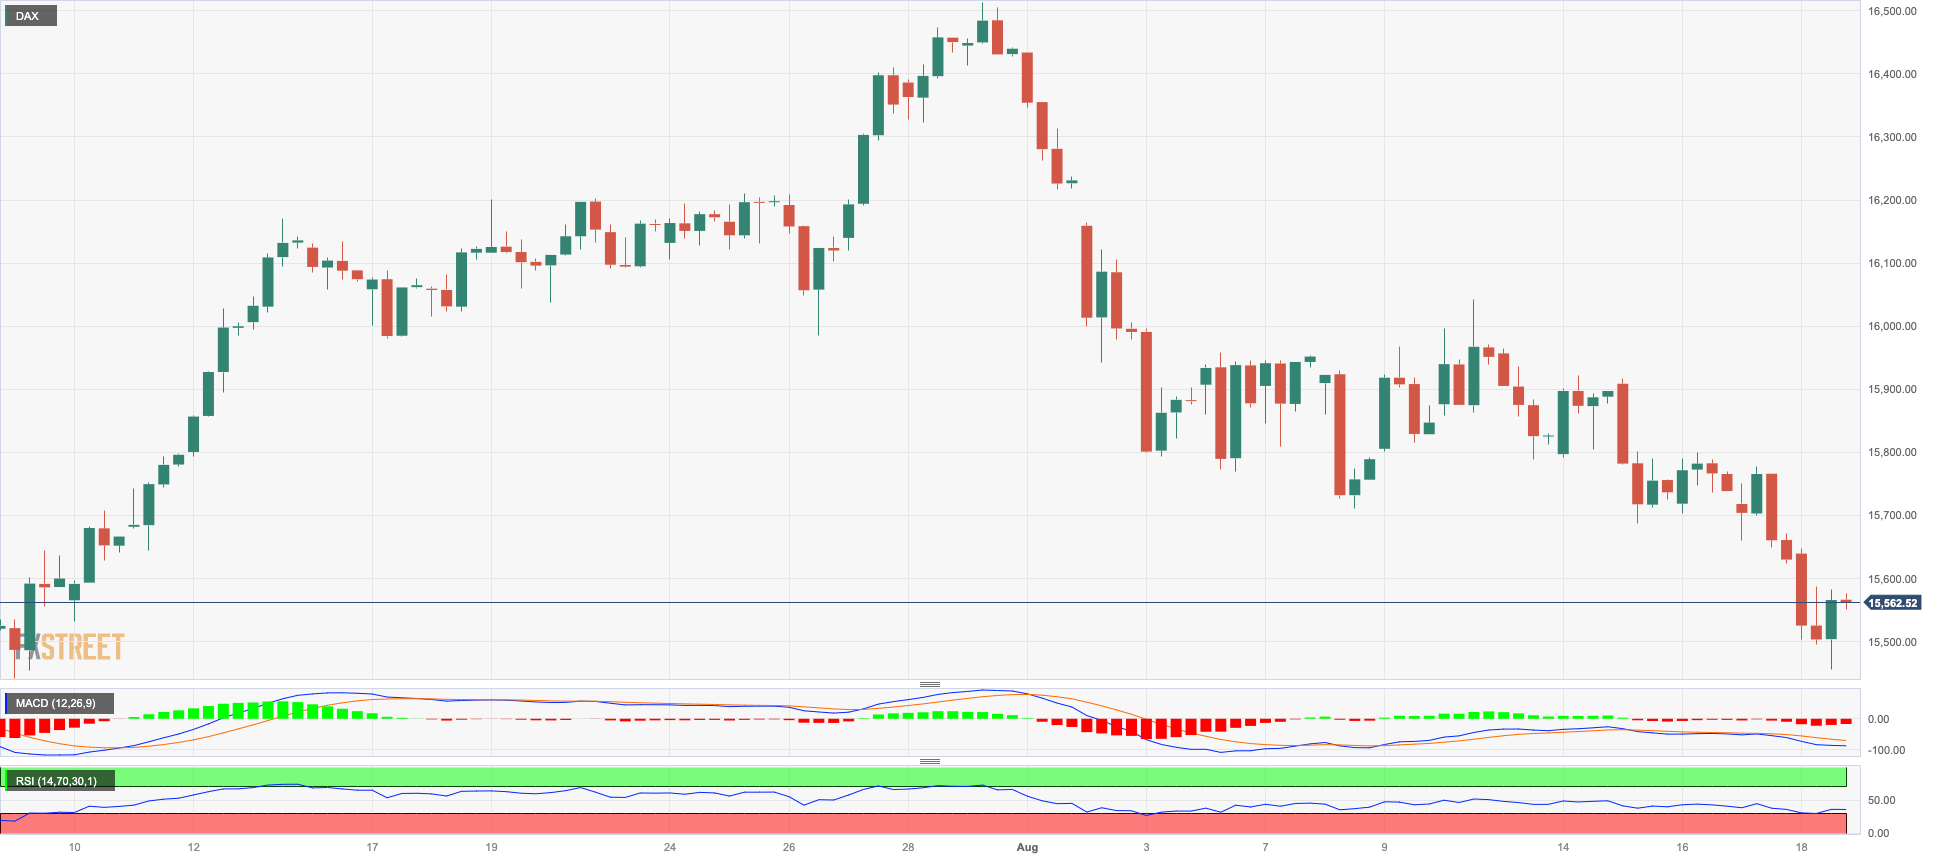
GER40
The DAX40, a prominent German stock index, intensified its downward movement and added to Thursday’s losses after revisiting the area of six-week lows near 15500 at the end of the week.
Apprehensions about the Federal Reserve adopting a stance of prolonged monetary tightening continued to weigh on market participants’ sentiment, while persistent elevated inflation in the euro area and weaker-than-estimated UK Retail Sales collaborated with the sour mood among investors on Friday.
Friday’s pullback in the index coincided with the drop to weekly lows in the yield on the 10-year German bund, which revisited the 2.60% zone.
The August low of 15468 (August 18) comes just before the July bottom of 15456 (July 7) and the critical 200-day SMA of 15370. If the DAX40 breaks below the latter, it may also reach the March low of 14458 (March 20) ahead of the December 2022 low of 13791 (December 20) and the 2022 low of 11862 (September 28). Conversely, if the weekly high of 16060 (August 10) is surpassed, it might motivate the index to challenge its all-time top of 16528 (July 31). The daily RSI dropped to the proximity of 36
Best Performers: Rheinmetall AG, E.ON SE, Qiagen
Worst Performers: Sartorius AG VZO, Zalando SE, Siemens Energy AG
Resistance levels: 16060 16146 16528 (4H chart)
Support levels: 15468 15456 14809 (4H chart)
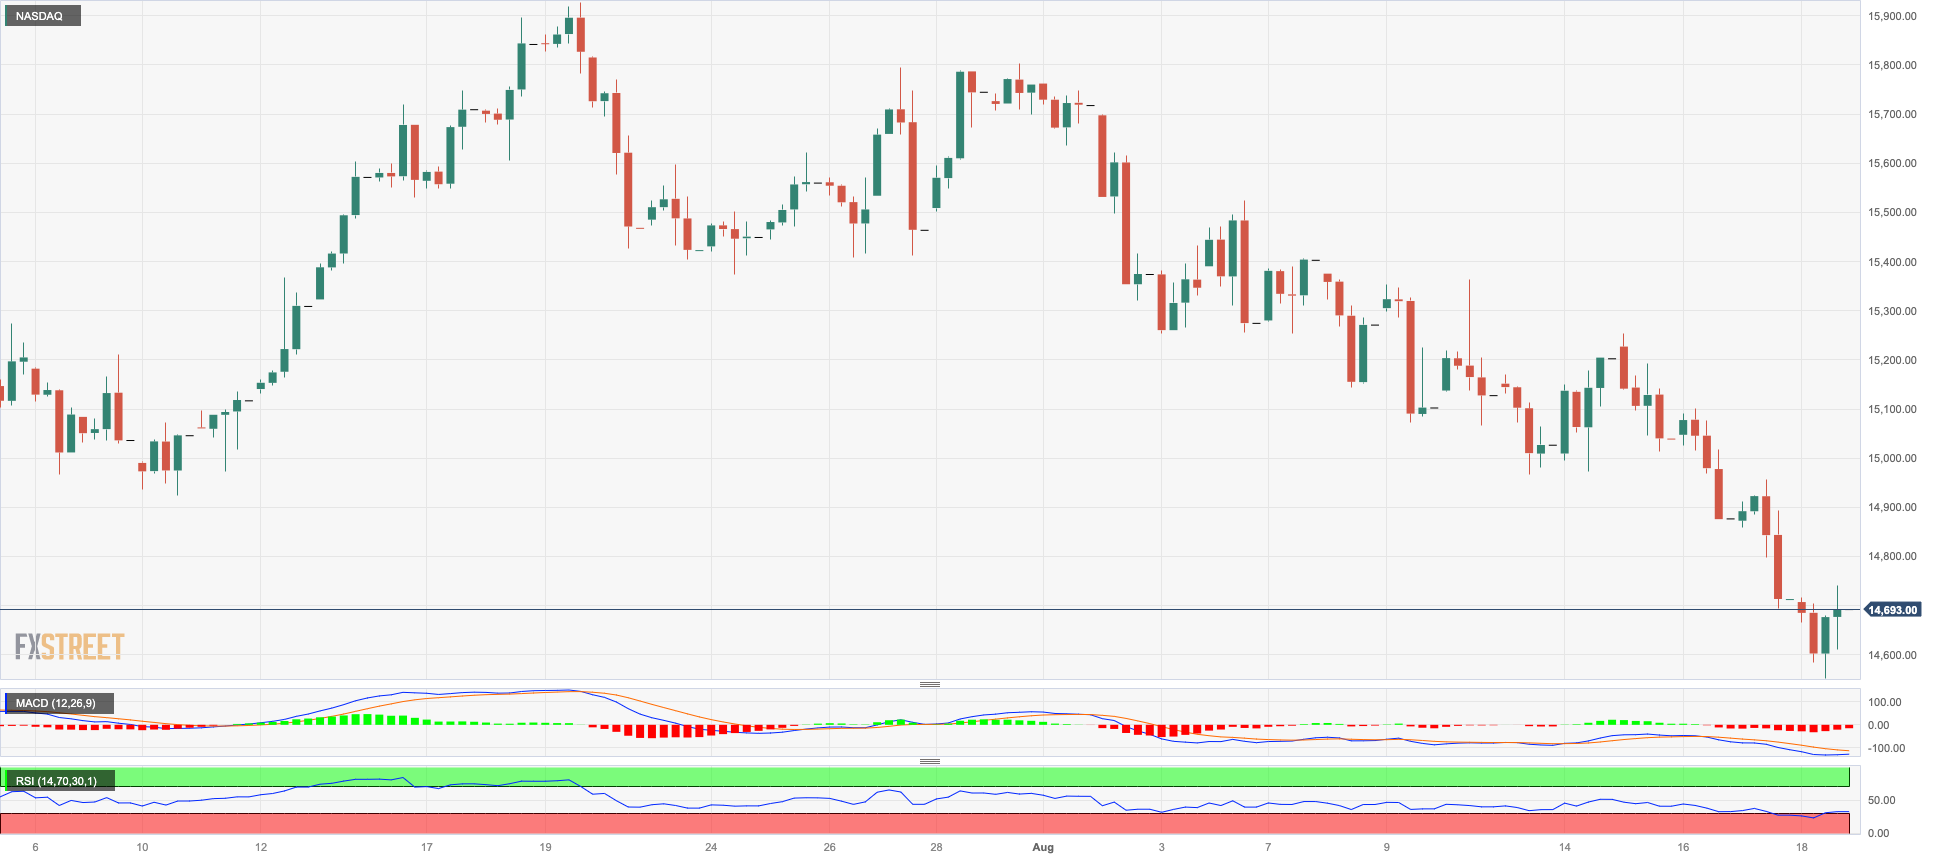
NASDAQ
The Nasdaq 100, like most of the American indices, ended Friday’s session with modest losses and revisited levels last seen in early January around the 14500 zone.
In fact, market players maintained their conservatism in the tech sector in the face of growing speculation that the Fed may remain in restrictive zone for longer than previously believed, while the late bounce in US yields and the flat performance of the greenback also kept price action on the defensive at the end of the week.
The Nasdaq 100 is currently eyeing its next target on the downside at the August low of 14557 (August 18) prior to the weekly low at 14283 (June 7). Further down the line, we have the weekly low of 13520 (May 24), followed by the 200-day SMA at 13039 and the April low of 12724 (April 25). On the upside, the immediate resistance is the weekly high of 15803 (July 31) before the 2023 peak of 15932 (July 19) and the round level of 16000. The day-to-day RSI slipped back below 35.
Top Gainers: Ross Stores, Datadog, Applied Materials
Top Losers: JD.com Inc Adr, Moderna, PDD Holdings DRC
Resistance levels: 15128 15803 15932 (4H chart)
Support levels: 14557 14282 13520 (4H chart)
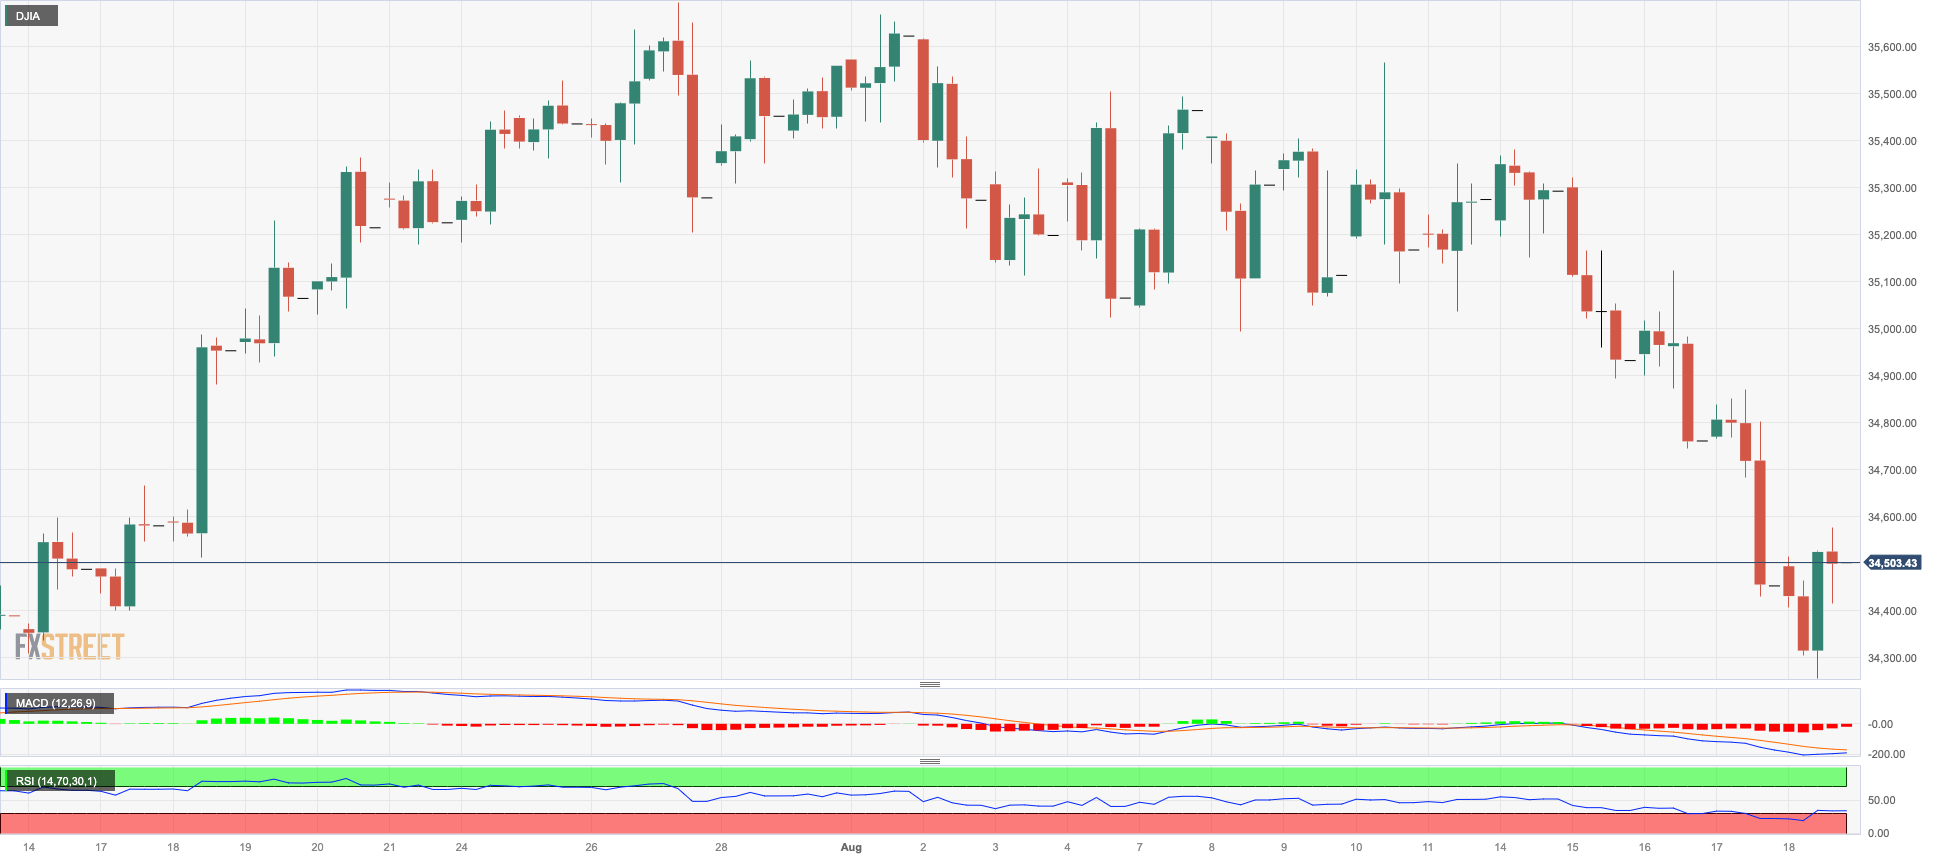
DOW JONES
Stocks gauged by the Dow Jones reversed three consecutive daily drops and reclaimed the 34500 zone amidst humble gains at the end of the week.
Indeed, investors maintained a prudent approach in light of rising speculation that the Federal Reserve might keep a more restrictive monetary policy for an extended period, a view that appears bolstered by a resilient economy and still elevated consumer prices.
On the whole, the Dow Jones gained 0.07% to 34500, the S&P500 dropped 0.01% to 4369, and the tech-heavy Nasdaq Composite deflated 0.20% to 13290.
If the Dow Jones continues to fall, the temporary 100-day SMA at 34042 could be retargeted. A deeper correction will take the July low of 33705 (July 10) before the 200-day SMA at 33687. The breach of the latter exposes the May low of 32586 (May 25) before reaching the 2023 low of 31429 (March 15). The bulls, on the other hand, continue to target the 2023 high of 35679 (August 1) ahead of the February 2022 top of 35824 (February 9) and the all-time peak of 36952 (January 5, 2022). The daily RSI settled around the 40 zone.
Top Performers: Walmart, Boeing, UnitedHealth
Worst Performers: J&J, Goldman Sachs, Amgen
Resistance levels: 35123 35679 35824 (4H chart)
Support levels: 34263 34034 33705 (4H chart)
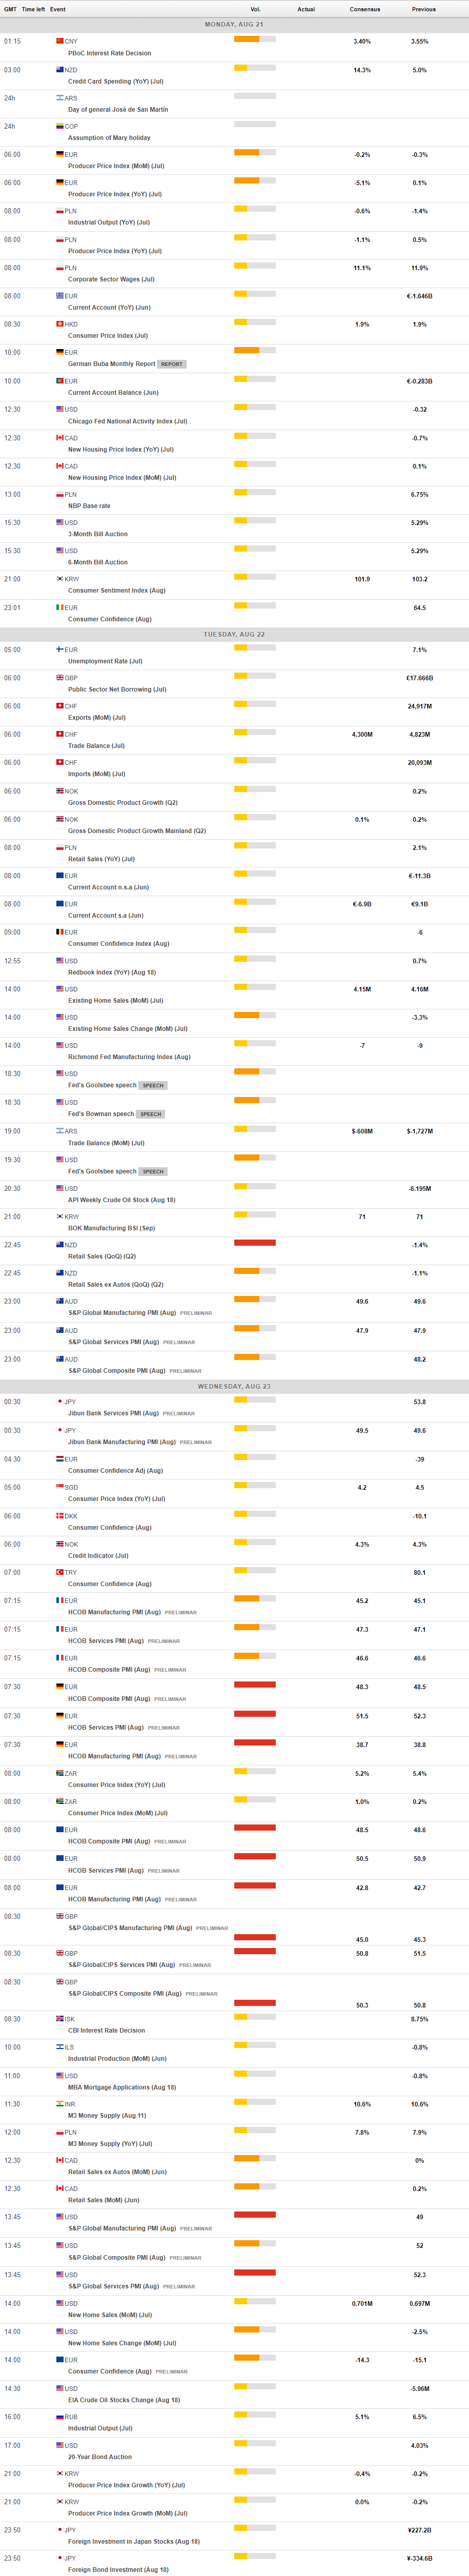
MACROECONOMIC EVENTS
All Information & Updates provided by:

All information relating to the financial markets available on this page has been prepared and issued by FXStreet (Forexstreet SL, Spain, Reg: B62498233) on the basis of publicly available information and all information believed to be reliable and does not conflict with Kuwaiti local laws, and all necessary care has been taken to before the company to ensure that the facts mentioned are correct from the source.
NCM Investment nor any of its directors or employees shall in any way be held responsible for the contents of this news, and the information contained on this page is intended only to provide clients with publicly available information and should not be construed as investment advice, report or analysis and/or constitute an offer or invitation to buy or sell financial instruments of any kind.
RISK WARNING: Forex and CFDs are highly risky leveraged products, as losses can exceed deposits. Please ensure you understand all the risks and take independent advice if necessary. NCM will segregate the clients based on the criteria of the regulator and its bylaws. NCM does not provide any advisory service; the material published does not constitute advice or a recommendation for a transaction in any financial instrument. NCM accepts no responsibility for any use of the content presented and any consequences of that use. Anyone acting on the information provided does so at their own risk.