
- Contact Us:
-

-

-

-


Daily Market Updates
22 Aug 2023
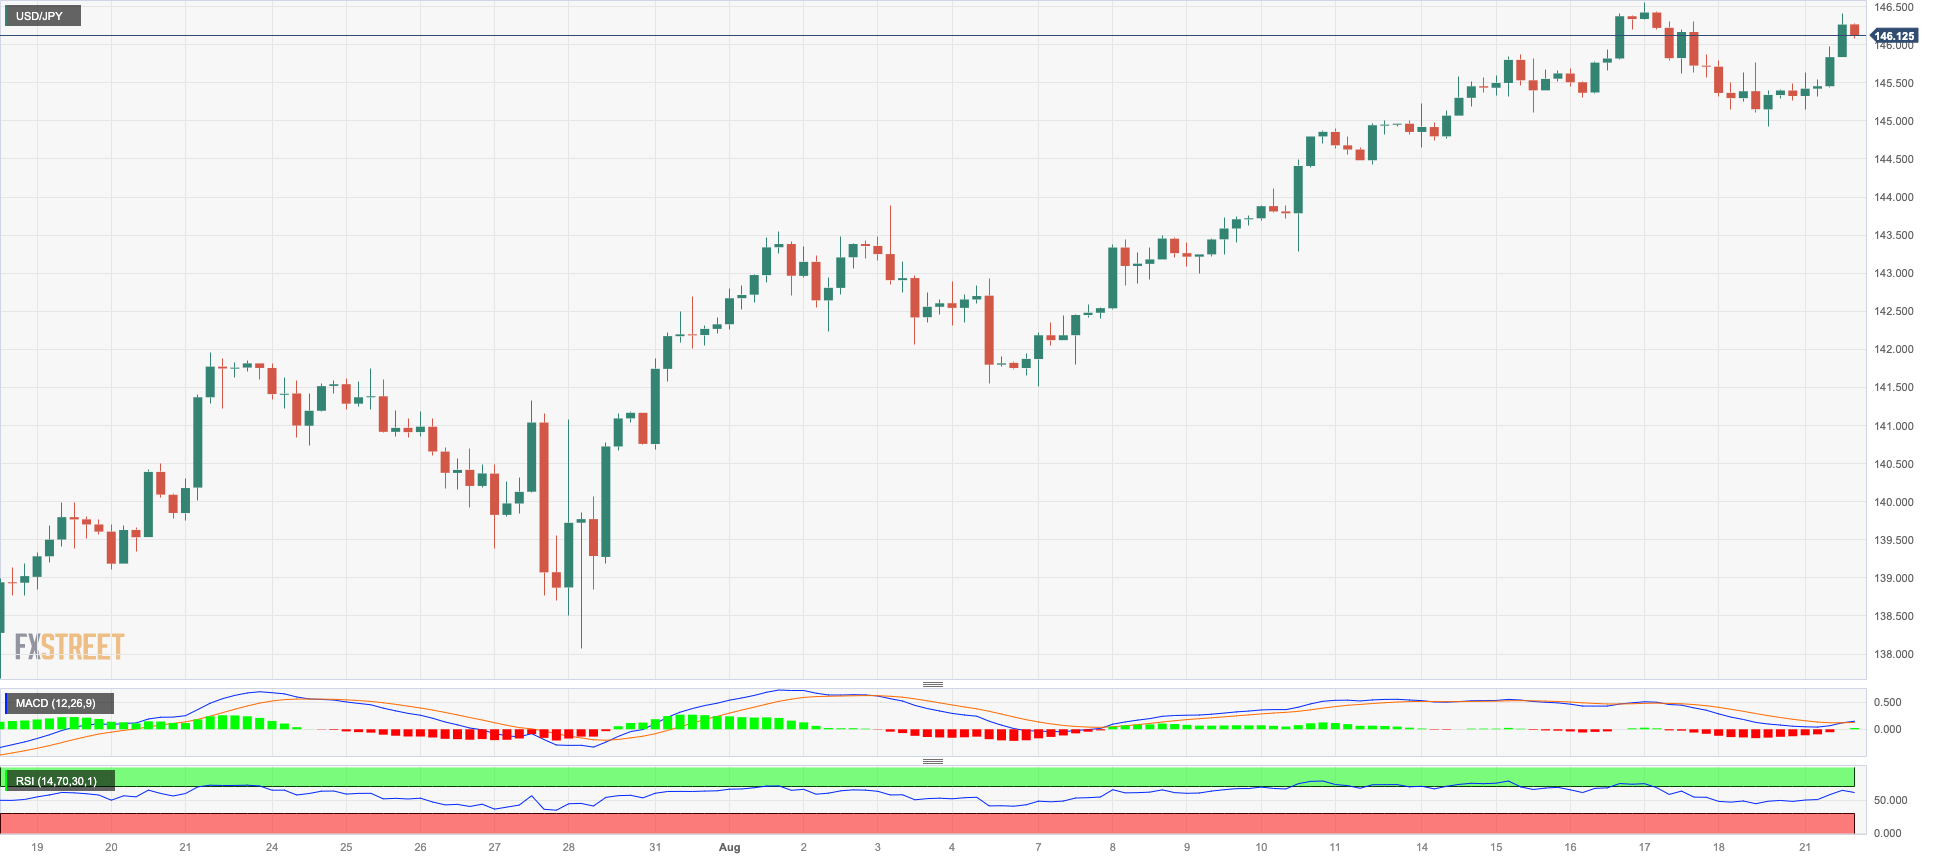
USDJPY
USD/JPY resumed the uptrend, left behind two consecutive daily pullbacks, and repositioned once again to challenge the so far 2023 peaks north of 146.00 the figure on Monday.
Higher US yields across the curve vs. the somewhat consolidative mood in JGB 10-year yields lent support to the upside bias in the pair despite the corrective move in the buck.
The Japanese docket will see no data releases until Wednesday’s publication of flash PMIs.
Next on the upside for USD/JPY emerges the 2023 high at 146.56 (August 17) before the 2022 peak at 151.94 (October 21). Having said that, the transitory 55-day SMA at 142.6 is considered as the immediate contention ahead of the August low at 141.50 (August 7). The breakdown of this level could pave the way for a move to the weekly low of 138.05 (July 28), before the July low of 137.23 (July 14) and the 200-day SMA at 136.54. A further slide might challenge the weekly low of 133.01 (April 26), the minor level of 132.01 (April 13), and the April low of 130.62 (April 5). The daily RSI advanced past the 66 barrier.
Resistance levels: 146.56 146.79 147.56 (4H chart)
Support levels: 144.92 143.25 142.18 (4H chart)
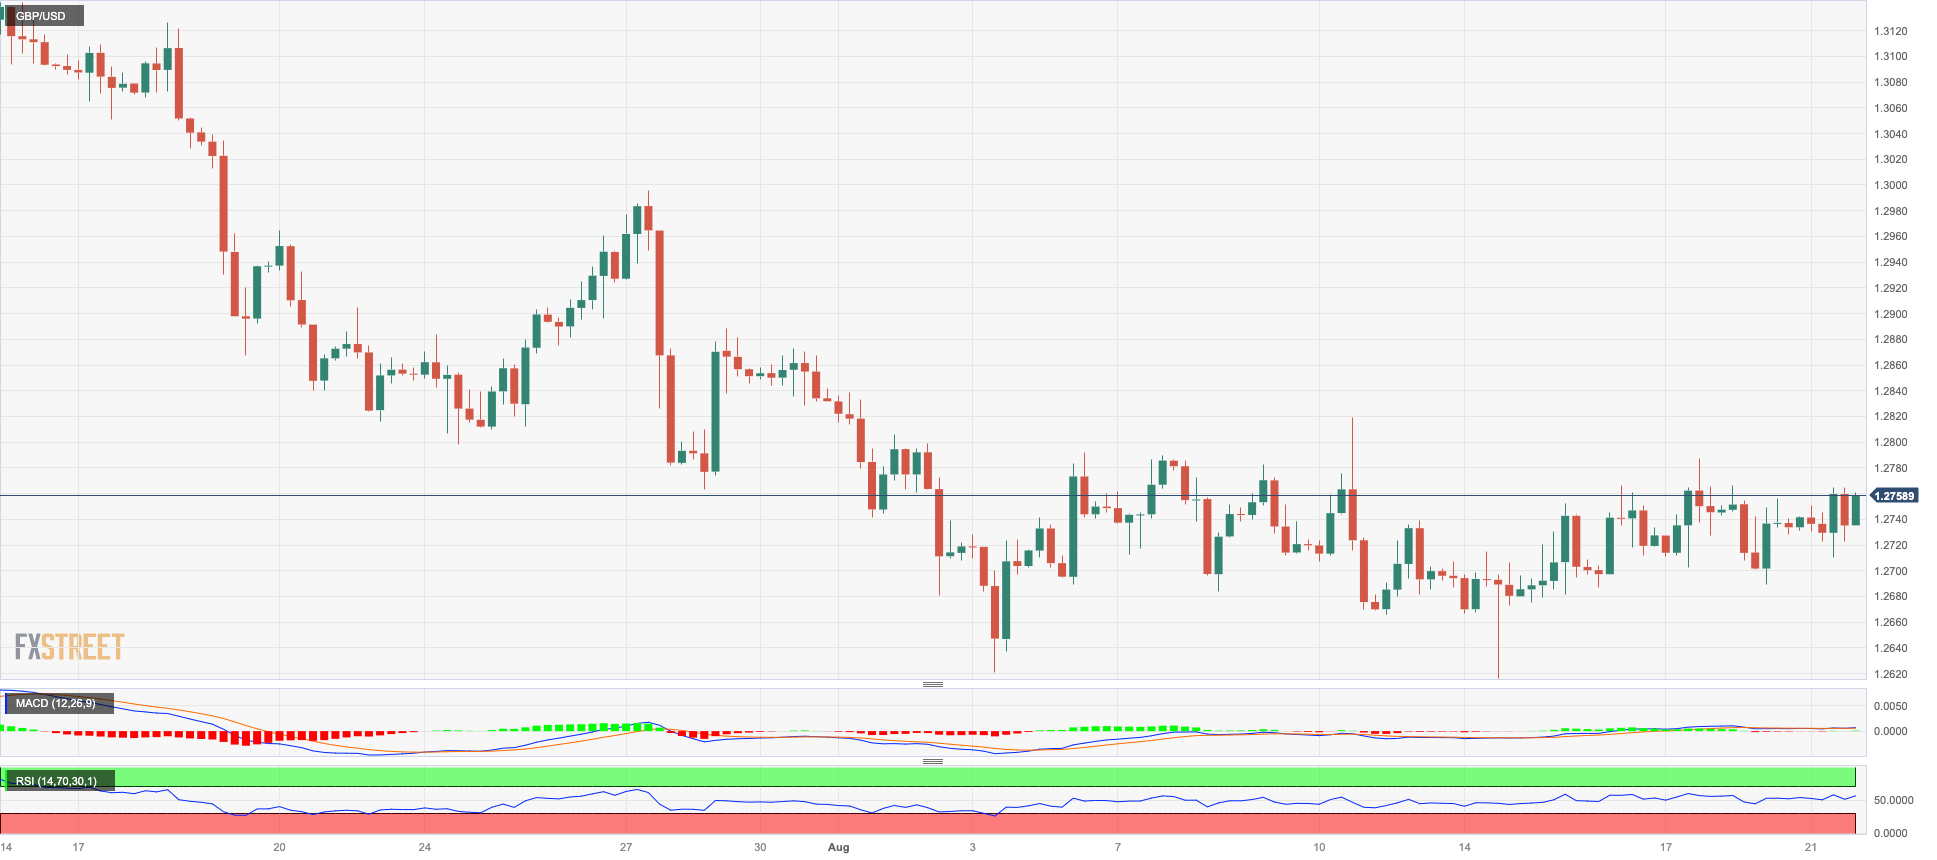
GBPUSD
Following the upbeat mood in the broad risk-linked galaxy, the sterling managed to reverse Friday’s drop and stage a small uptick vs. the greenback at the beginning of the week.
Indeed, GBP/USD briefly flirted with the 1.2770 region, an area also coincident with the temporary 55-day SMA, just to give away part of that initial advance as the session progressed.
The UK calendar was empty on Monday, whereas the UK public sector figures as well as CBI Industrial Trends Orders are due on Tuesday.
Looking at the technical levels, the first stumbling block for GBP/USD is the weekly high of 1.2818 (August 10), followed by another weekly high of 1.2995 (July 27), which appears just ahead of the important 1.3000 barrier. Further up, the weekly top of 1.3298 (March 15, 2022) and 1.3146 (April 14, 2022) come into play once Cable clears the 2023 peak of 1.3142 (July 14). On the downside, the temporary 100-day SMA at 1.26300 comes before the August low of 1.2616 (August 14) and the weekly low of 1.2590 (June 29). Further down, the trendline covering 2021 to 2023 becomes crucial around 1.2460, before to the June low of 1.2368 (June 5), which is supported by the proximity of the 200-day SMA at 1.2382. If this zone is breached, it could expose the May low of 1.2308 (May 25). The daily RSI rose above the 48 hurdle.
Resistance levels: 1.2787 1.2818 1.2888 (4H chart)
Support levels: 1.2689 1.2616 1.2591 (4H chart)
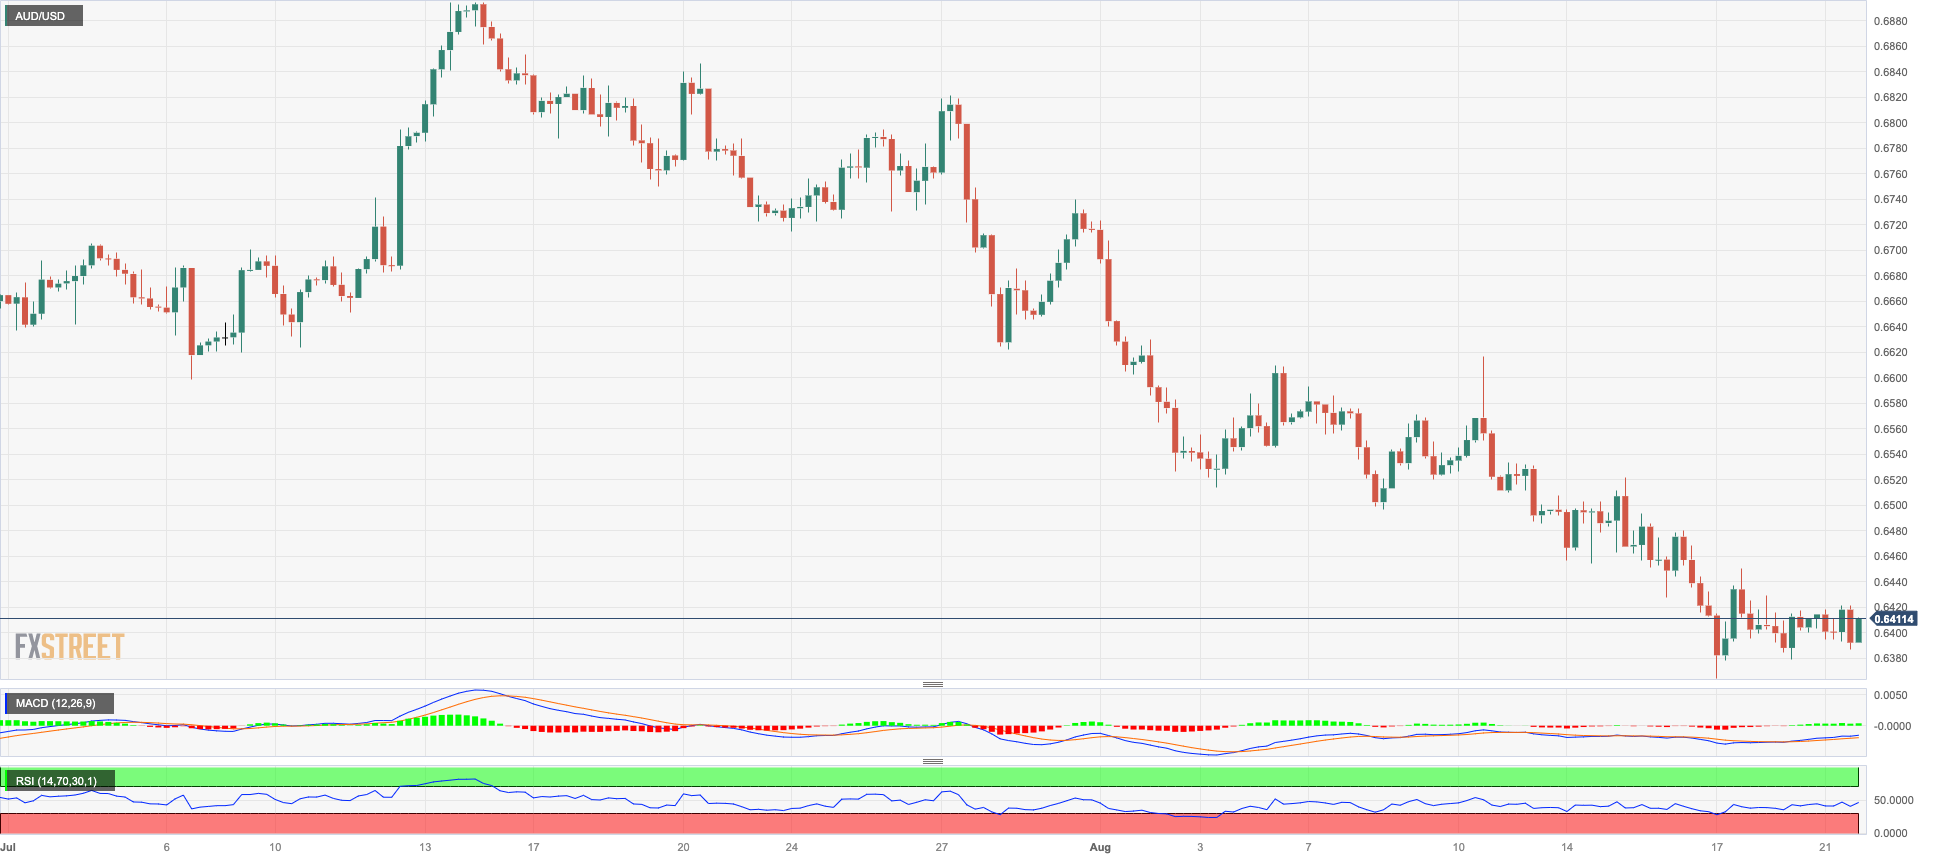
AUDUSD
Bulls remained absent around the Aussie dollar for yet another session on Monday.
Indeed, AUD/USD ended the session amidst inconclusive price action and seems to have moved into a consolidative range at the lower end of the current range near the 0.6400 neighbourhood.
Concerns around the worsening outlook for the Chinese economy continued to weigh on the Aussie dollar, which was at the same time unable to gather some traction in light of the tepid recovery in the commodity complex.
The next scheduled data release in Oz will come on Wednesday with the publication of advanced PMIs for the current month.
The resumption of selling pressure could force AUD /USD to retake the 2023 low of 0.6364 (August 17) in the relatively short-term horizon. From here, the November 2022 low at 0.6272 (November 7) is reached ahead of the 2022 low at 0.6179 (October 13). On the flip side, initial resistance arises at the weekly high of 0.6616 (August 10) ahead of the 0.6674/70 band, where the preliminary 55-day and 100-day SMAs converge. Once above this area, the pair could test the 200-day SMA at 0.6731 ahead of the July high of 0.6894 (July 14) and the June top of 0.6899 (June 16). North of this is the important threshold of 0.7000 prior to the weekly peak of 0.7029 (February 14) and the 2023 high of 0.7157 (February 2). On the daily chart, the RSI settled around 28, still within the oversold zone.
Resistance levels: 0.6521 0.6616 0.6640 (4H chart)
Support levels: 0.6364 0.6272 0.6210 (4H chart)
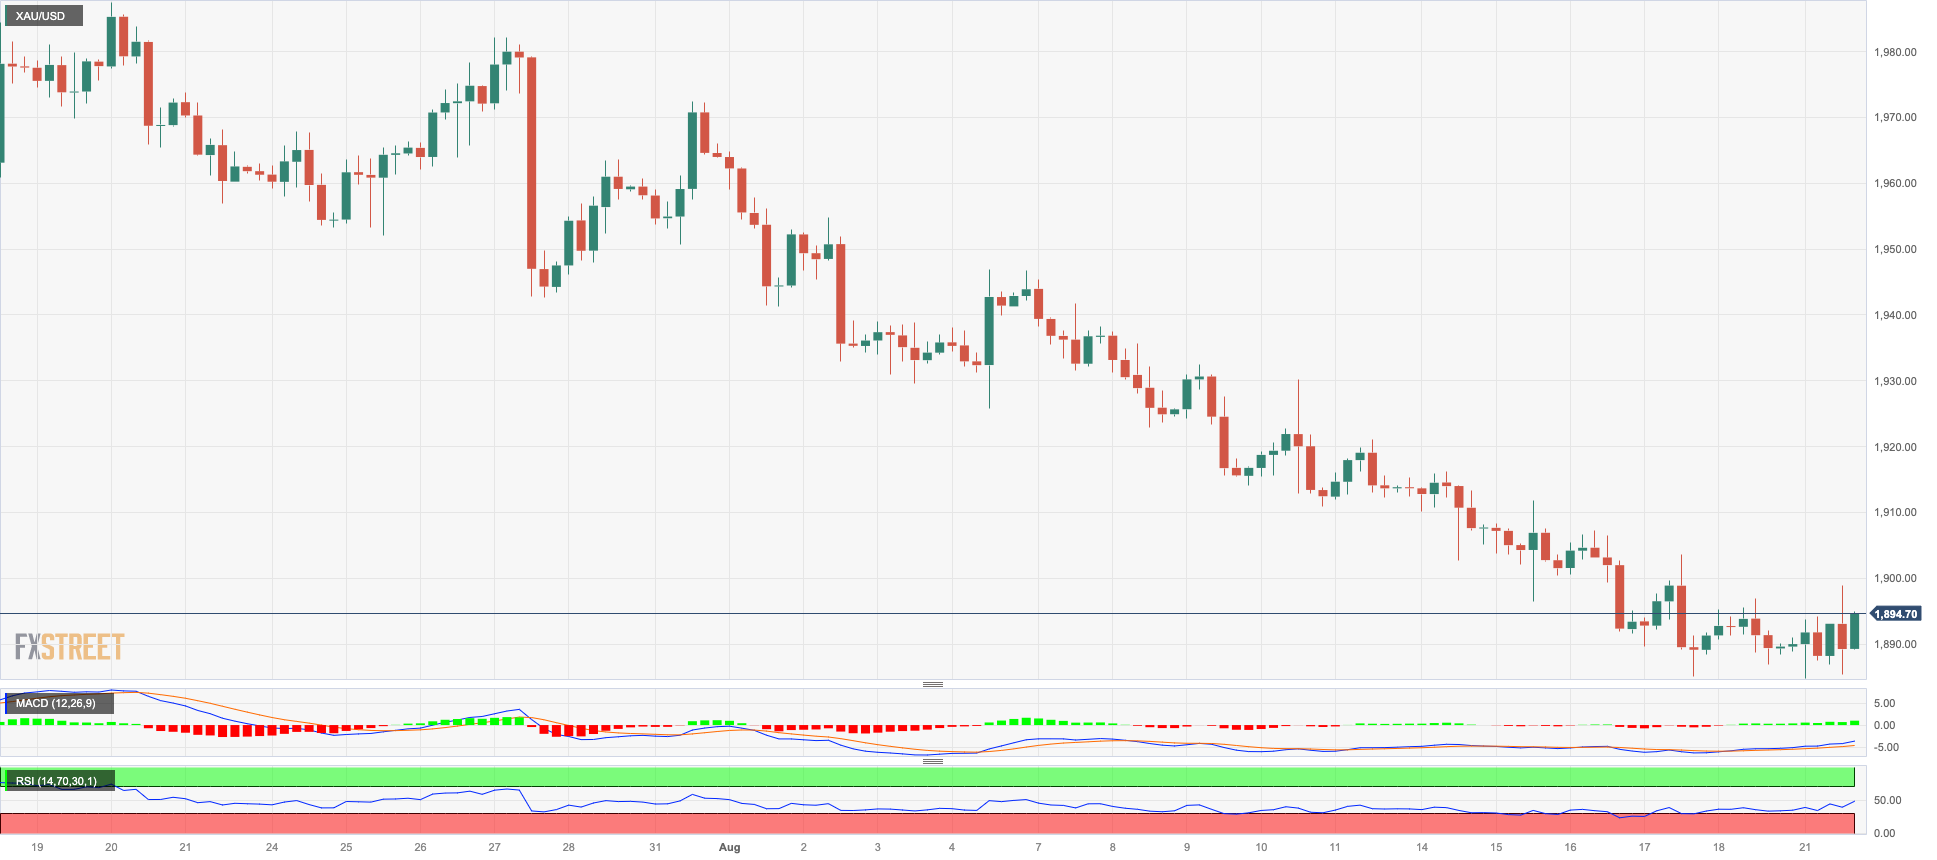
GOLD
Gold prices moved within a narrow trading range in the area below the key $1900 mark per troy ounce at the beginning of the week.
Further losses in the greenback contrasted with the continuation of the rally in US yields across different maturities, relegating the yellow metal to navigate without clear direction on Monday.
Moving forward, bullion is expected to remain under the microscope ahead of the Jackson Hole Symposium and the speech by Chair J. Powell.
The gold price reached a new monthly low of $1884 on August 21. If this level is broken, it could open the door to the 2023 low of $1804 (February 28), which is just ahead of the critical support zone of $1800. Instead, there is an immediate hurdle at the important 200-day SMA at $1906 before reaching the transitory 55-day and 100-day SMAs at $1935 and $1961 respectively. In addition, the July top of $ 1987 is an important hurdle to overcome. Once the latter is cleared, the metal could rise towards the psychological mark of $2000 prior to the 2023 high of $2067 (May 4), seconded by the 2022 peak of $2070 (March 8) and the all-time top of $2075 (August 7, 2020).
Resistance levels: $1911 $1927 $1946 (4H chart)
Support levels: $1884 $1809 $1804 (4H chart)
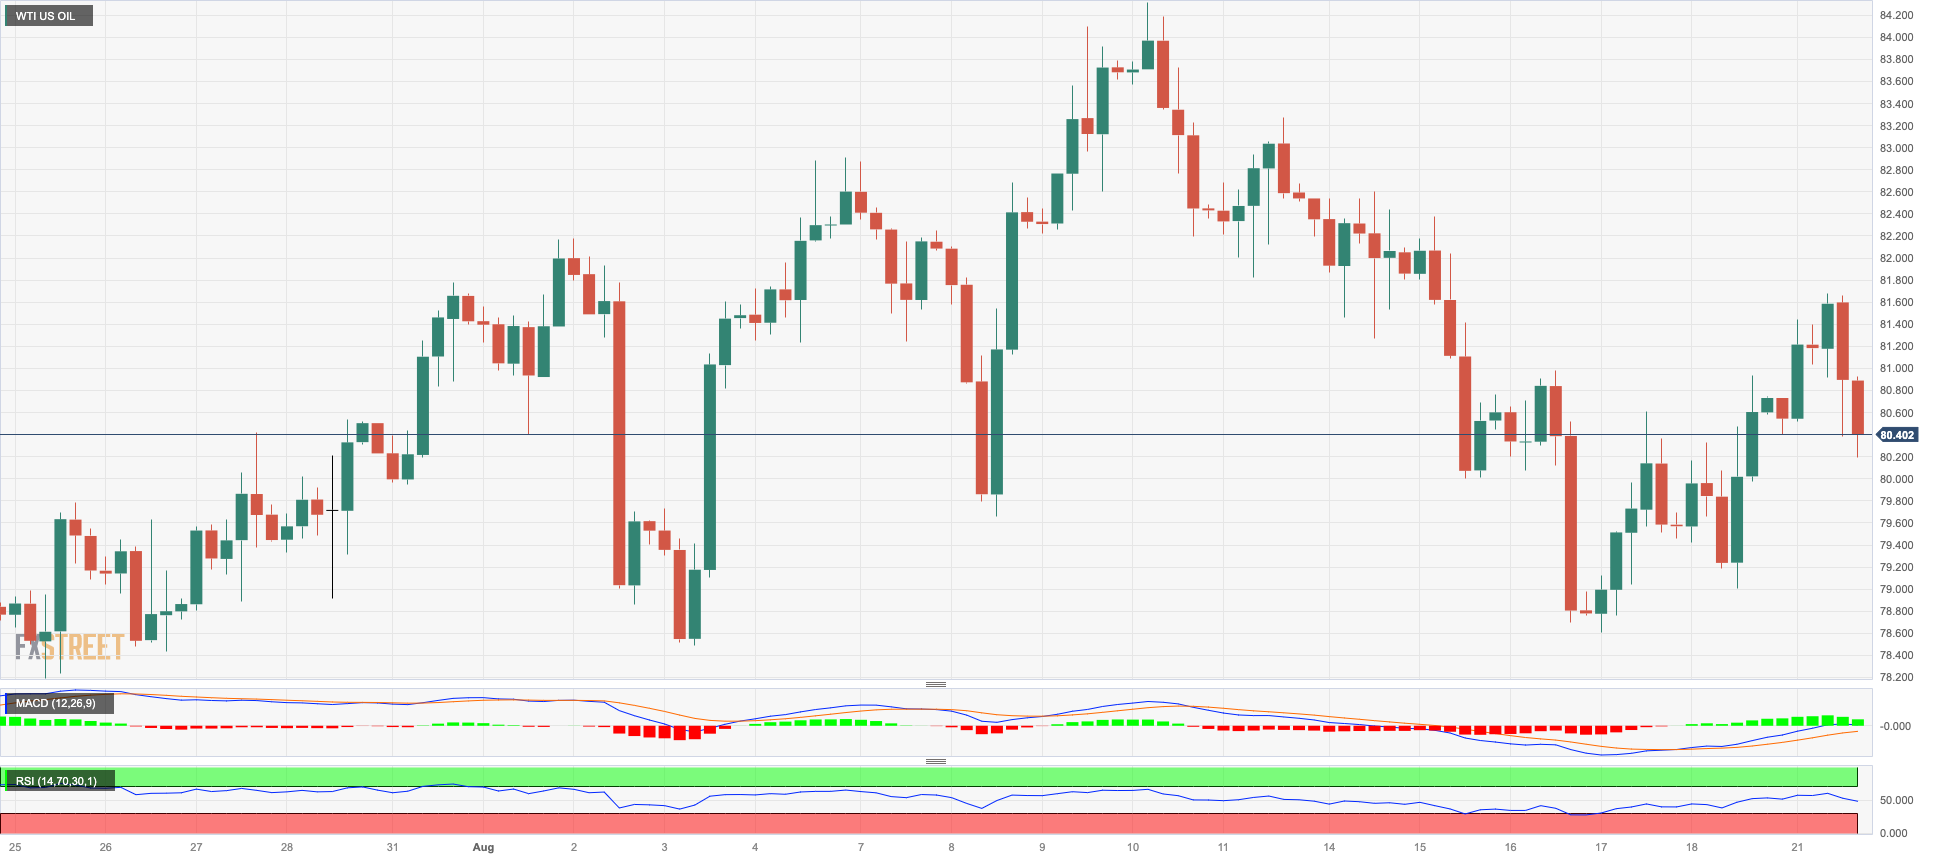
CRUDE WTI
Prices of WTI could not sustain the earlier move to four-day tops past the $82.00 mark per barrel and succumbed to the will of sellers at the beginning of the week.
In the meantime, news that Iraq could resume its crude oil exports via the Ceyhan port in Türkiye appears to have weighed on traders’ sentiment and set aside the usual tight supply narrative and worries surrounding the still-absent recovery in China.
As usual around the commodity calendar, the API and the EIA will report on US crude oil inventories in the week to August 18 on Tuesday and Wednesday, respectively.
WTI prices might rise further, challenging the 2023 high of $84.85 (August 10) before the November 2022 top of $93.73 (November 7) and the weekly peak of $97.65 (August 30 2022). If selling pressure increases, WTI should find support around the August low of $78.74 (August 4) prior to the critical 200-day SMA at $76.17. The 55-day and 100-day SMAs are located south of this at $75.45 and $75.23, respectively, and are expected to offer interim contention ahead of the weekly low of $73.89 (July 17) followed by the June low of $66.86 (June 12), and the 2023 low of $63.61 (May 4). A deeper pullback might drag prices to the December 2021 low of $62.46 (December 2) before the key $60.00 per barrel.
Resistance levels: $81.69 $83.77 $84.85 (4H chart)
Support levels: $78.92 $73.81 $72.64 (4H chart)
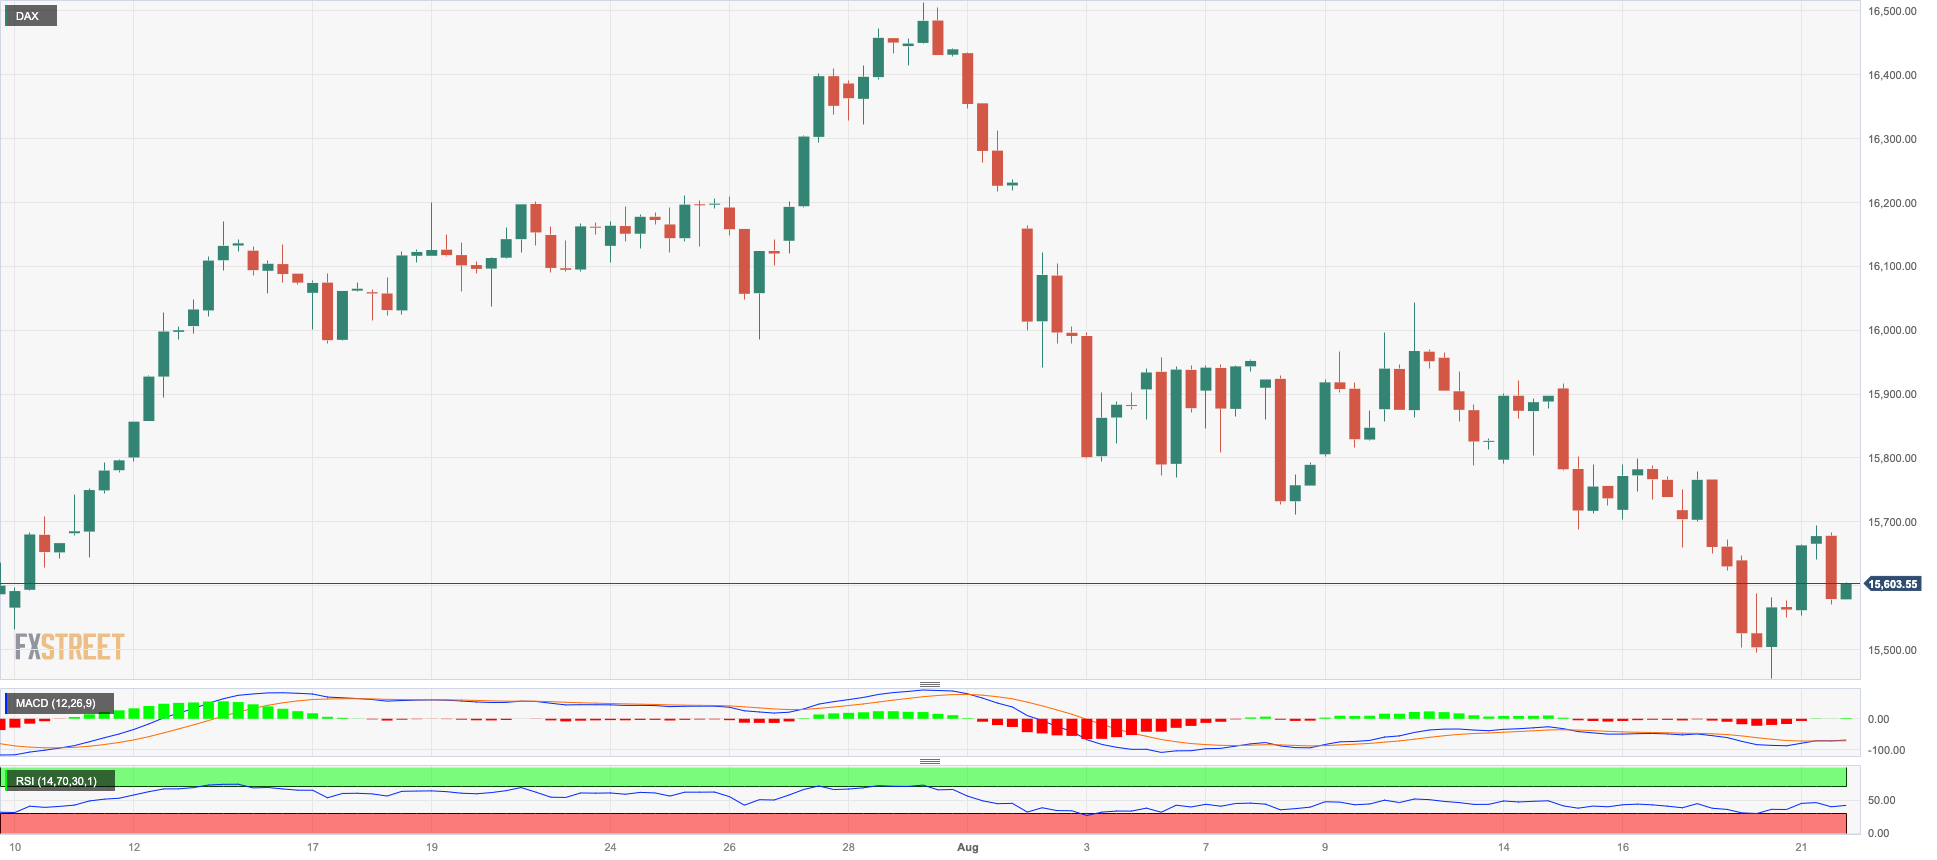
GER40
Germany’s benchmark DAX40 managed to regain balance and reverse two consecutive daily retracements on Monday, at the same time putting further distance from Friday’s multi-week lows near the 15500 region.
The better tone in the German reference emerged in response to the broad-based improvement in the commodity complex, which in turn appeared supported by another interest rate cut by the PBoC.
The daily uptick in the index came in line with the rebound in German 10-year bund yields, which regained the 2.70% zone following Friday’s marked decline.
The August low of 15468 (August 18) is barely ahead of the July low of 15456 (July 7) and the key 200-day SMA of 15379. If the DAX40 falls below this region, it may also dispute the March low of 14458 (March 20), before the December 2022 low of 13791 (December 20) and the 2022 low of 11862 (September 28). The immediate up-barrier, in the meantime, comes at the weekly high of 16060 (August 10) prior to the all-time peak of 16528 (July 31). The daily RSI ticked higher past 37.
Best Performers: Continental AG, MTU Aero, Commerzbank
Worst Performers: Vonovia, Sartorius AG VZO, Siemens Energy AG
Resistance levels: 16060 16146 16528 (4H chart)
Support levels: 15468 15456 14809 (4H chart)
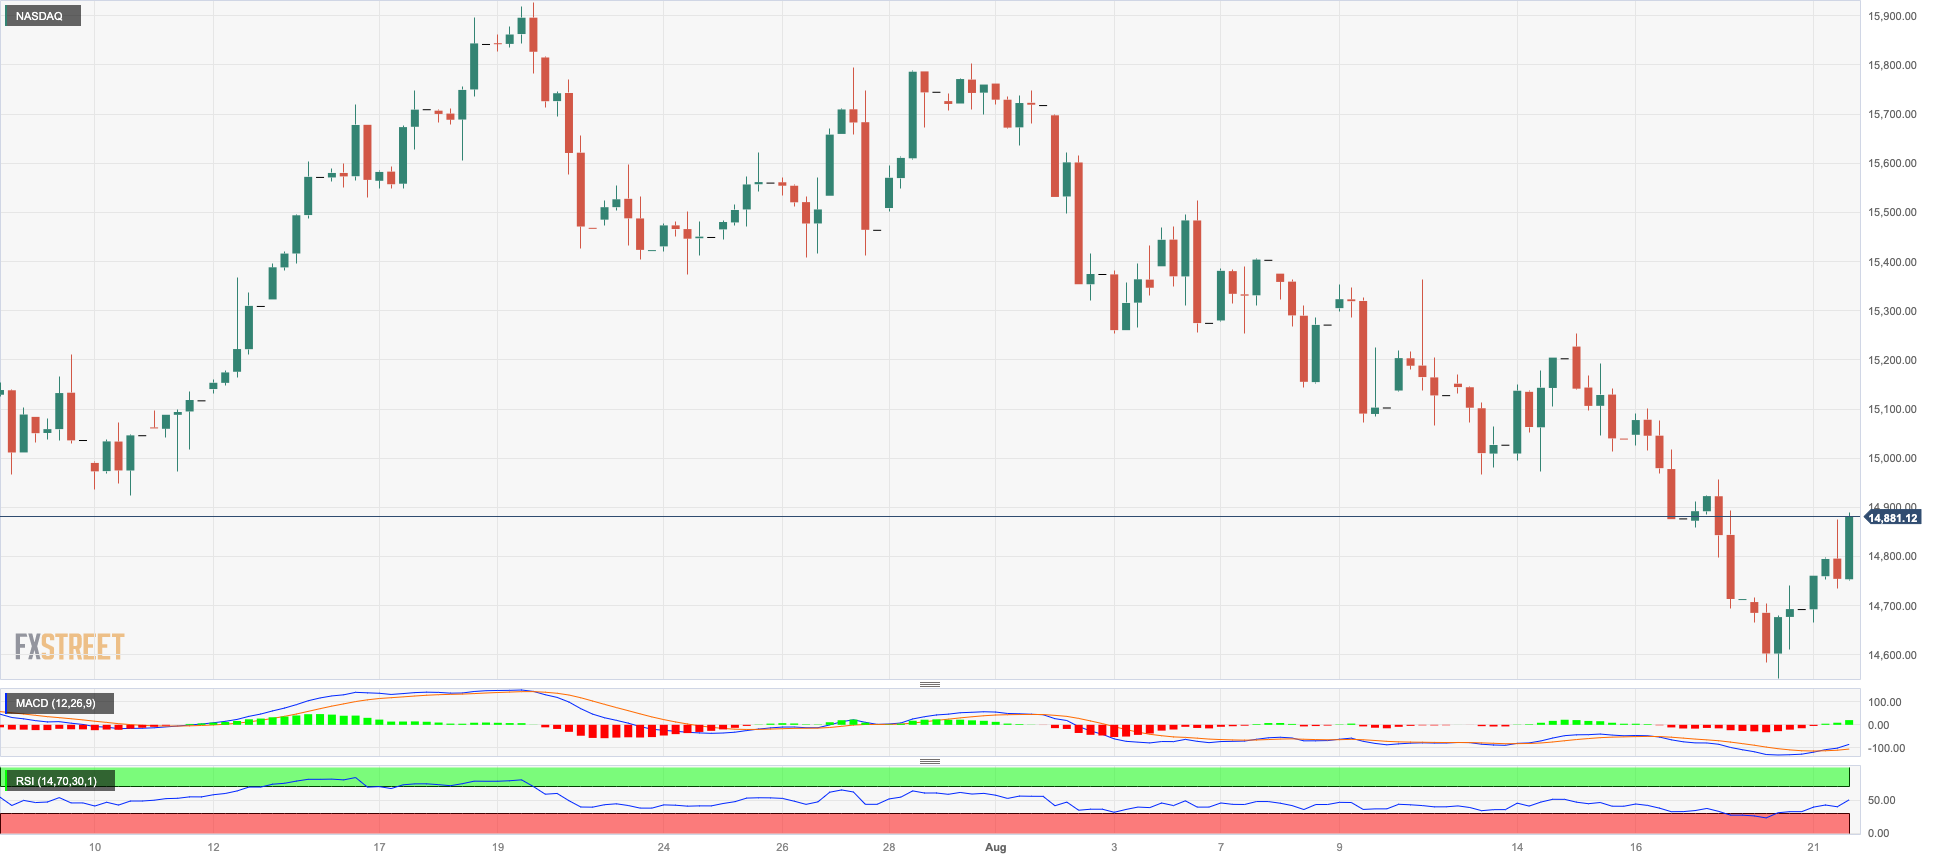
NASDAQ
Finally, some respite from the selling pressure in the US tech sector.
Indeed, the Nasdaq 100 made a U-turn and left behind four straight sessions of losses at the beginning of the week.
The move came amidst further weakening of the dollar and extra gains in US yields across the curve, while investors continued to adjust to the likelihood that the Fed might extend its current restrictive stance further than consensus initially thought.
Later in the week, that view is expected to be confirmed once again at the Jackson Hole Symposium.
The Nasdaq 100 is presently looking for its next downward target at the August low of 14557 (August 18), prior to the weekly low of 14283 (June 7). Following that, we have the weekly low of 13520 (May 24), the 200-day SMA at 13057, and the April low of 12724 (April 25). On the upside, the weekly top of 15803 (July 31) stands in the way of the 2023 peak of 15932 (July 19) and the round level of 16000. The day-to-day RSI has leapt past the 40 yardstick.
Top Gainers: Palo Alto Networks, Moderna, NVIDIA
Top Losers: Sirius XM, Warner Bros Discovery, Dollar Tree
Resistance levels: 15128 15803 15932 (4H chart)
Support levels: 14557 14293 13520 (4H chart)
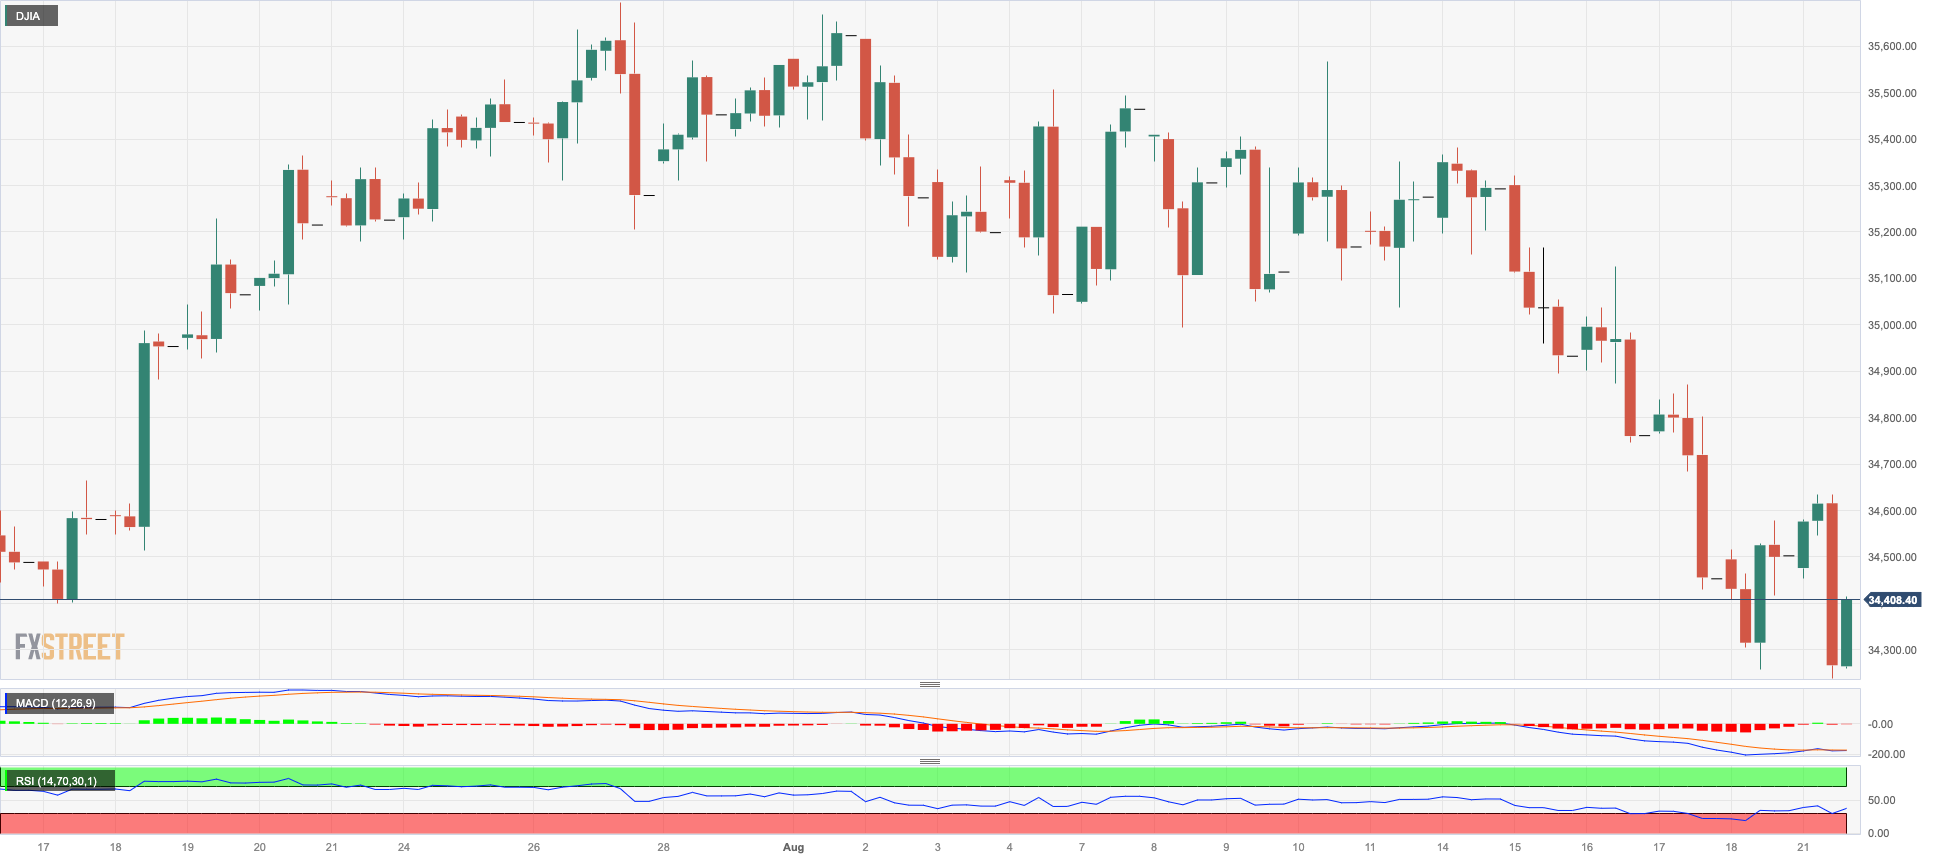
DOW JONES
US equities tracked by the Dow Jones started the week on the back foot and resumed the downside following Friday’s decent bounce.
The risk space initially received support from the interest rate cut by the PBoC. However, as the Jackson Hole Symposium approached in the second half of the week, rising prudence among market participants caused that initial positive sentiment to later succumb.
Meanwhile, investors maintained a cautious stance due to increasing speculation that the Federal Reserve may maintain a more stringent monetary policy for an extended duration. This viewpoint is supported by the resilient state of the economy and persistent elevated consumer prices.
All in all, the Dow Jones retreated 0.31% to 34393, the S&P500 gained 0.21% to 4378, and the tech-focused Nasdaq Composite rose 0.93% to 13415.
If the Dow Jones continues to fall, the interim 100-day SMA at 34061 could be targeted again. A deeper correction will hit the July low of 33705 (July 10), a region underpinned by the 200-day SMA at 33695. If the latter is broken, the May low of 32586 (May 25) will be exposed before reaching the 2023 low of 31429 (March 15). On the contrary, immediate hurdle aligns at the 2023 high of 35679 (August 1) ahead of the February 2022 top of 35824 (February 9) and the all-time peak of 36952 (January 5, 2022). The daily RSI broke below the 38 level.
Top Performers: Microsoft, Salesforce Inc, Cisco
Worst Performers: J&J, Nike, Goldman Sachs
Resistance levels: 35124 35679 35824 (4H chart)
Support levels: 34248 34044 33705 (4H chart)
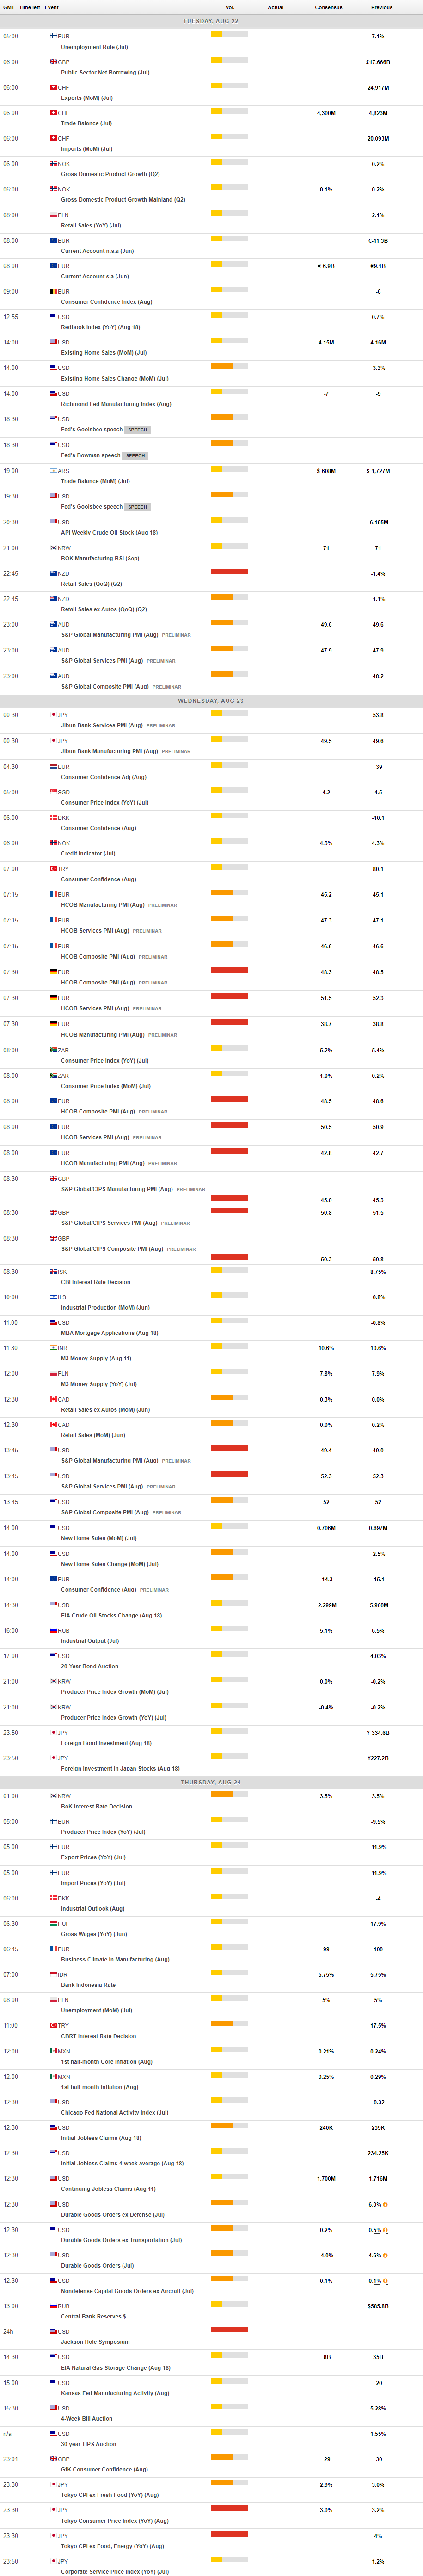
MACROECONOMIC EVENTS
All Information & Updates provided by:

All information relating to the financial markets available on this page has been prepared and issued by FXStreet (Forexstreet SL, Spain, Reg: B62498233) on the basis of publicly available information and all information believed to be reliable and does not conflict with Kuwaiti local laws, and all necessary care has been taken to before the company to ensure that the facts mentioned are correct from the source.
NCM Investment nor any of its directors or employees shall in any way be held responsible for the contents of this news, and the information contained on this page is intended only to provide clients with publicly available information and should not be construed as investment advice, report or analysis and/or constitute an offer or invitation to buy or sell financial instruments of any kind.
RISK WARNING: Forex and CFDs are highly risky leveraged products, as losses can exceed deposits. Please ensure you understand all the risks and take independent advice if necessary. NCM will segregate the clients based on the criteria of the regulator and its bylaws. NCM does not provide any advisory service; the material published does not constitute advice or a recommendation for a transaction in any financial instrument. NCM accepts no responsibility for any use of the content presented and any consequences of that use. Anyone acting on the information provided does so at their own risk.