
- Contact Us:
-

-

-

-


Daily Market Updates
23 Aug 2023
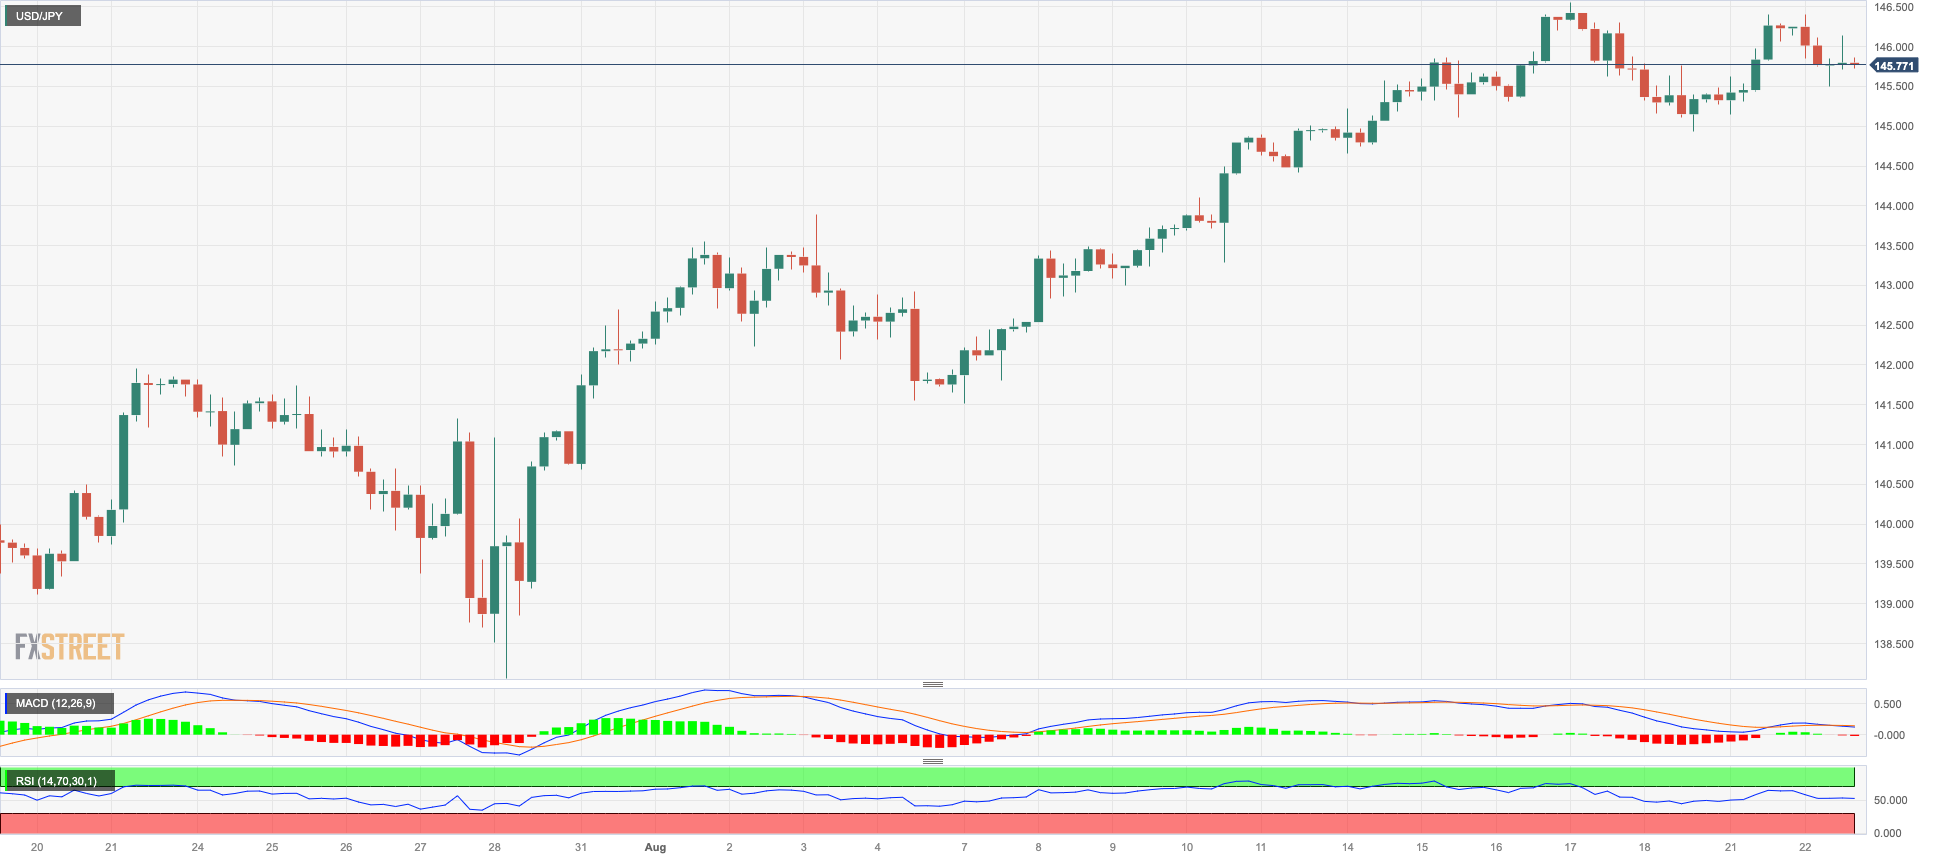
USDJPY
USD/JPY came under pressure soon after flirting with weekly tops around 146.40 on Tuesday.
The daily loss in spot came despite the recovery in the greenback and the continuation of the march north in US yields across the curve, with the short end surpassing the 5.0% mark and the belly navigating multi-year peaks past 4.35%.
The appreciation of the Japanese yen seems to have followed the move higher in the key JGB 10-year reference, which approached the 0.70% zone for the first time since January 2014.
Higher US yields across the curve vs. the somewhat consolidative mood in JGB 10-year yields lent support to the upside bias in the pair despite the corrective move in the buck.
The next salient event in the Japanese calendar will be the publication of advanced PMIs on Wednesday.
The 2023 high at 146.56 (August 17) comes next on the upside for USD/JPY, followed by the 2022 top at 151.94 (October 21). Instead, the transitory 55-day SMA at 142.28 is regarded as the immediate contender ahead of the August low at 141.50 (August 7). If this level is broken, it might lead to a move to the weekly low of 138.05 (July 28), before the July low of 137.23 (July 14) and the 200-day SMA at 136.57. A further decline might put the weekly low of 133.01 (April 26) at risk, as well as the minor level of 132.01 (April 13) and the April low of 130.62 (April 5). The daily RSI broke below the 65 yardstick.
Resistance levels: 146.56 146.79 147.56 (4H chart)
Support levels: 144.92 143.25 142.23 (4H chart)
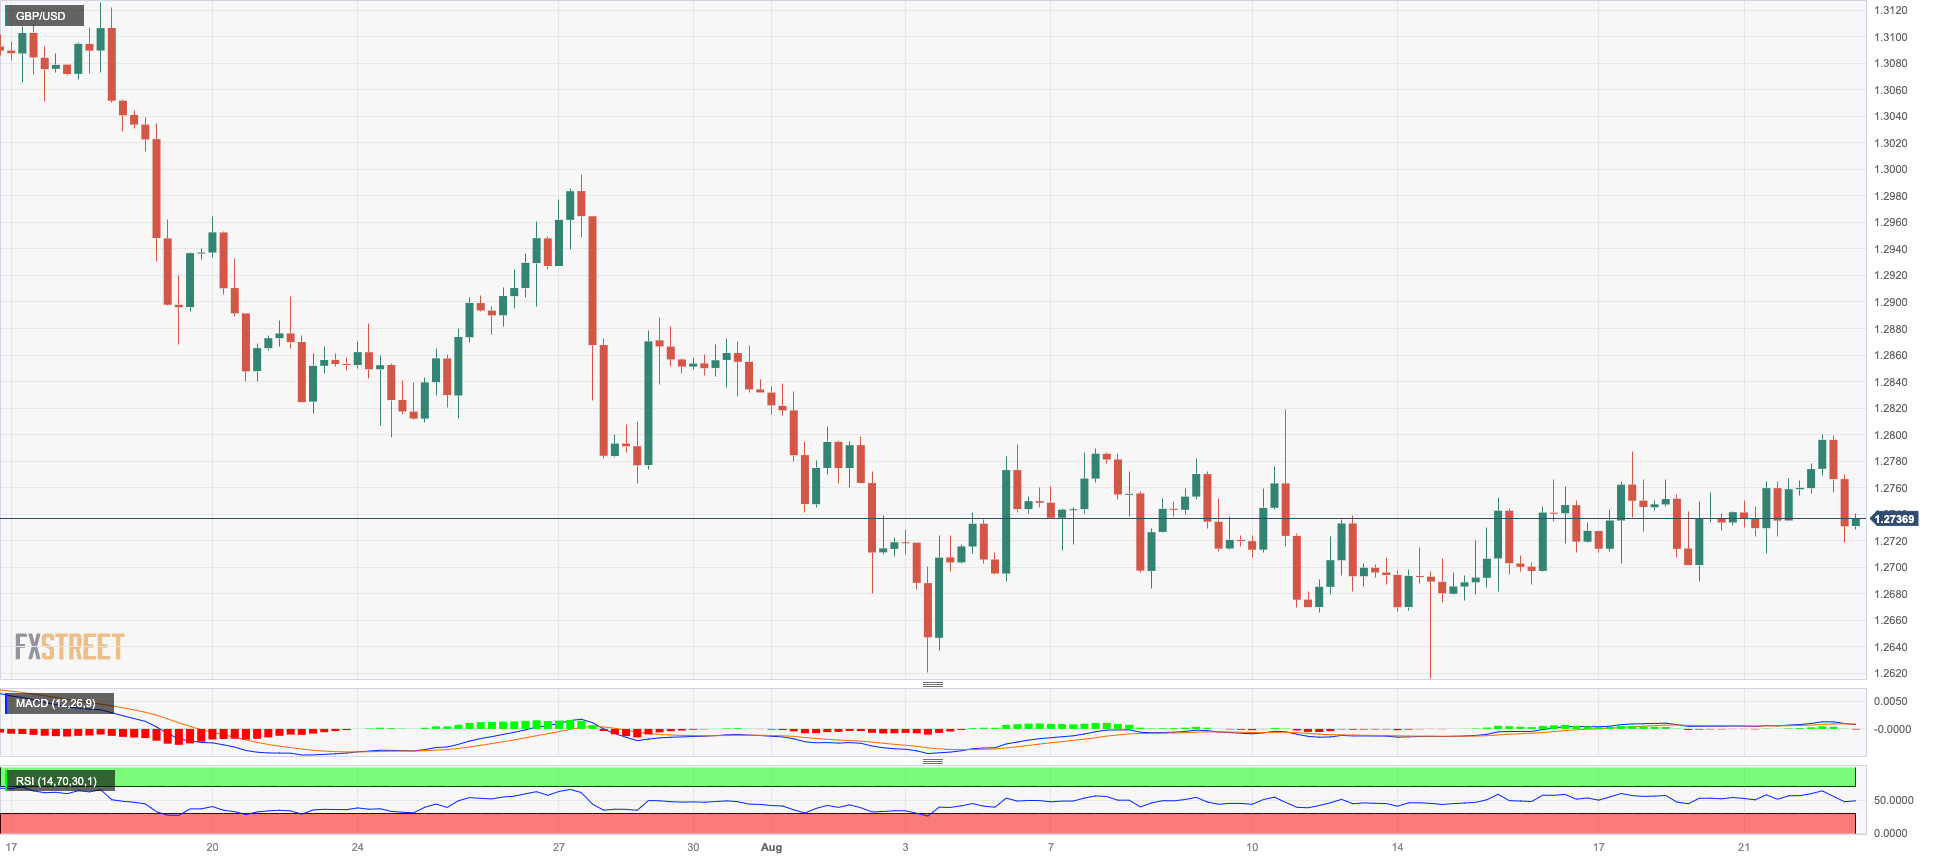
GBPUSD
The dollar’s reversal put the risk complex under pressure and forced the sterling to give away part of the gains recorded at the beginning of the week.
That said, GBP/USD made a U-turn and came all the way down to the 1.2730/20 band after probing multi-session peaks around the 1.2800 neighbourhood earlier on turnaround Tuesday.
In the UK data space, Public Sector Net Borrowing dropped by £3.480B in July, and the CBI Industrial Trends Orders deteriorated to -15 for the current month.
Next on the upside for GBP/USD emerges the weekly high of 1.2818 (August 10), seconded by another weekly top of 1.2995 (July 27), which is just before the important barrier of 1.3000. Further up, weekly peaks of 1.3146 (14 April 2022) and 1.3298 (March 15, 2022) come into play once Cable clears the 2023 high of 1.3142 (July 14). On the downside, the provisional 100-day SMA is at 1.2632 comes first ahead of the August low of 1.2616 (August 14) and the weekly low of 1.2590 (June 29). Further down, the trend line covering 2021 to 2023 near 1.2460 becomes crucial before the 200-day line SMA at 1.2386 and the June low of 1.2368 (June 5). If this zone is breached, the May low of 1.2308 (May 25) could be exposed. The RSI on the daily chart slipped back to the 47 area.
Resistance levels: 1.2800 1.2818 1.2888 (4H chart)
Support levels: 1.2689 1.2616 1.2591 (4H chart)
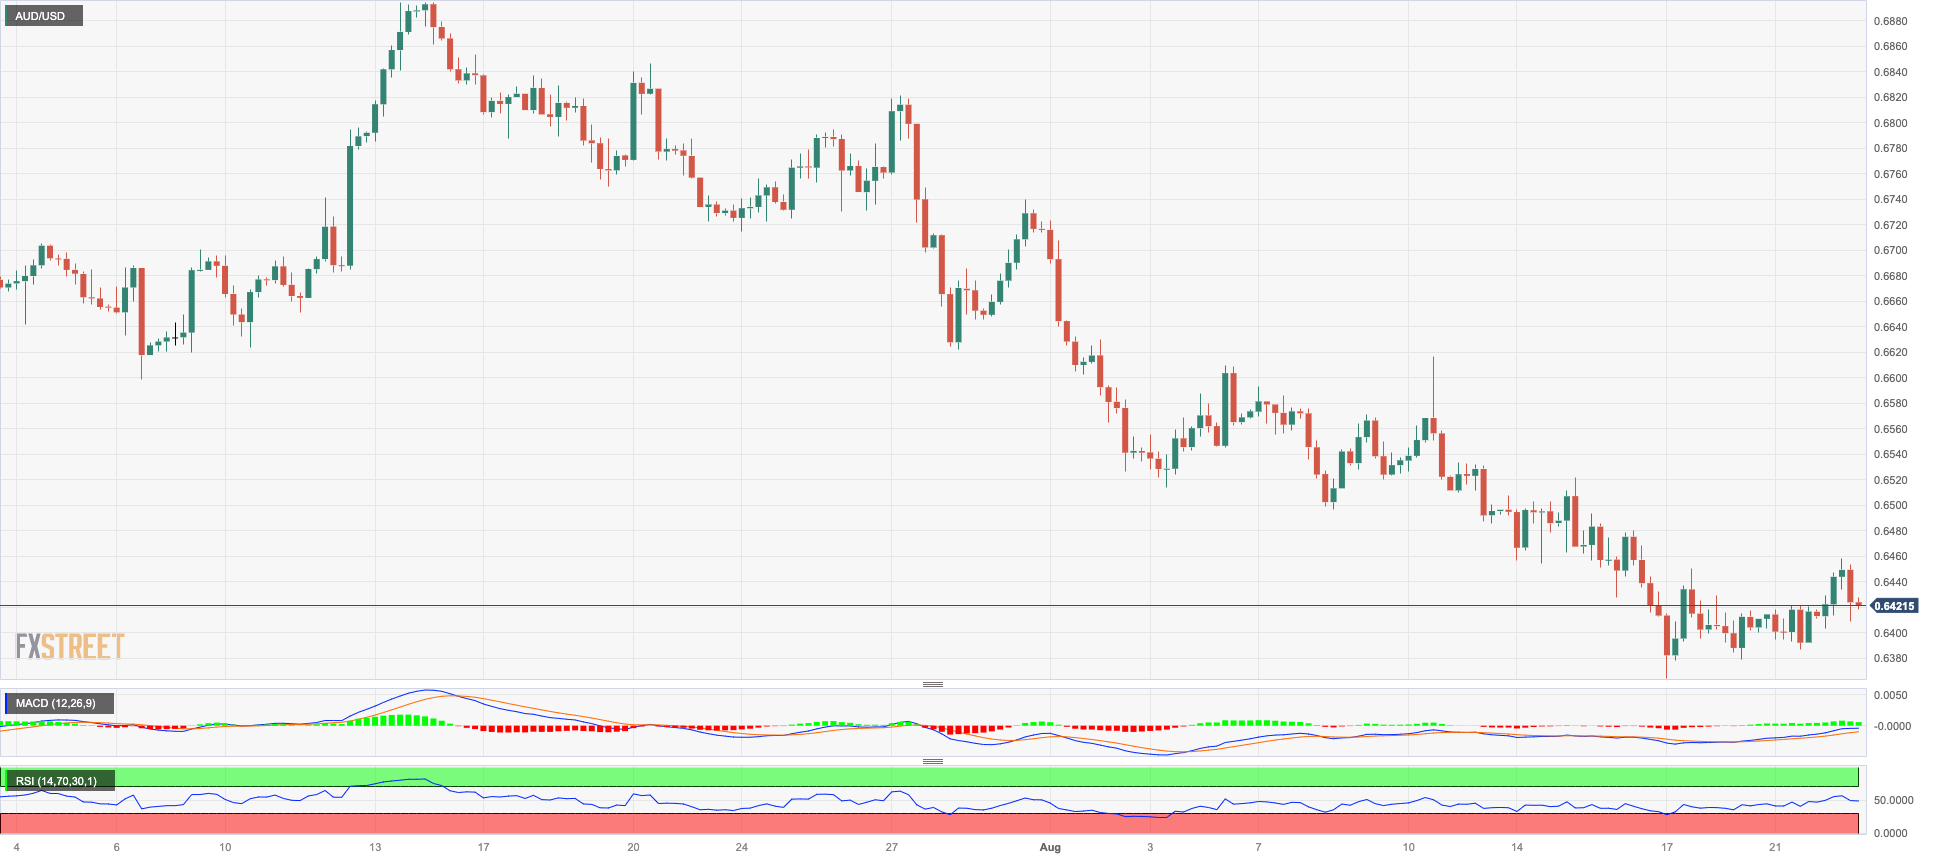
AUDUSD
Surprisingly, AUD/USD clinched the second straight session of gains and extended Monday’s small rebound to the mid-0.6400s on Tuesday, although that initial strength ran out of steam as the session progressed.
Once again, the strong bounce in the greenback weighed on the risk complex and prompted risky assets to give away gains and recede further, although the broad-based (China-driven?) improvement in the commodity universe seems to have lent fresh oxygen to the beleaguered Aussie dollar.
Next on the Australian docket will be the release of flash PMIs for the month of August (Wednesday).
Despite the so far weekly rebound, AUD/USD remains under pressure. Against that backdrop, the next support of note emerges at the 2023 low of 0.6364 (August 17) prior to the November 2022 low at 0.6272 (November 7) and the 2022 low at 0.6179 (October 13). On the flip side, initial resistance is seen at the weekly high of 0.6616 (August 10) ahead of the 0.6660/65 band, where the preliminary 55-day and 100-day SMAs coincide. Once above this area, the pair could test the 200-day SMA at 0.6729 before the July top of 0.6894 (July 14) and the June peak of 0.6899 (June 16). North of this, the important threshold of 0.7000 is ahead of the weekly high of 0.7029 (February 14) and the 2023 top of 0.7157 (February 2). On the daily chart, the RSI came out of the oversold zone at 31.
Resistance levels: 0.6521 0.6616 0.6633 (4H chart)
Support levels: 0.6364 0.6272 0.6210 (4H chart)
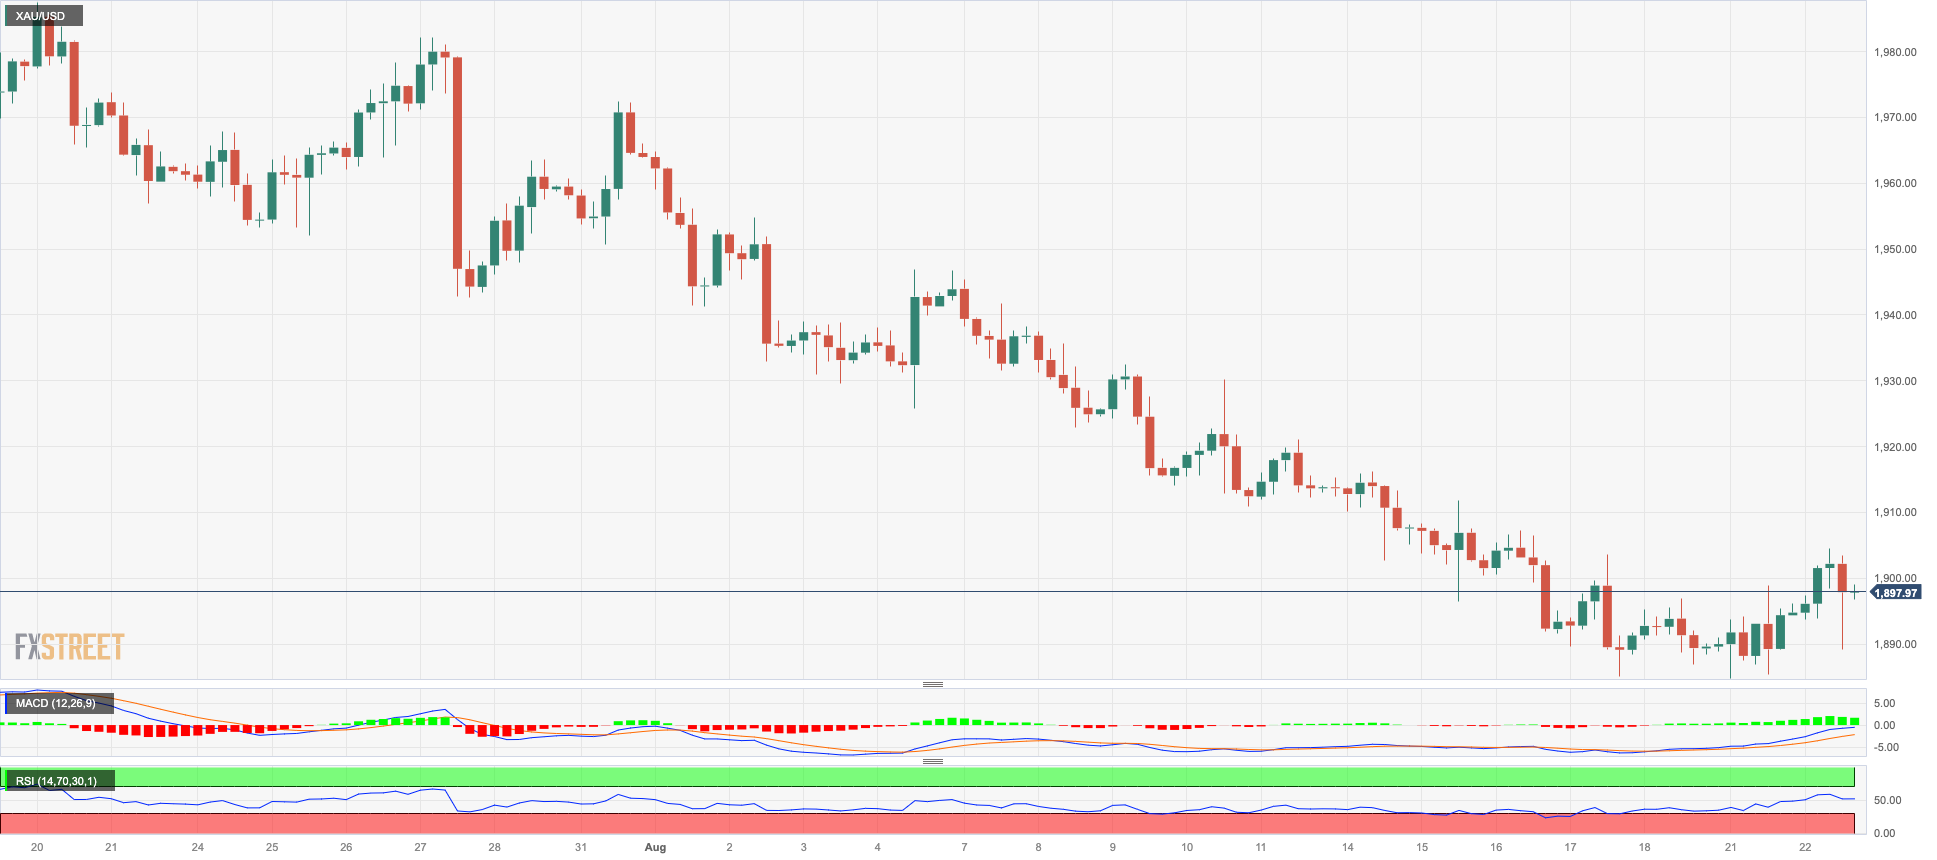
GOLD
Prices of the yellow metal reversed two consecutive sessions of gains and returned to the $1890 region per troy ounce after the initial surpass of the key $1900 mark lacked follow-through.
In fact, bullion succumbed to the strong reversal in the greenback, while the relentless move higher in US yields across the curve also favoured the daily decline on Tuesday.
Looking ahead, there is anticipation that the precious metal will continue to be closely examined in the lead-up to the Jackson Hole Symposium and the address by Chair J. Powell (Thursday and Friday).
On August 21, the gold price hit a new monthly low of $1884. If this level is breached, the door might be opened to the 2023 low of $1804 (February 28), which is just above the key support zone of $1800. By contrast, the key 200-day SMA at $1907 stands in the way of hitting the transitory 55-day and 100-day SMAs at $1934 and $1960, respectively. Furthermore, the July high of $ 1987 is a significant barrier to surmount. After clearing the latter, the metal might ascend to the psychological level of $2000 before the 2023 high of $2067 (May 4), followed by the 2022 top of $2070 (March 8) and the all-time peak of $2075 (August 7, 2020).
Resistance levels: $1911 $1930 $1946 (4H chart)
Support levels: $1884 $1809 $1804 (4H chart)
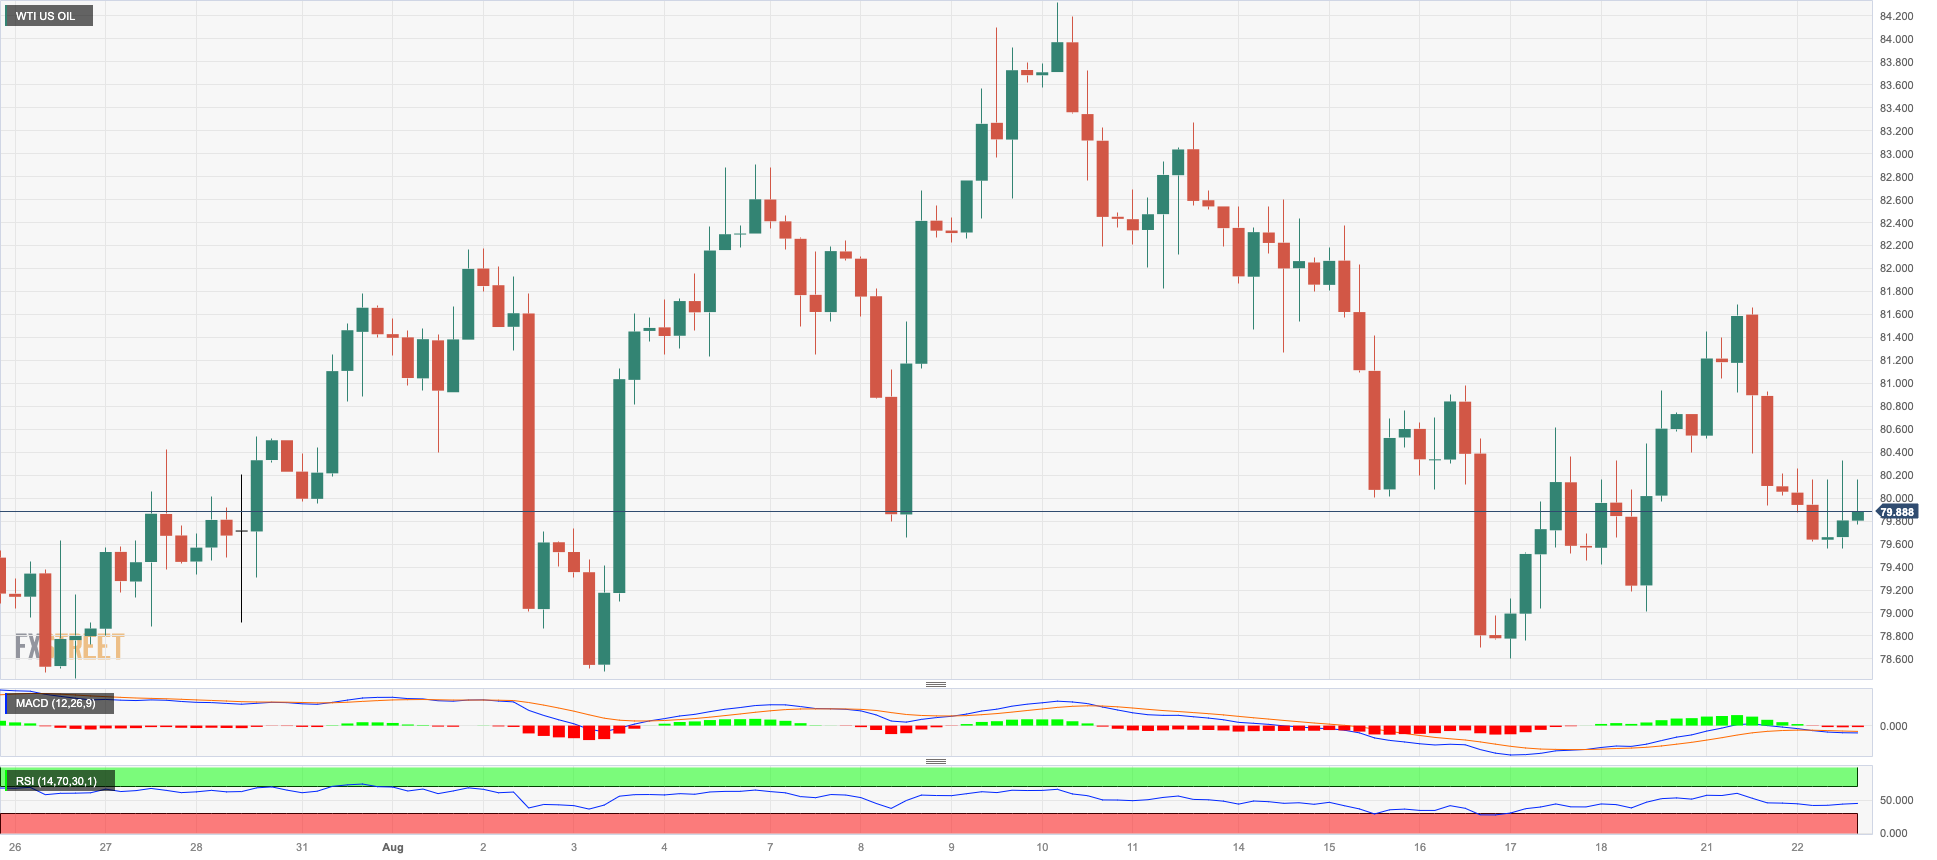
CRUDE WTI
Prices of WTI extended further the rejection from Monday’s peaks, just above the $82.00 mark per barrel on Tuesday.
In the meantime, traders’ concerns around the ability of the Chinese economy to regain significant traction continued to keep the sentiment sour, while the Iraq-Türkiye talks around the resumption of Iraq’s crude oil exports also added, albeit on the margin, to the downbeat mood.
Later in the NA session, the API will report on US crude oil supplies in the week to August 18 prior to Wednesday’s official report by the DoE.
Immediately to the upside for WTI prices might appears the 2023 high of $84.85 (August 10) before the November 2022 high of $93.73 (November 7) and the weekly high of $97.65 (August 30 2022). If selling pressure builds, WTI should find support at the August low of $78.74 (August 4) before reaching the key 200-day SMA at $76.14. The 55-day and 100-day SMAs are placed south of this at $75.60 and $75.28, respectively, and are projected to provide temporary support ahead of the weekly low of $73.89 (July 17), the June low of $66.86 (June 12), and the 2023 low of $63.61 (May 4). A deeper decline may push prices as low as the December 2021 low of $62.46 (December 2), before the critical $60.00 mark per barrel.
Resistance levels: $81.69 $83.77 $84.85 (4H chart)
Support levels: $78.92 $73.81 $72.64 (4H chart)
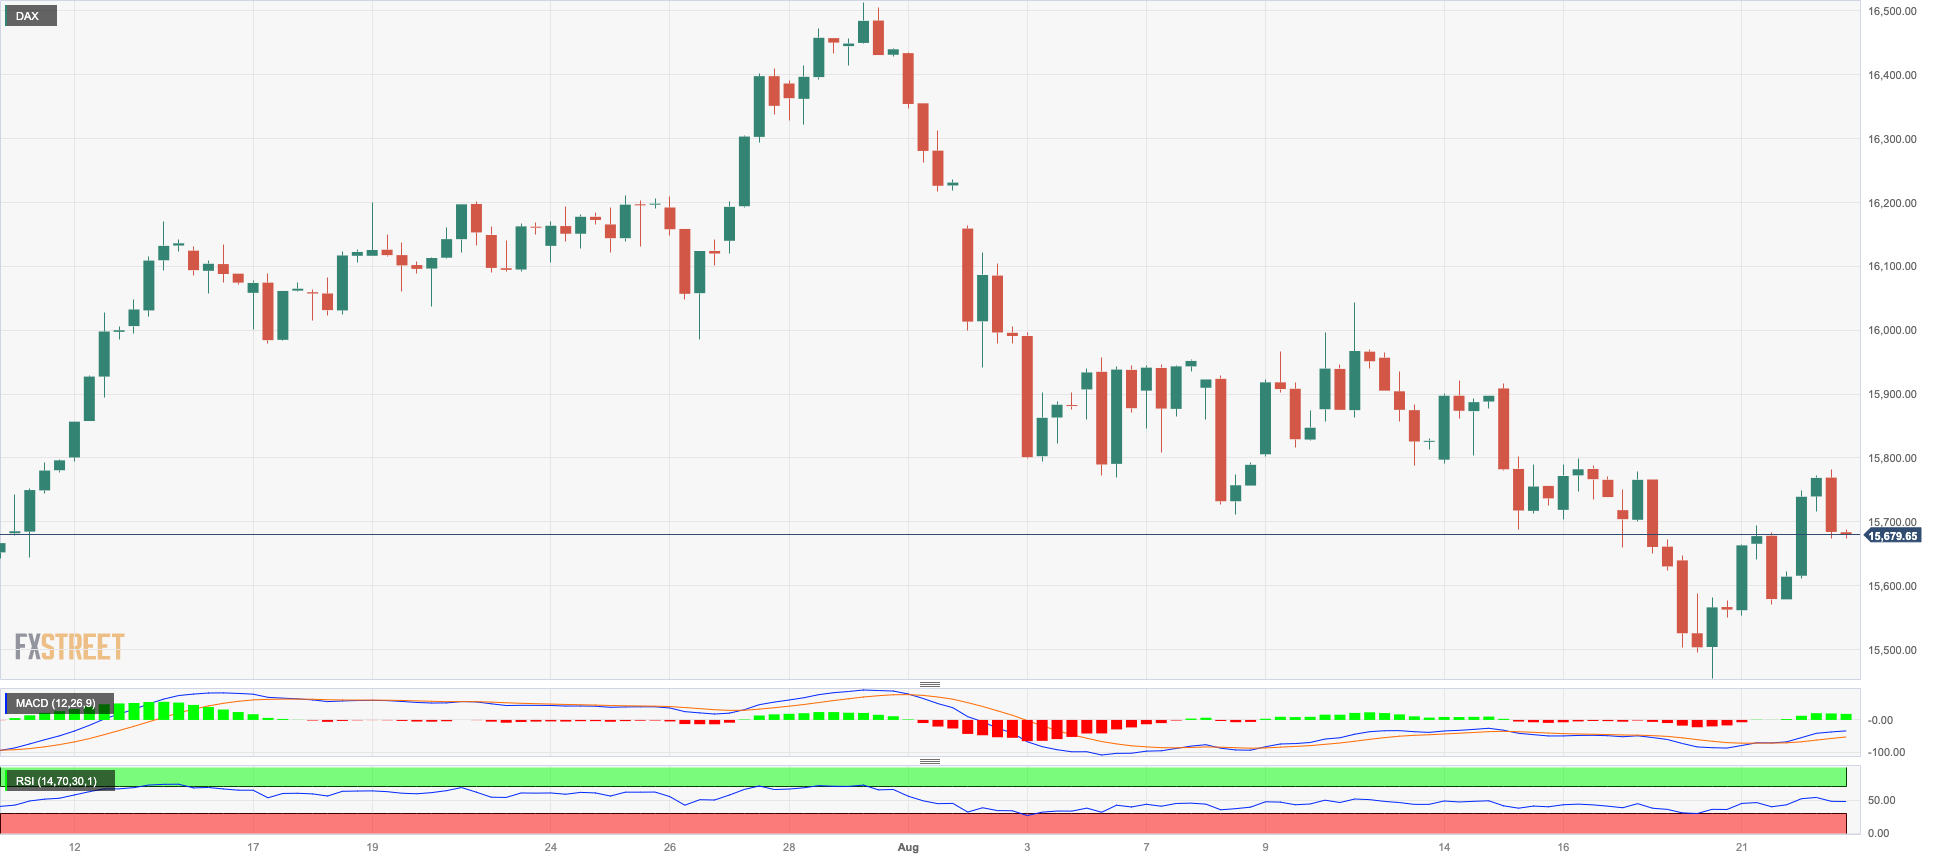
GER40
Germany's stock benchmark DAX40 continued its upward momentum on Tuesday, building on the gains from Monday and reaching multi-day highs around the 15800 region. However, towards the end of the session, the upward momentum lost some steam, resulting in the index finishing with decent gains around 15700.
The positive performance of the commodity market played a significant role in supporting the index's consecutive session of gains. Additionally, the correction in the German 10-year bund yields also appeared to contribute to the overall improvement of equities on Tuesday.
The August low of 15468 (August 18) is just slightly higher than the July low of 15456 (July 7) and the important 200-day SMA of 15389. If the DAX40 goes below this level, it may also challenge the March low of 14458 (March 20), prior to the December 2022 low of 13791 (December 20) and the 2022 bottom of 11862 (September 28). On the contrary, the weekly high of 16060 (August 10) appears reinforced by the transitory 55-day SMA (16000) and stands in the way of the all-time high of 16528. (July 31). The daily RSI leapt past 42.
Best Performers: Vonovia, Infineon, Qiagen
Worst Performers: Rheinmetall AG, Dr Ing hc F Porsche Prf, Munich Re Group
Resistance levels: 15799 16060 16528 (4H chart)
Support levels: 15468 15456 14809 (4H chart)
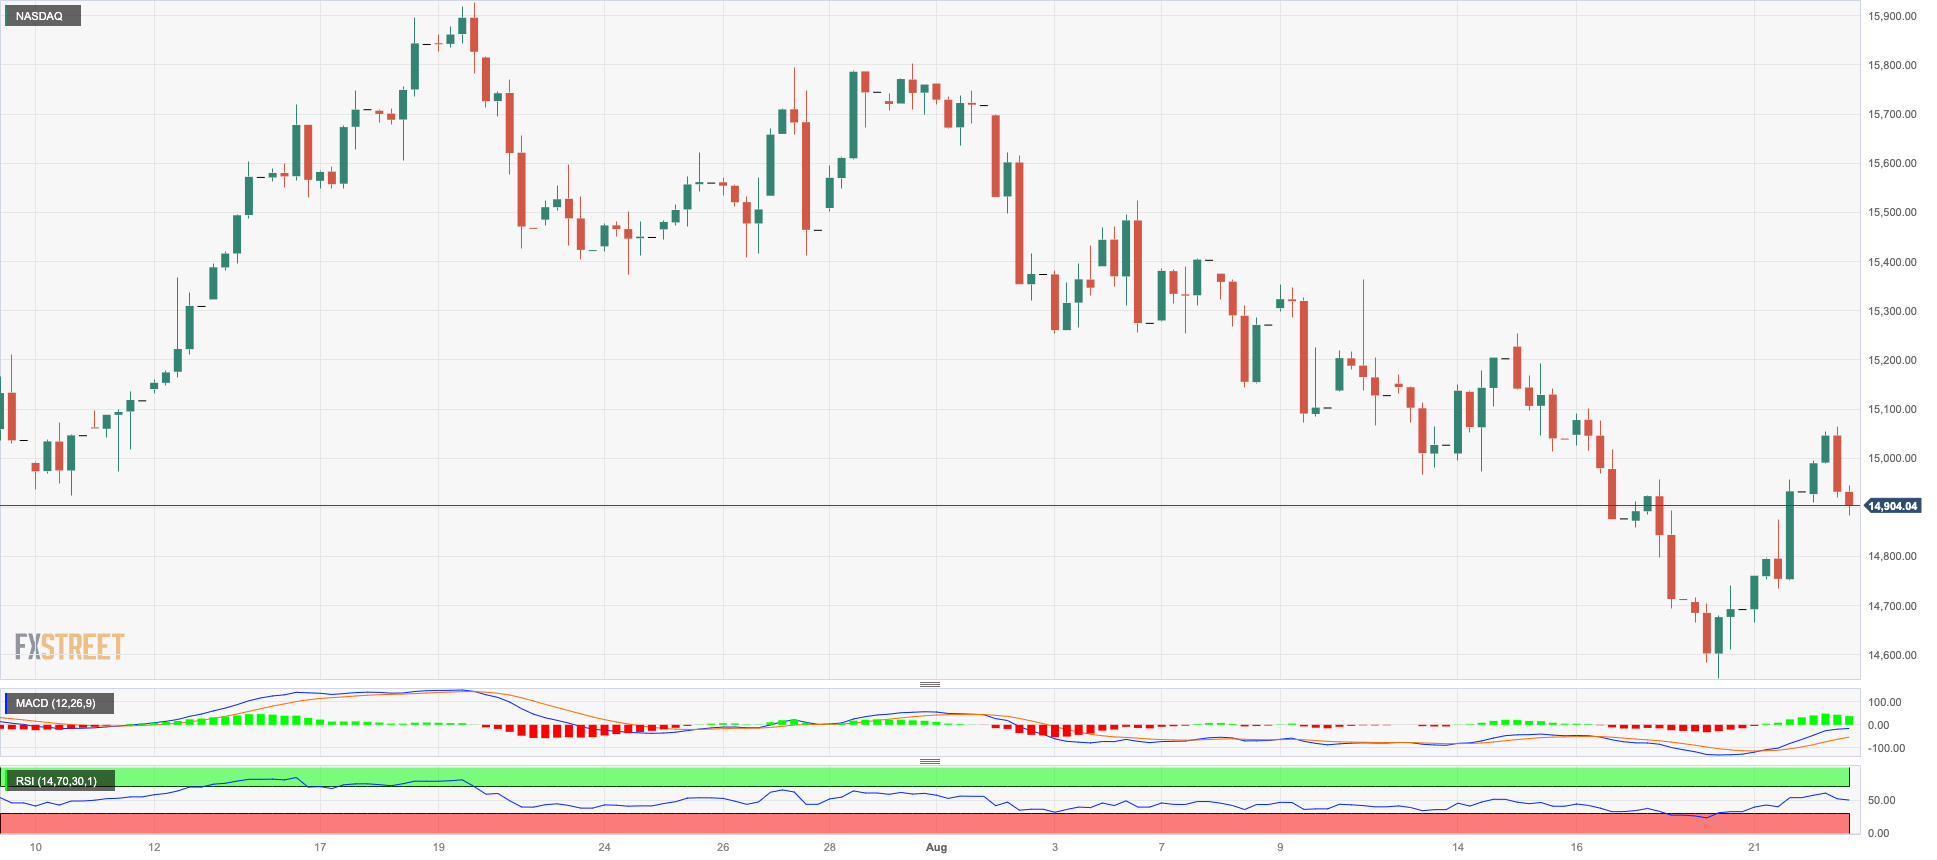
NASDAQ
US technology stocks, as represented by the Nasdaq 100 index, experienced a partial retreat on Tuesday, undoing some of the positive momentum from the start of the week and falling below the 15,000 level.
The decline in the tech index coincided with further gains in US bond yields, a stronger US dollar, and a growing perception that the Federal Reserve may maintain its current restrictive stance for a longer duration than initially anticipated.
Meanwhile, investors are expected to exercise increased caution leading up to the Jackson Hole Symposium. It is widely anticipated that Federal Reserve Chairman Powell will reaffirm the tone already observed at the latest FOMC event.
The Nasdaq 100 is currently looking for its next downside target at the August low of 14557 (August 18) prior to the weekly low of 14283 (June 7). This is followed by the weekly low of 13520 (May 24), the 200-day SMA at 13078 and the April low of 12724 (April 25). Having said that, the 55-day SMA at 15144 should offer temporary resistance ahead of the weekly high of 15803 (July 31) and the 2023 top of 15932 (July 19), all ahead of the round mark of 16000. The everyday RSI eased below 44.
Top Gainers: Atlassian Corp Plc, Moderna, Align
Top Losers: Palo Alto Networks, Lucid Group, AMD
Resistance levels: 15352 15795 15932 (4H chart)
Support levels: 14557 14293 13520 (4H chart)
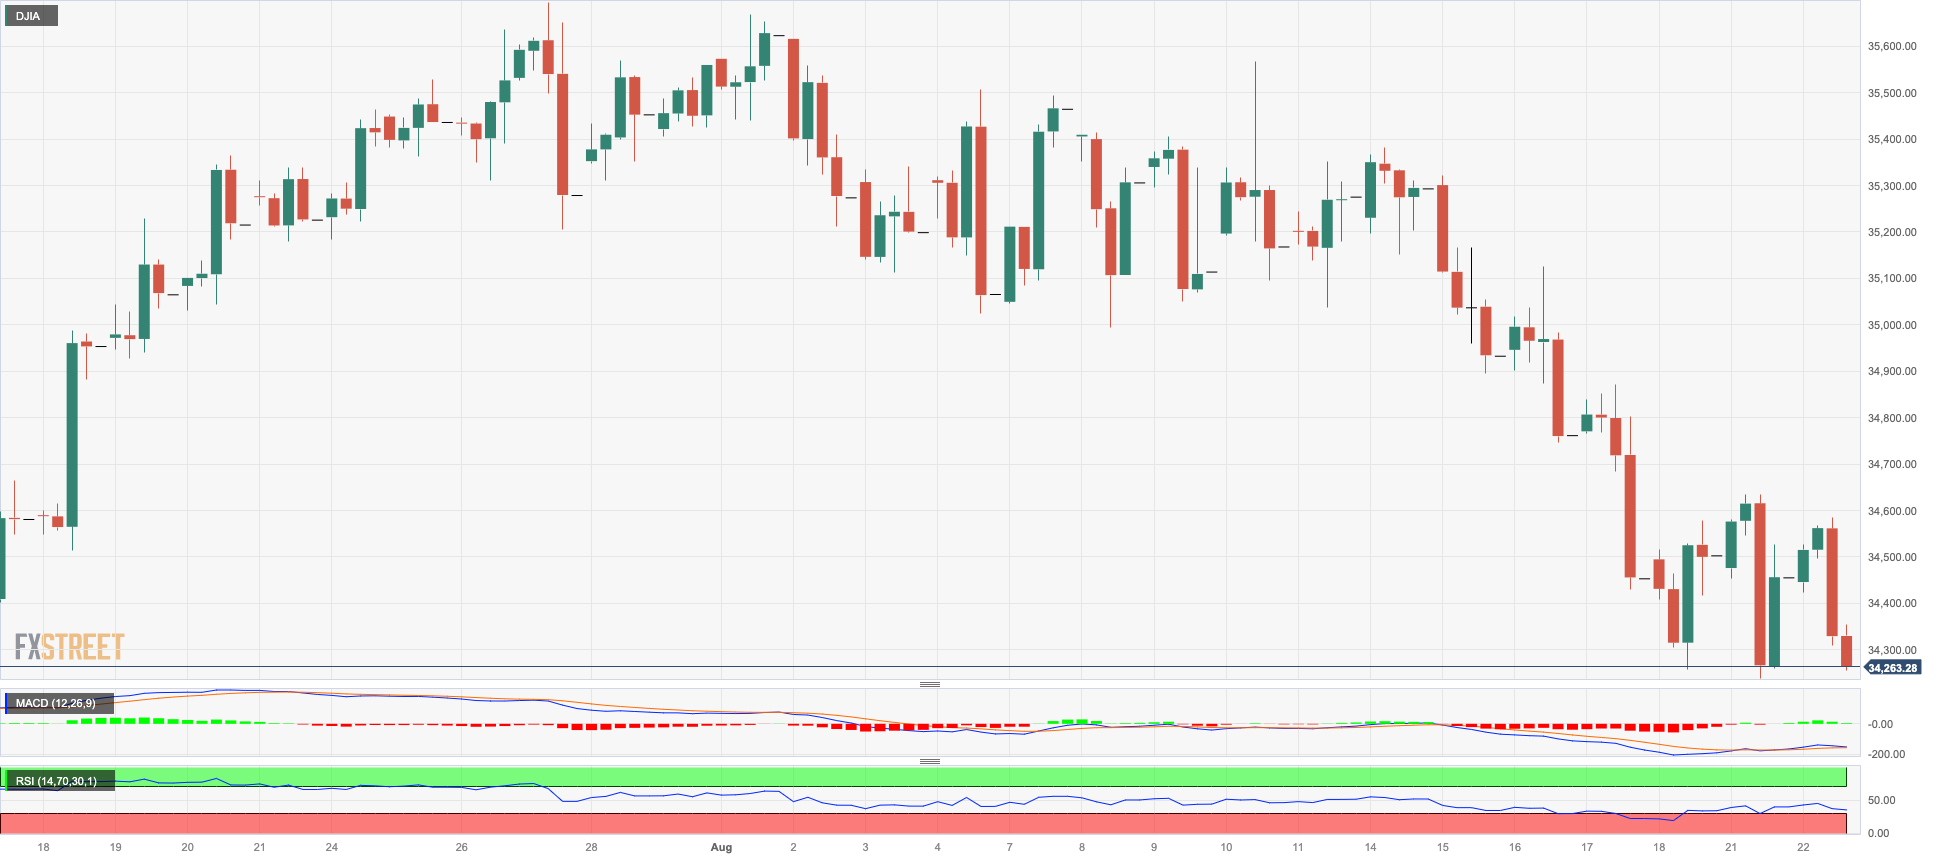
DOW JONES
US stocks gauged by the reference Dow Jones extended the pessimism seen at the beginning of the week into Tuesday's session.
In fact, investors exercised caution as they approached the upcoming Jackson Hole Symposium and Chair Powell's speech scheduled for the latter part of the week. Additionally, the rise in yields and the recovery of the greenback contributed to the prevailing selling pressure among investors.
On the whole, the Dow Jones dropped 0.54% to 34278 the S&P500 retreated 0.29% to 4387, and the tech-benchmark Nasdaq Composite advanced 0.05% to 13503.
If the Dow Jones continues to fall, the interim 100-day SMA at 34079 could be targeted again. A deeper correction will hit the July low of 33705 (July 10), a region supported by the 200-day line SMA at 33707. If the latter is broken, the May low of 32586 (May 25) will be targeted before the 2023 low of 31429 (March 15). Conversely, the immediate hurdle is the 2023 high of 35679 (August 1) prior to the February 2022 top of 35824 (February 9) and the all-time peak of 36952 (January 5, 2022). The RSI on the daily chart dropped below 38.
Top Performers: Walgreen Boots, Apple, Visa A
Worst Performers: JPMorgan, Nike, UnitedHealth
Resistance levels: 35125 35679 35824 (4H chart)
Support levels: 34248 34044 33705 (4H chart)
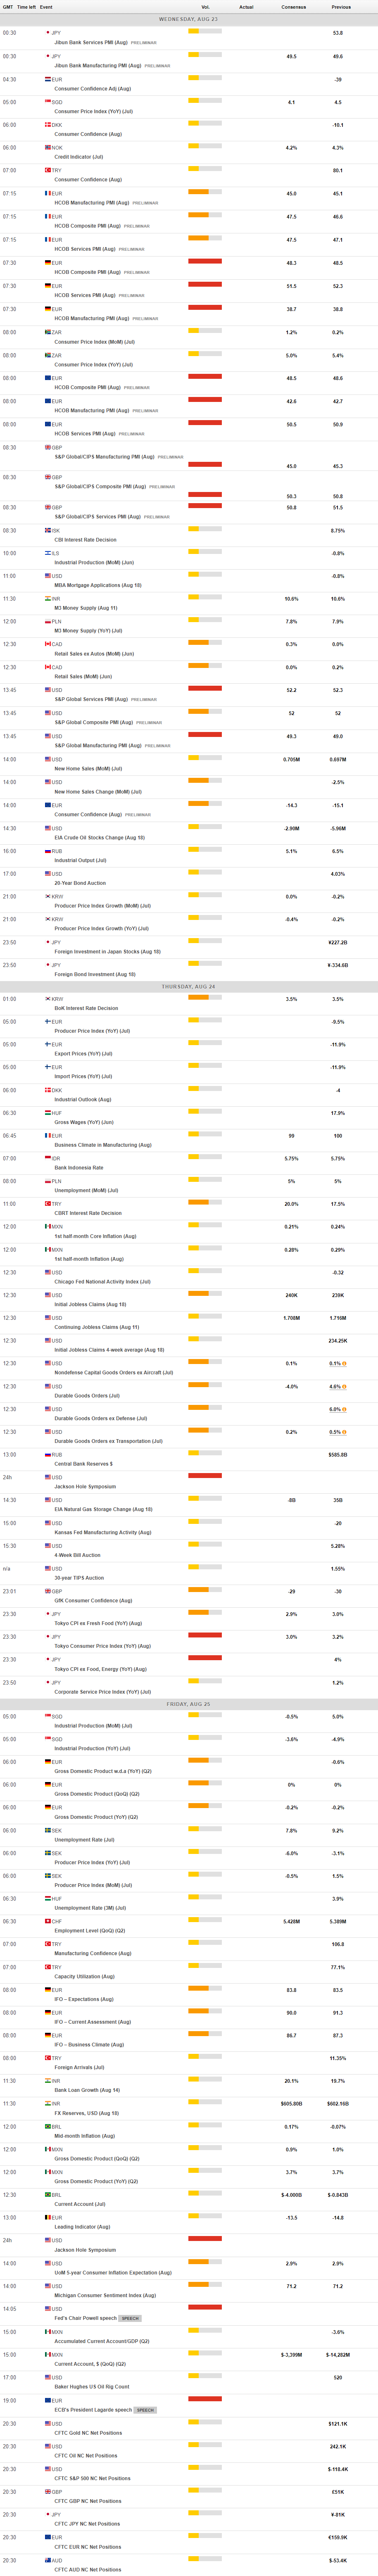
MACROECONOMIC EVENTS
All Information & Updates provided by:

All information relating to the financial markets available on this page has been prepared and issued by FXStreet (Forexstreet SL, Spain, Reg: B62498233) on the basis of publicly available information and all information believed to be reliable and does not conflict with Kuwaiti local laws, and all necessary care has been taken to before the company to ensure that the facts mentioned are correct from the source.
NCM Investment nor any of its directors or employees shall in any way be held responsible for the contents of this news, and the information contained on this page is intended only to provide clients with publicly available information and should not be construed as investment advice, report or analysis and/or constitute an offer or invitation to buy or sell financial instruments of any kind.
RISK WARNING: Forex and CFDs are highly risky leveraged products, as losses can exceed deposits. Please ensure you understand all the risks and take independent advice if necessary. NCM will segregate the clients based on the criteria of the regulator and its bylaws. NCM does not provide any advisory service; the material published does not constitute advice or a recommendation for a transaction in any financial instrument. NCM accepts no responsibility for any use of the content presented and any consequences of that use. Anyone acting on the information provided does so at their own risk.