
- Contact Us:
-

-

-

-


Daily Market Updates
24 Aug 2023
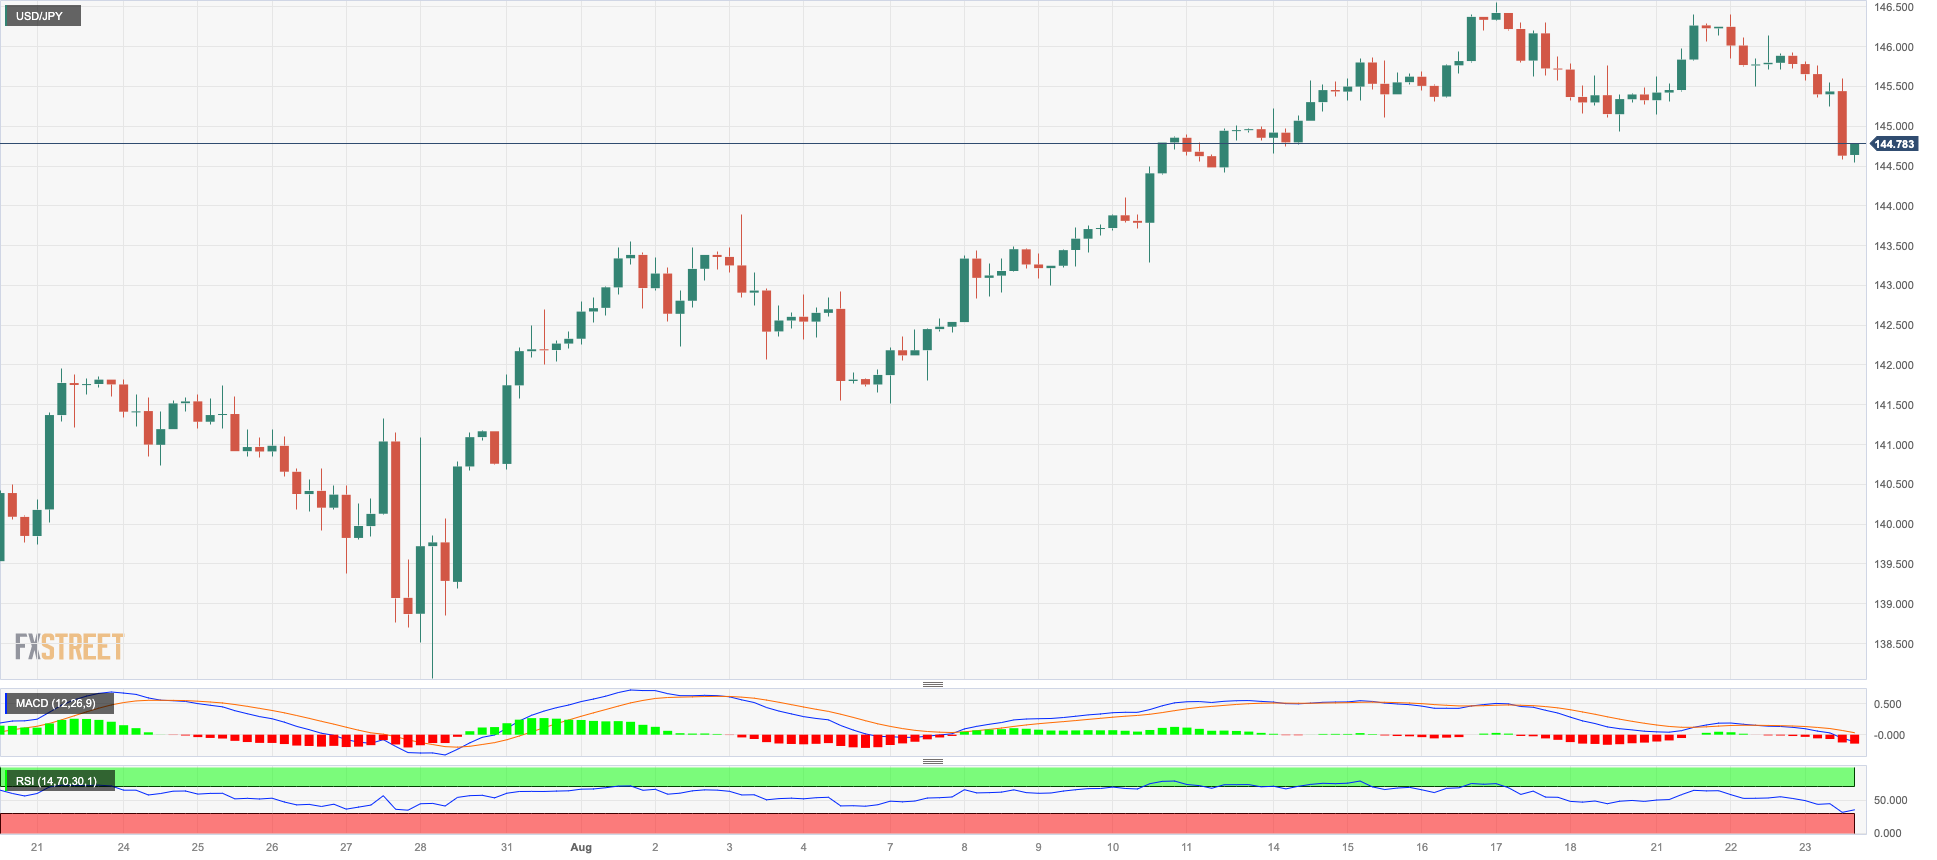
USDJPY
USD/JPY added to Tuesday’s retracement and probed the area of eight-day lows in the 144.60/55 band on Wednesday.
Further losses in spot came on the back of the corrective move in the greenback, which appeared in tandem with the marked move lower in US yields across different maturities.
By contrast, the JGB 10-year yield extended its march north for the third session in a row, this time visiting levels last traded in mid-January 2014 near 0.70%.
In Japan, the advanced Jibun Bank Manufacturing PMI surpassed estimates at 49.7 for the current month, and the Services PMI came in at 54.3.
The 2023 high at 146.56 (August 17) is the next up barrier for USD/JPY, followed by the 2022 top at 151.94 (October 21). Instead, the 55-day SMA at 142.36 is considered an immediate contender ahead of the August low at 141.50 (August 7). If this level is breached, it could lead to a decline to the weekly low at 138.05 (July 28) before reaching the July low at 137.23 (July 14) and the 200-day SMA at 136.60. A deeper pullback could put the weekly low of 133.01 (April 26) in danger, as well as the minor level of 132.01 (April 13) and the April low of 130.62 (April 5). The RSI on the daily chart deflated to the 56 area.
Resistance levels: 146.56 146.79 147.56 (4H chart)
Support levels: 144.53 143.25 142.28 (4H chart)
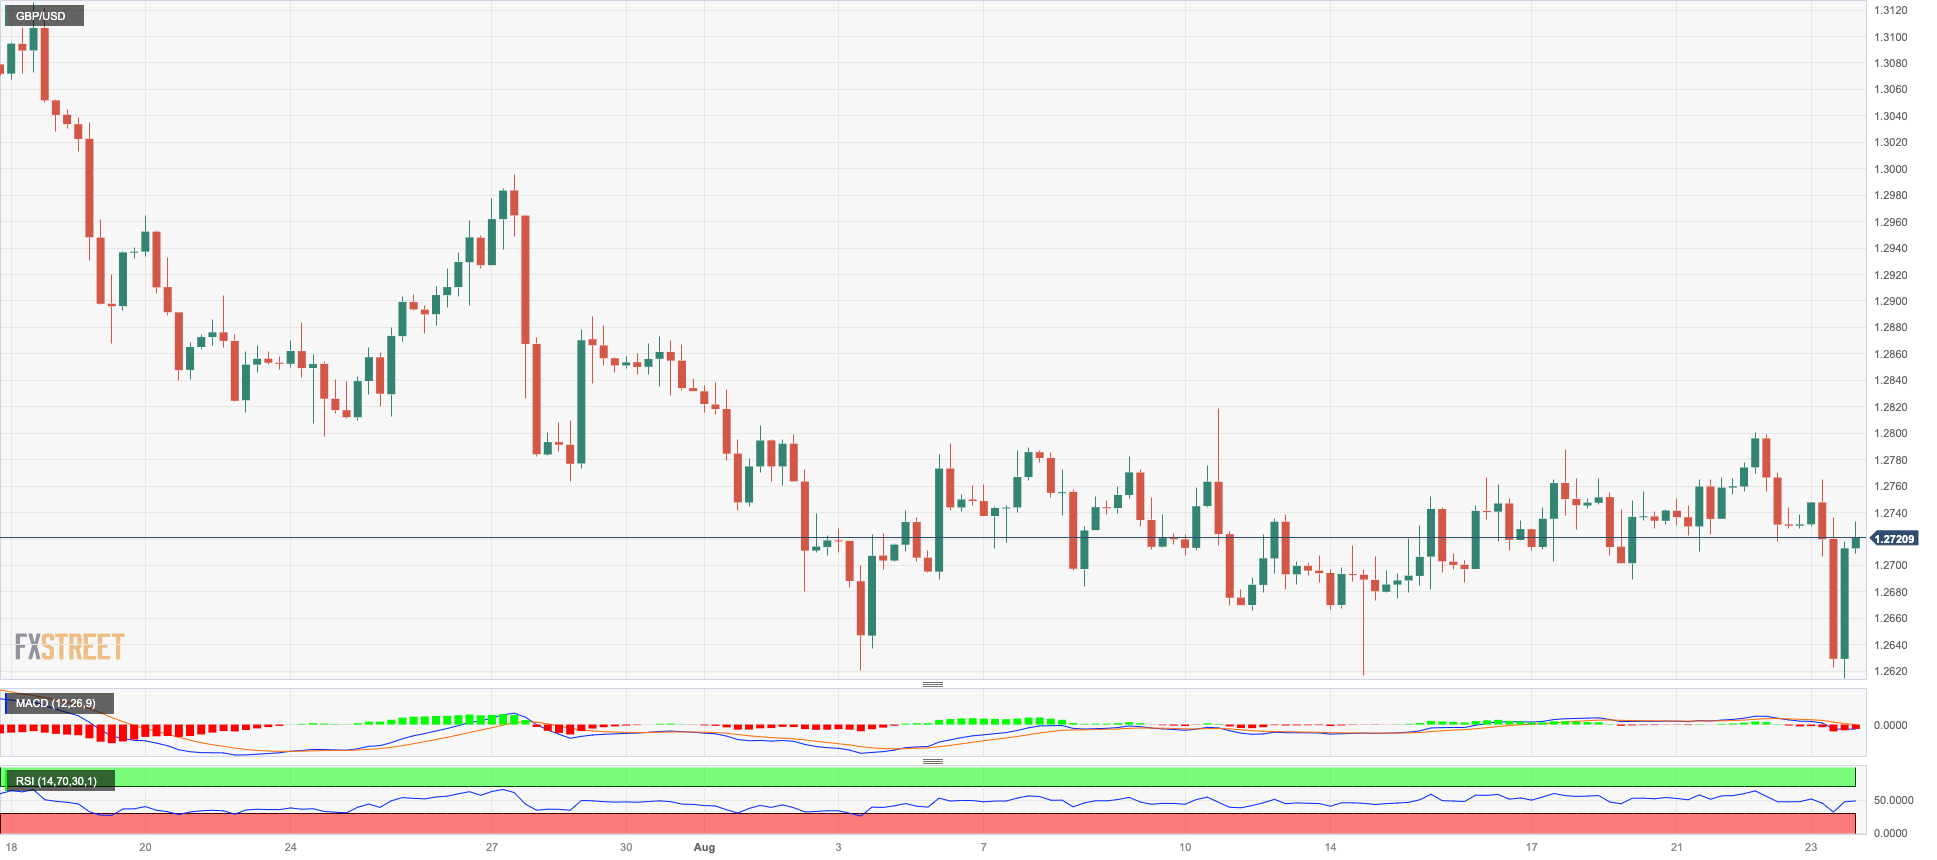
GBPUSD
GBP/USD dropped to new two-month lows to flirt with the transitory 100-day SMA near 1.2600 the figure, remaining within negative territory despite the late pullback in the greenback on Wednesday.
Cable, however, managed to trim most of the earlier losses and reclaim levels beyond the 1.2700 barrier as the USD Index (DXY) abandoned the area of multi-week highs in response to poor results from domestic fundamentals, although the poor prints from the UK calendar kept the quid on the back foot midweek.
Indeed, it was also PMI-day across the Channel. That said, the advanced Manufacturing PMI is expected at 42.5 and 48.7 when it comes to the Services print, both readings missing consensus for the month of August.
If GBP/USD breaches the August low of 1.2614 (August 23), it could then challenge the weekly low of 1.2590 (June 29) ahead of the 2021-2023 trend line around 1.2450. South from here comes the 200-day SMA at 1.2390 seconded by the June low of 1.2368 (June 5) prior to the May low of 1.2308 (May 25). On the flip side, the weekly high of 1.2818 (August 10) is followed by another weekly high of 1.2995 (July 27), which is just before the critical barrier of 1.3000. Once Cable clears the 2023 high of 1.3142 (July 14), weekly peaks of 1.3146 (April 14, 2022) and 1.3298 (March 15, 2022) become relevant. The RSI on the daily chart dropped to the 46 region.
Resistance levels: 1.2800 1.2828 1.2888 (4H chart)
Support levels: 1.2614 1.2591 1.2486 (4H chart)
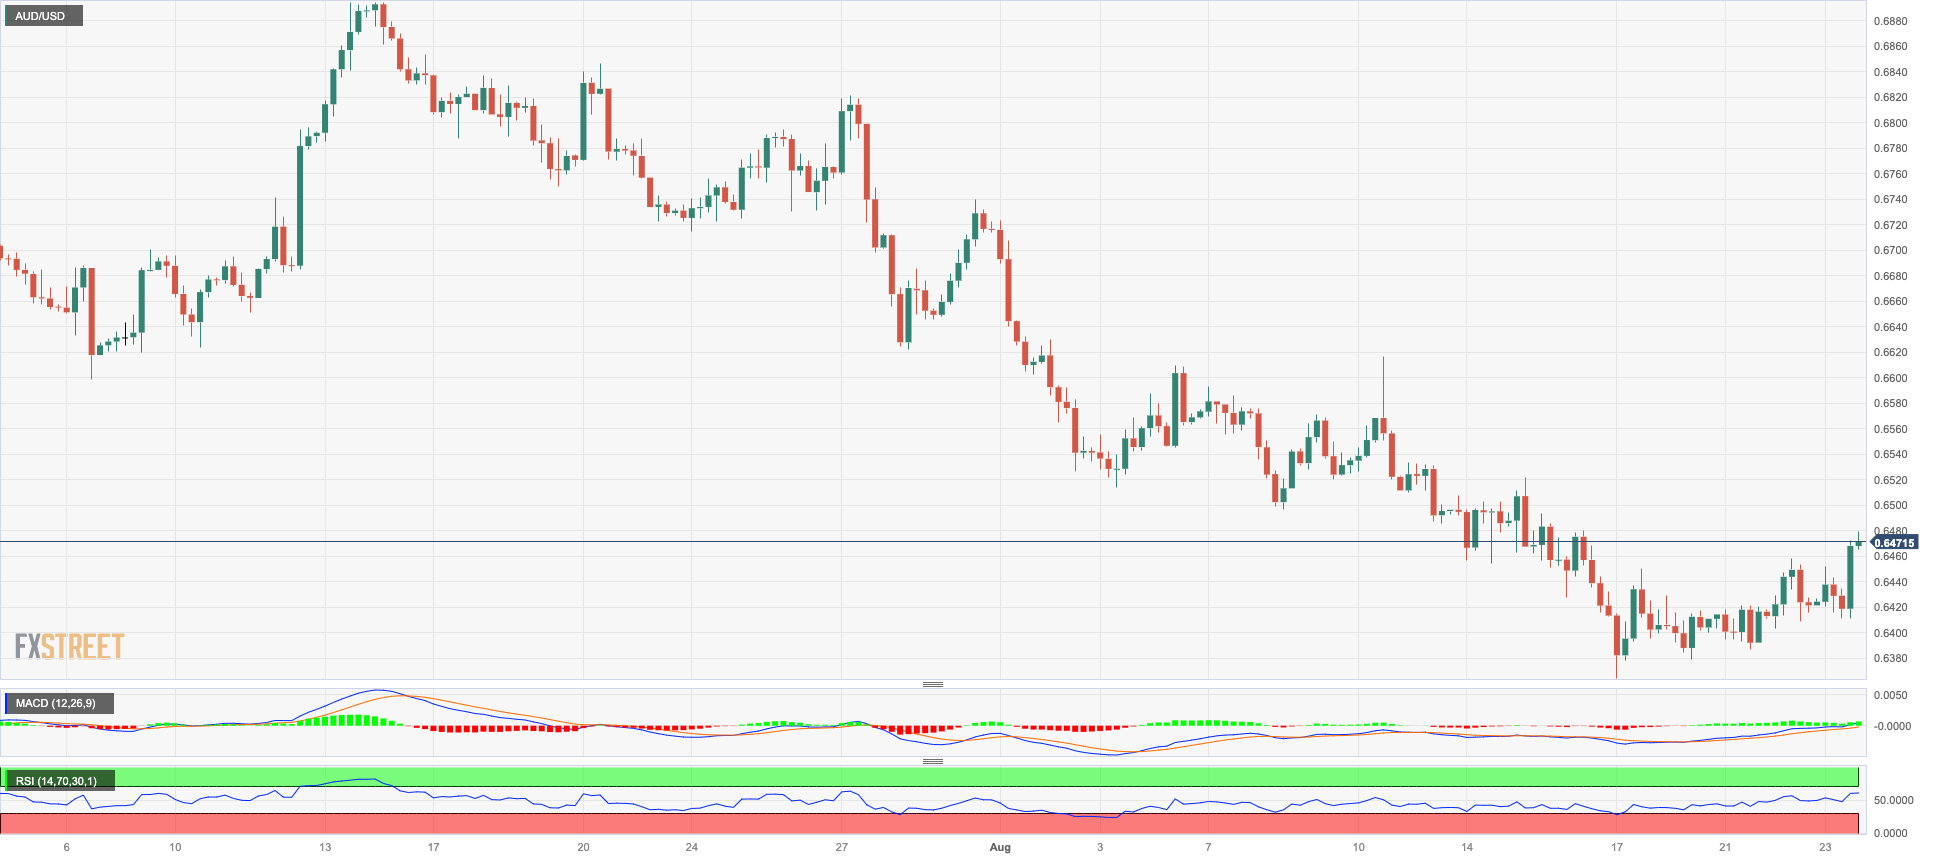
AUDUSD
Further recovery saw AUD/USD advance for the third consecutive session and revisit the 0.6470 region, or multi-day peaks, on Wednesday.
The re-emergence of the selling bias in the greenback allowed the risk complex some breathing space, while another firm session in the commodity galaxy and hopes of an economic rebound in China in the second half of the year also collaborated with the upbeat mood around the Aussie dollar midweek.
In Oz, the flash Judo Bank Manufacturing PMI is expected to be 49.4 for the month of August and 46.7 when it comes to the Services sector.
Despite the week's thus far comeback, the AUD/USD remains under pressure. Against this backdrop, the next significant support is at the 2023 low of 0.6364 (August 17), followed by the November 2022 low of 0.6272 (November 7) and the 2022 low of 0.6179 (October 13). On the other hand, there is an initial barrier at the weekly high of 0.6616 (August 10) prior to the 0.6660 region, where the provisional 100-day and 55-day SMAs coincide. Once above this region, the pair might challenge the 200-day SMA at 0.6728 before the July high of 0.6894 (July 14) and the June peak of 0.6899 (June 16). The crucial level of 0.7000 is ahead of the weekly high of 0.7029 (February 14) and the 2023 high of 0.7157 (February 2). On the daily chart, the RSI regained the 40 mark and beyond.
Resistance levels: 0.6479 0.6521 0.6616 (4H chart)
Support levels: 0.6364 0.6272 0.6210 (4H chart)
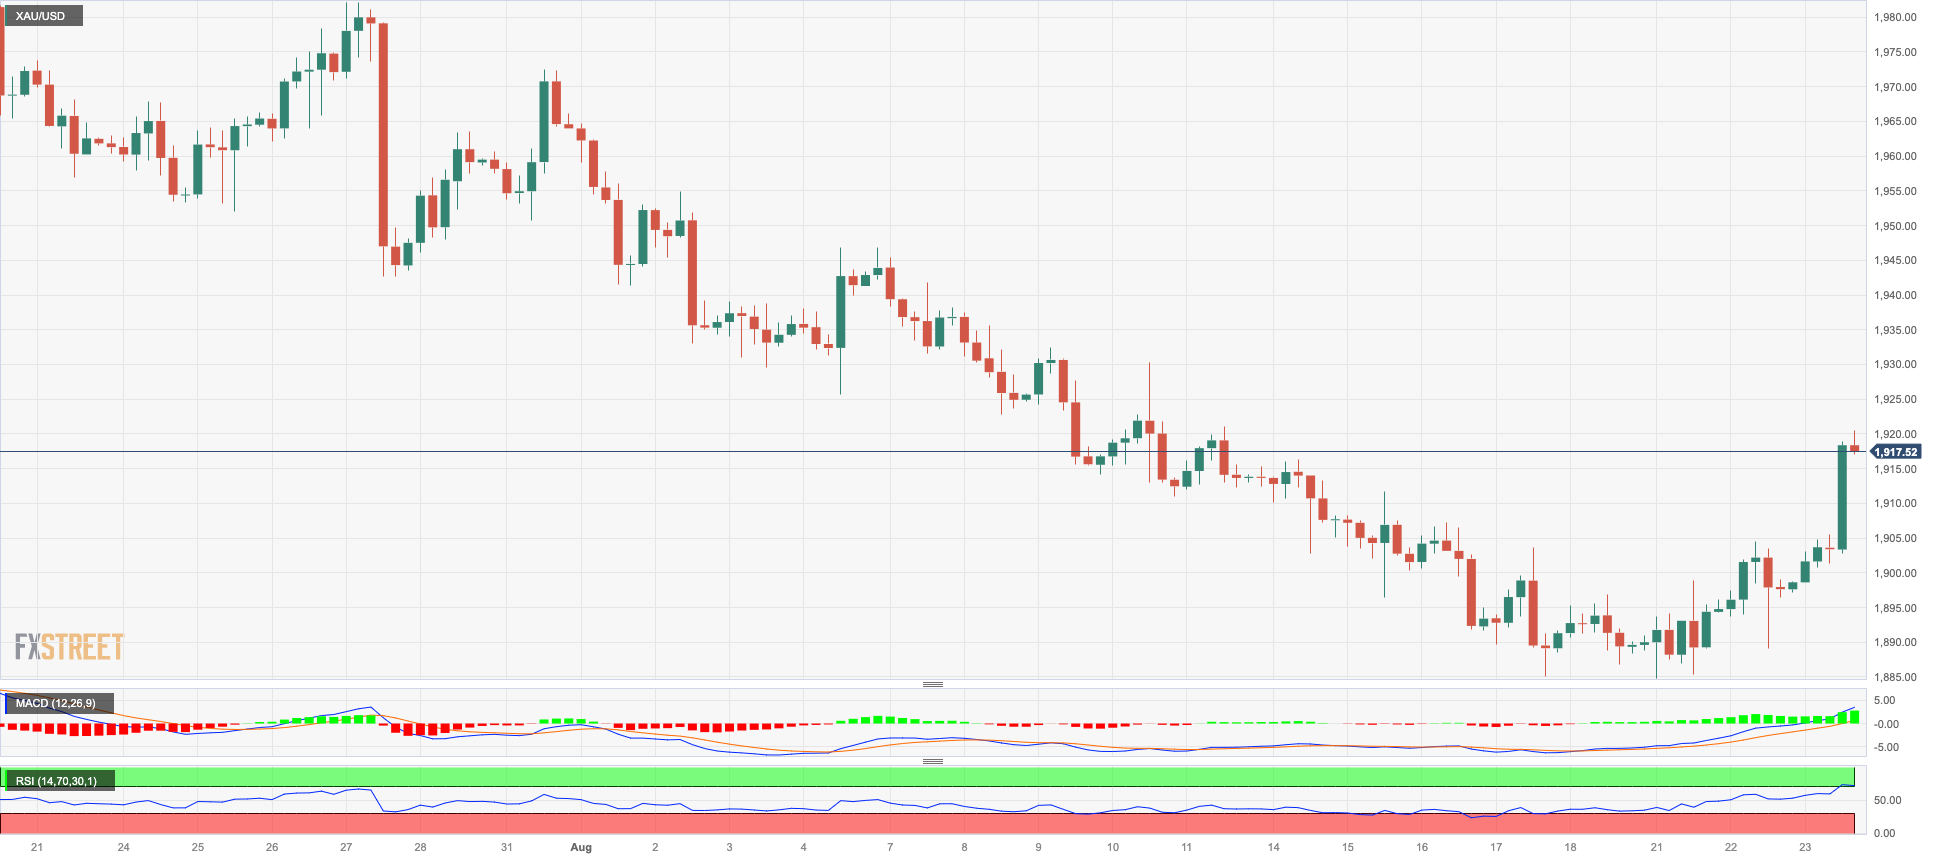
GOLD
The strong pullback in the greenback lent much-needed oxygen to USD-denominated assets on Wednesday.
Against that, prices of the troy ounce of the precious metal managed to reclaim the area beyond the key $1900 mark and reach new multi-session tops, while the equally marked correction in US yields across the curve added to bullion’s positive price action midweek.
Moving forward, there is a sense of expectation that the precious metal will attract significant scrutiny in the upcoming hours leading to the highly anticipated Jackson Hole Symposium and the address by Chair J. Powell, scheduled for Thursday and Friday.
If the recovery gathers extra pace, gold prices should meet the next hurdle at the interim 55-day and 100-day SMAs at $ 1934 and $ 1960 respectively. In addition, the July high of $ 1987 is a significant hurdle to overcome just ahead of the psychological $2000 level. The breakout of the latter could pave the way for a probable test of the 2023 top at $2067 (May 4), seconded by the 2022 peak at $2070 (March 8) and the all-time high at $2075 (August 7, 2020). On the contrary, there is an immediate support at the August low of $1884 prior to the 2023 low of $1804 (February 28) and the important support zone of $1800.
Resistance levels: $1920 $1936 $1946 (4H chart)
Support levels: $1884 $1809 $1804 (4H chart)
CRUDE WTI
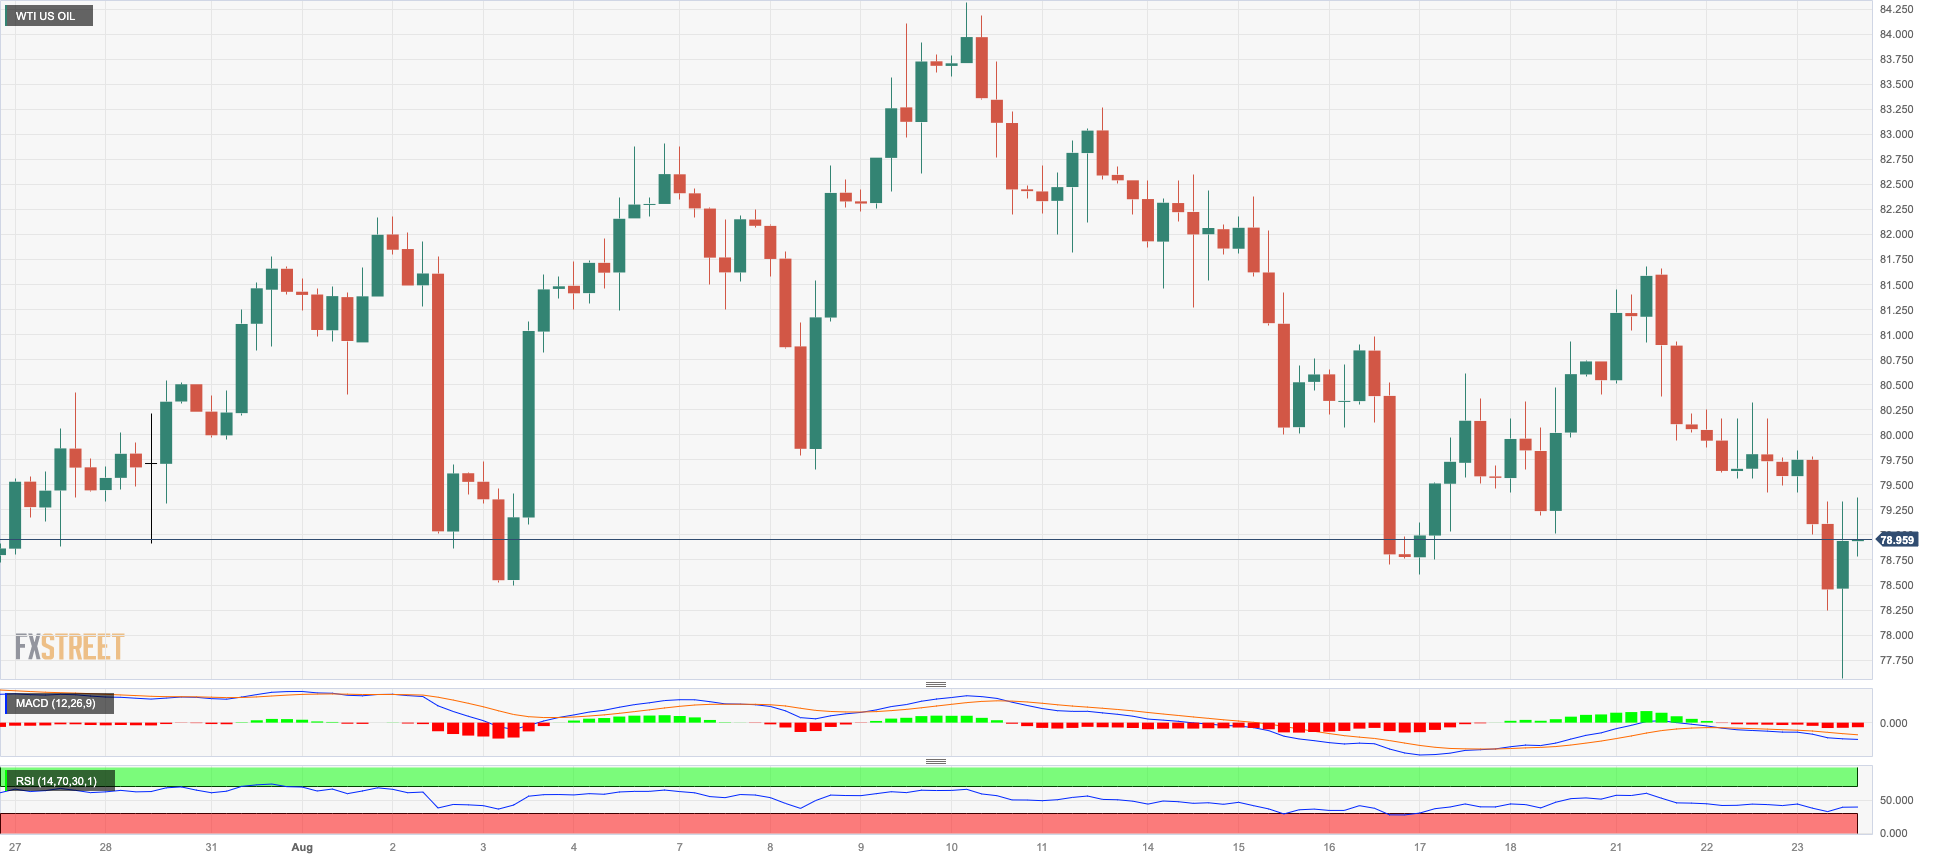
WTI prices experienced a decline, reaching multi-week lows below the $78.00 level, but managed a moderate recovery above the $79.00 mark per barrel mark on Wednesday.
The unexpected increase in weekly gasoline inventories, as reported by the EIA, reignited concerns about demand. Additionally, factors such as the Fed’s narrative of maintaining a tighter monetary policy for a longer period, weaker-than-expected PMI readings in key economies, and the rise in Iran's crude oil production all contributed to a further dampening of traders' sentiment.
Back to the EIA, the agency reported that US crude oil inventories shrank more than expected by 6.135M barrels in the week to August 18, while supplies at Cushing dropped by 3.133M barrels, Weekly Distillate Stocks rose by 0.945M barrels and gasoline stockpiles unexpectedly increased by 1.467M barrels.
Extra losses in WTI target the August low of $77.68 (August 23) before the key 200-day SMA at $76.10. The provisional 55-day and 100-day SMAs are placed south of this at $75.72 and $75.26, respectively, ahead of the weekly low of $73.89 (July 17), the June low of $66.86 (June 12), and the 2023 low of $63.61 (May 4). A deeper decline may push prices as low as the December 2021 low of $62.46 (December 2), before the critical $60.00 mark per barrel. Instead, the next up-barrier appears the 2023 high of $84.85 (August 10) prior to the November 2022 top of $93.73 (November 7) and the weekly peak of $97.65 (August 30 2022).
Resistance levels: $81.69 $83.77 $84.85 (4H chart)
Support levels: $77.68 $73.81 $72.64 (4H chart)
GER40
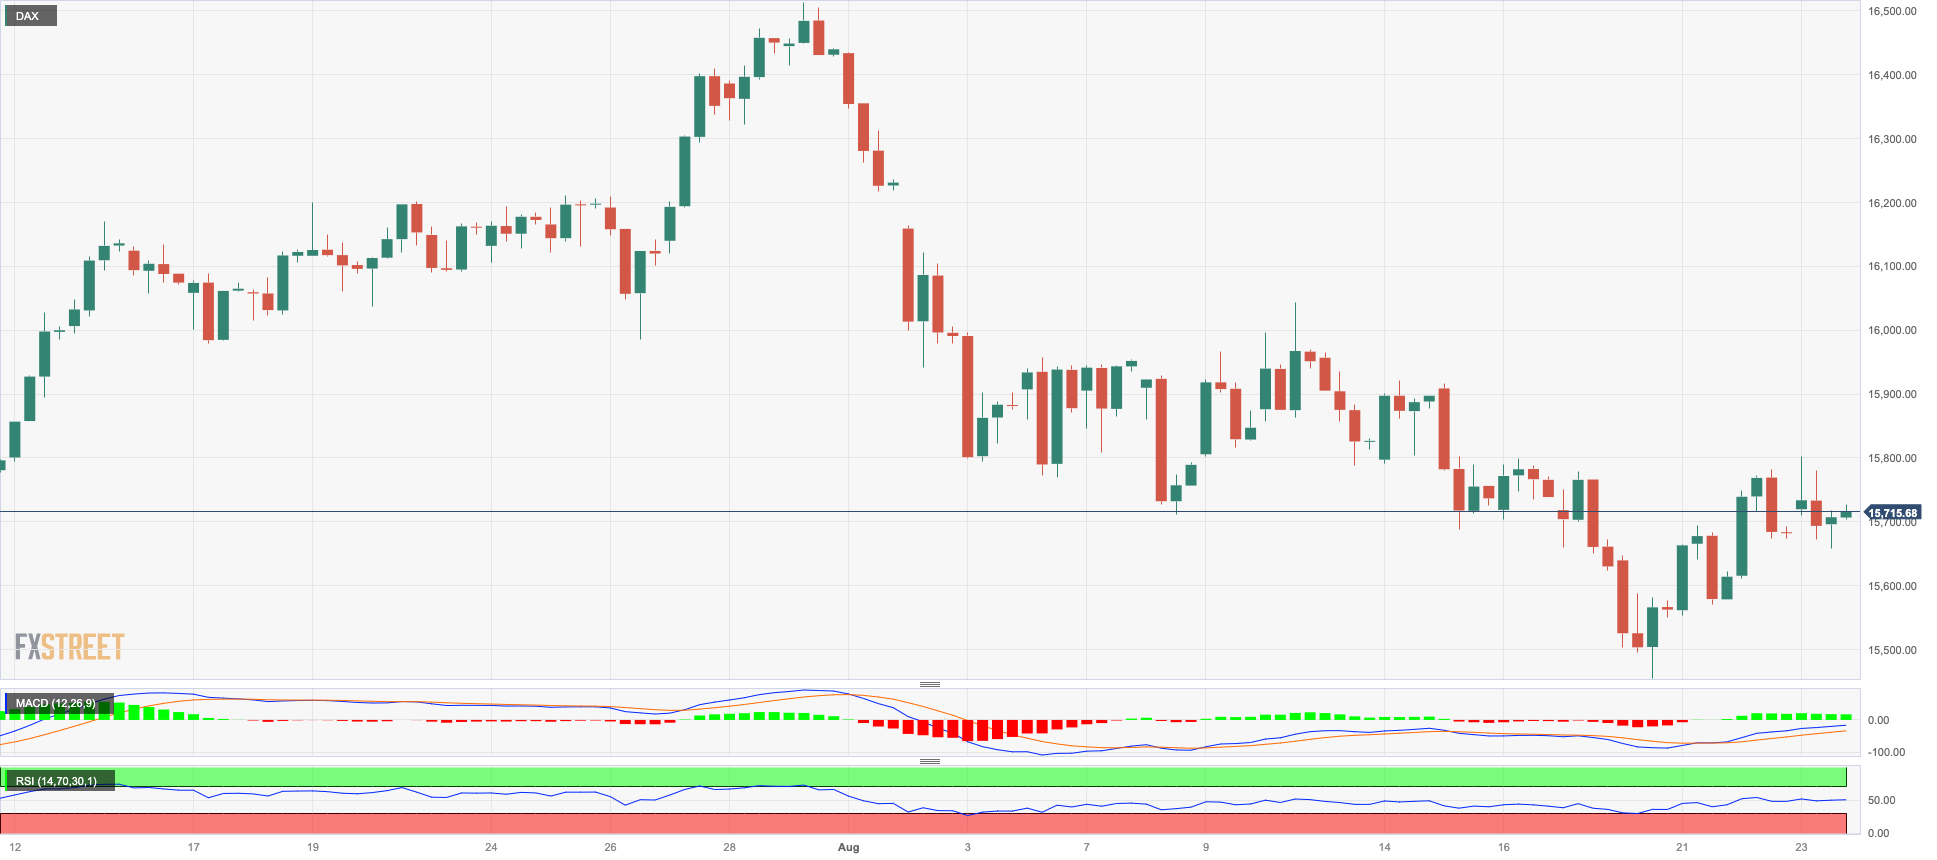
German stocks monitored through the benchmark DAX40 index continued their recovery for the week and managed to re-establish a foothold above the 15800 level on Wednesday.
This upward shift in the index contradicted the notable decrease observed in the yields of 10-year government bund and revived worries about the well-being of the economy, prompted by disappointing preliminary PMIs figures from Europe. As the Jackson Hole Symposium looms on the horizon later in the week, an air of caution is expected to envelop the market.
Counterbalancing these concerns, there was a positive note in the form of robust performance within the commodities sector, lending support to the stock index.
Extra gains in the DAX40 should retarget the weekly high of 16060 (August 10), which looks propped up by the interim 55-day line SMA (15996) and comes ahead of the all-time high of 16528 (July 31). Just the opposite, initial support is expected at the August low of 15468 (August 18) seconded by the July low of 15456 (July 7) and the important 200-day SMA of 15397. If the index falls below this level, it could also dispute the March low of 14458 (March 20) before reaching the December low of 13791 (December 20) and the 2022 low of 11862 (September 28). The everyday RSI rose past 43.
Best Performers: Vonovia, Symrise AG, Merck
Worst Performers: Adidas, Heidelbergcement, Commerzbank
Resistance levels: 15820 16060 16528 (4H chart)
Support levels: 15468 15456 14809 (4H chart)
NASDAQ
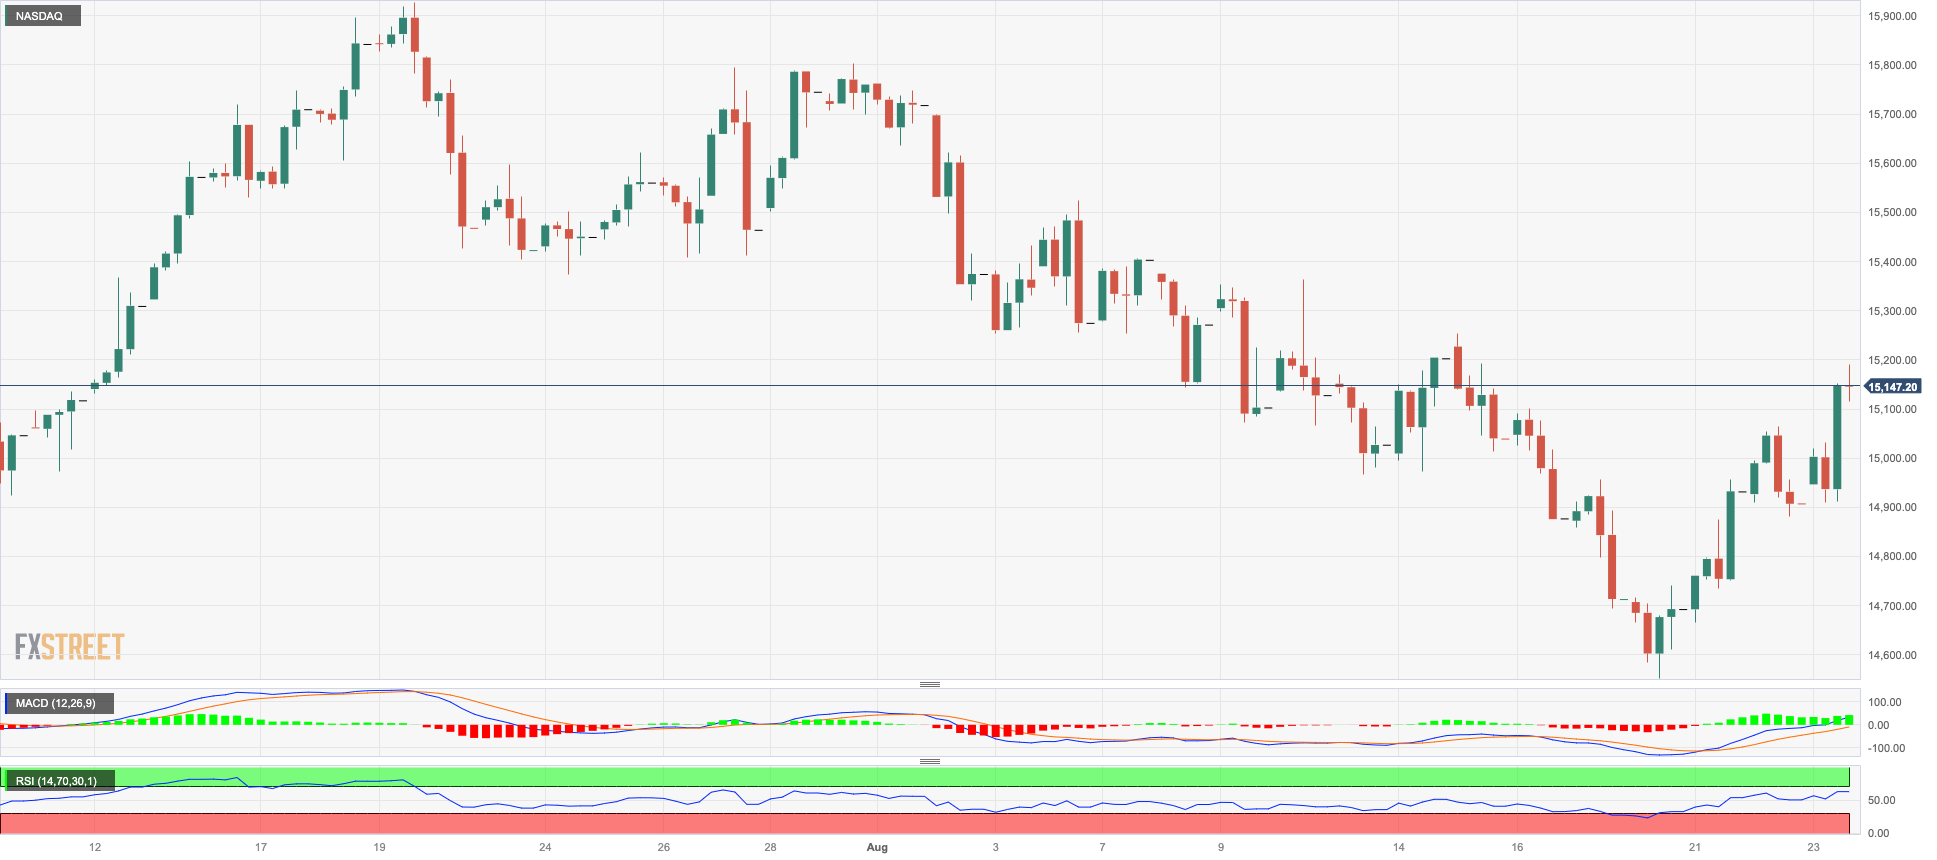
Following the lead of its US counterparts, the Nasdaq 100 index surged to multi-day highs on Wednesday, surpassing the 15000 level once again.
The decline in the greenback and the significant drop in US bond yields across various maturity periods provided a boost to sentiment in the US tech sector. This positive sentiment was further reinforced by growing expectations surrounding the upcoming earnings reports from NVDIA.
However, it is worth noting that the index may experience increased volatility and caution in the lead-up to the Jackson Hole Symposium, which commences on Thursday. Market participants are eagerly awaiting Federal Reserve Chairman Powell's remarks, widely expected to reiterate the tone set at the latest FOMC event.
In case bulls push harder, However, the Nasdaq 100 should challenge the weekly high of 15803 (July 31) seconded by the 2023 top of 15932 (July 19), both of which are ahead of the round mark of 16000. On the flip side, there is immediate support at the August low of 14557 (August 18), which is just ahead of the transitory 100-day SMA at 14359. South from here comes the weekly low of 14283 (June 7) before the weekly low of 13520 (May 24), the 200-day SMA of 13100, and the April low of 12724 (April 25). The daily RSI rose past 51.
Top Gainers: Netflix, The Trade Desk, Ross Stores
Top Losers: Sirius XM, Xcel Energy, DexCom
Resistance levels: 15324 15795 15932 (4H chart)
Support levels: 14557 14293 13520 (4H chart)
DOW JONES
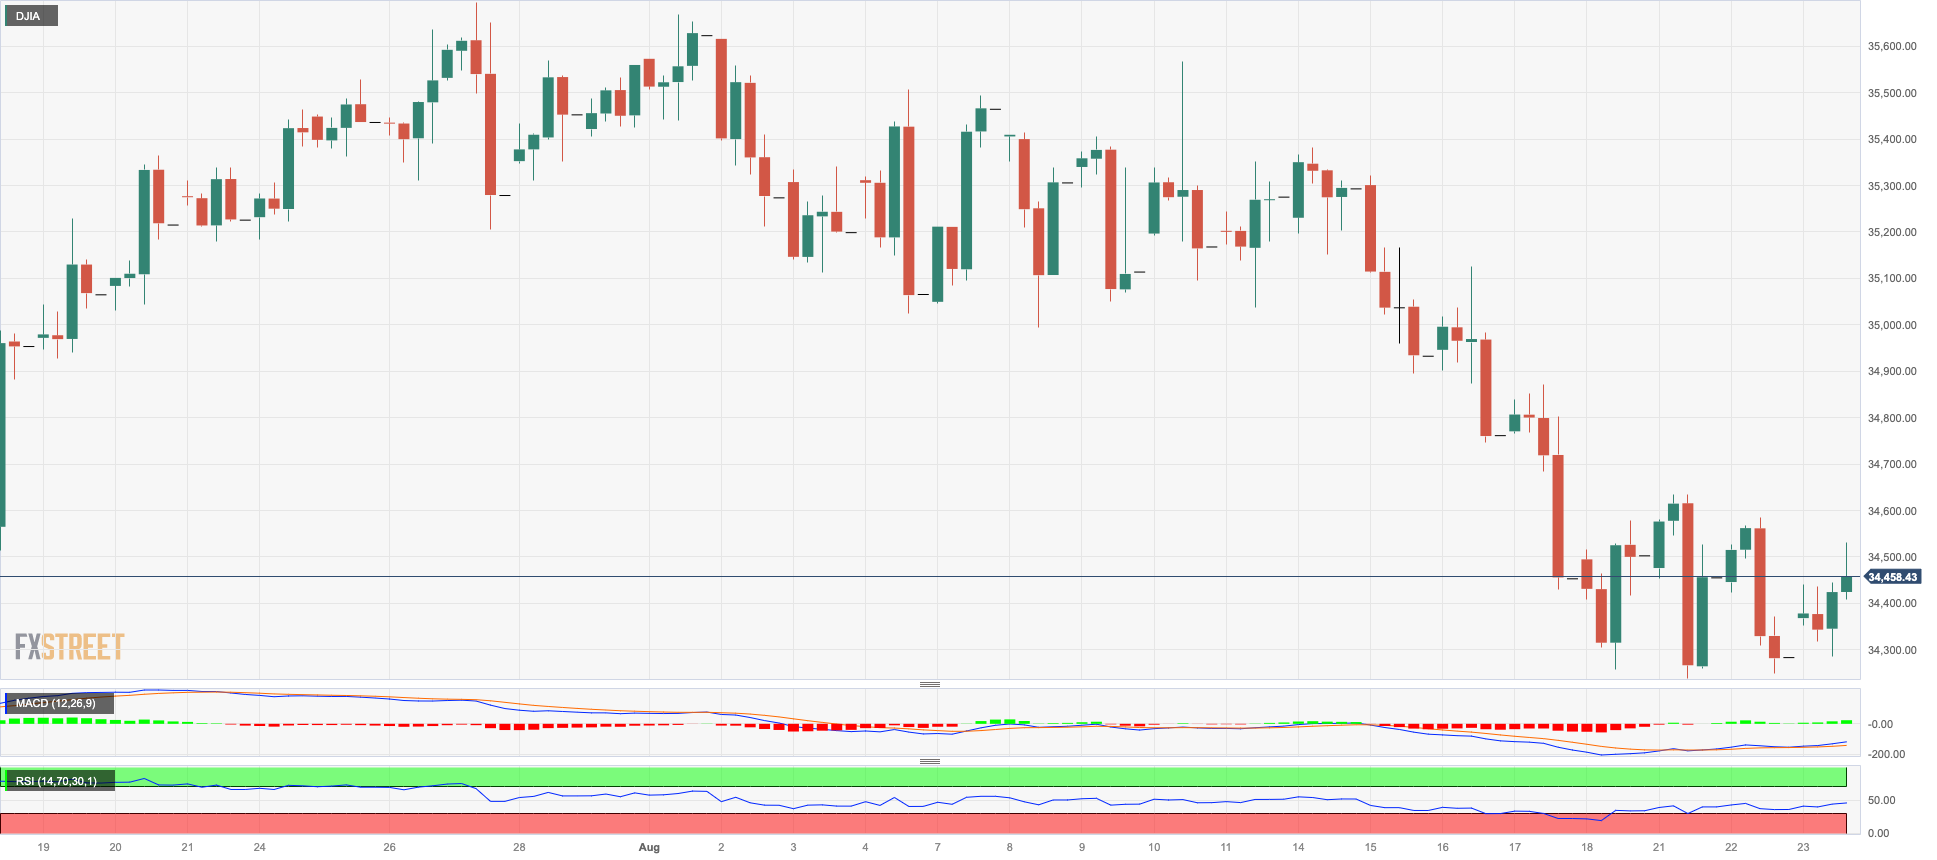
After undergoing losses in the previous two trading sessions, the prominent US benchmark Dow Jones rebounded on Wednesday and approached its highest levels in a span of two days, hovering around the vicinity of 34500.
Market sentiment was generally positive as traders and investors felt a growing sense of unease in anticipation of chip-maker NVIDIA's earnings report, scheduled to be released after the closing bell on Wall Street.
Conversely, there was a note of caution among investors as they looked ahead to the commencement of the Jackson Hole Symposium on Thursday. There was a concern that the Federal Reserve might adhere to its current restrictive approach for a longer duration than initially predicted. Furthermore, disheartening data emerging from the manufacturing and services sectors contributed to this less optimistic outlook.
All in all, the Dow Jones gained 0.55% to 34477, the S&P500 advanced 1.13% to 4437, and the tech-heavy Nasdaq Composite rose 1.65% to 13728.
If the Dow Jones resumes the downside, the 100-day SMA at 34095 should offer transitory contention ahead of the July low of 33705 (July 10), a region supported by the 200-day line SMA at 33719. If the latter is broken, the May low of 32586 (May 25) will be targeted before the 2023 low of 31429 (March 15) is reached. Conversely, the immediate hurdle is the 2023 high of 35679 (August 1) prior to the February 2022 top of 35824 (February 9) and the all-time peak of 36952 (January 5, 2022). The day-to-day RSI climbed to the proximity of 43.
Top Performers: Merck&Co, Intel, Apple
Worst Performers: Nike, J&J, Walgreen Boots
Resistance levels: 35119 35679 35824 (4H chart)
Support levels: 34248 34090 33705 (4H chart)
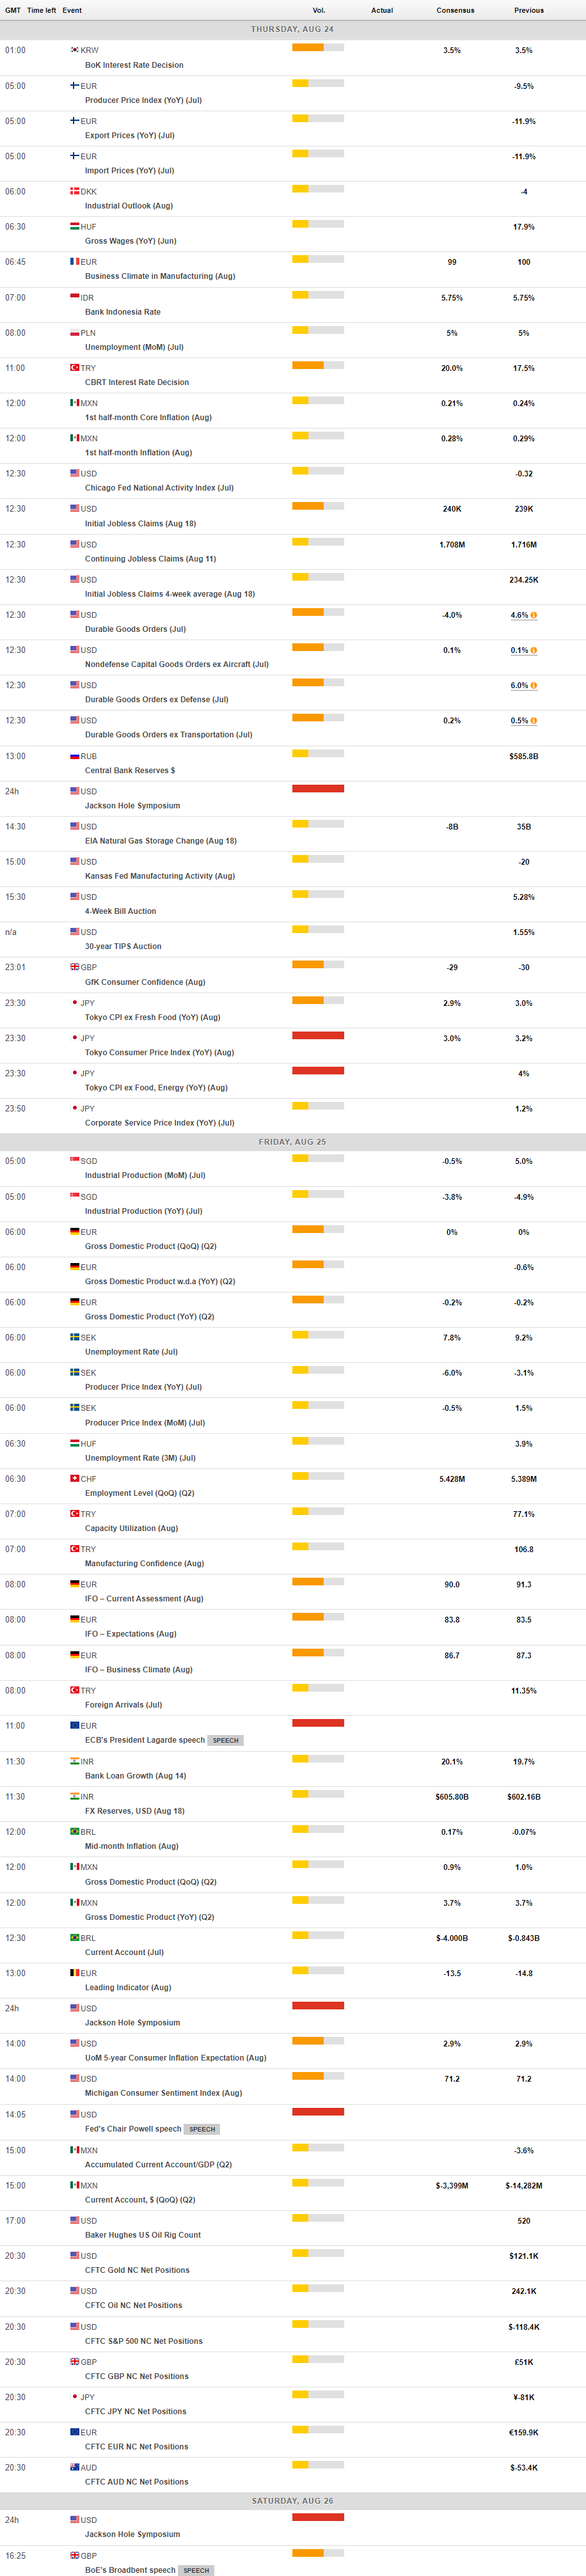
MACROECONOMIC EVENTS
All Information & Updates provided by:

All information relating to the financial markets available on this page has been prepared and issued by FXStreet (Forexstreet SL, Spain, Reg: B62498233) on the basis of publicly available information and all information believed to be reliable and does not conflict with Kuwaiti local laws, and all necessary care has been taken to before the company to ensure that the facts mentioned are correct from the source.
NCM Investment nor any of its directors or employees shall in any way be held responsible for the contents of this news, and the information contained on this page is intended only to provide clients with publicly available information and should not be construed as investment advice, report or analysis and/or constitute an offer or invitation to buy or sell financial instruments of any kind.
RISK WARNING: Forex and CFDs are highly risky leveraged products, as losses can exceed deposits. Please ensure you understand all the risks and take independent advice if necessary. NCM will segregate the clients based on the criteria of the regulator and its bylaws. NCM does not provide any advisory service; the material published does not constitute advice or a recommendation for a transaction in any financial instrument. NCM accepts no responsibility for any use of the content presented and any consequences of that use. Anyone acting on the information provided does so at their own risk.