
- Contact Us:
-

-

-

-


Daily Market Updates
25 Aug 2023
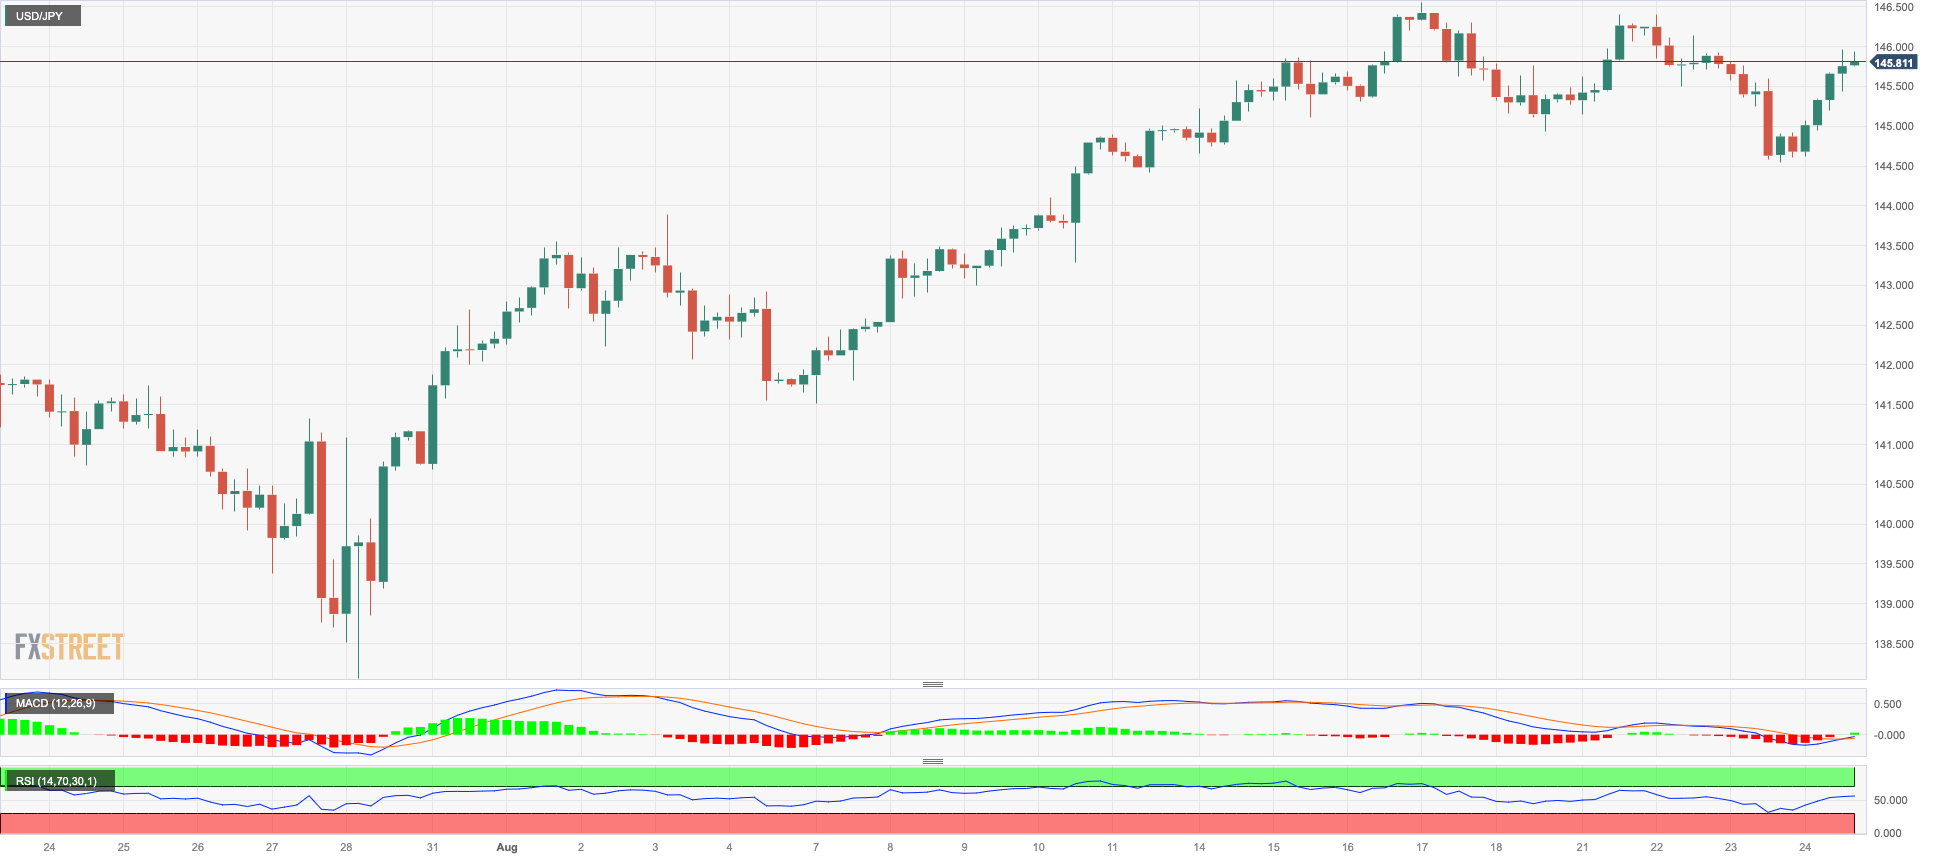
USDJPY
The sharp bounce in the dollar and further signs of life from US yields across the curve sponsored the recovery in USD/JPY to the boundaries of the 146.00 yardstick after two consecutive daily declines on Thursday.
In the Japanese money market, in the meantime, the JGB 10-year benchmark yields shed some ground and probed levels below the 0.65% mark.
In the Japanese docket, Foreign Bond Investment shrank by ¥263.2B in the week to August 19.
The next upward hurdle for USD/JPY is the 2023 high of 146.56 (August 17), seconded by the 2022 top of 151.94. (October 21). Instead, the 55-day SMA at 142.49 is viewed as an obvious challenger ahead of the August low at 141.50 (August 7). If this level is breached, the pair may fall to the weekly low of 138.05 (July 28), then to the July low of 137.23 (July 14) and the 200-day SMA of 136.63. A deeper decline might threaten the weekly low of 133.01 (April 26), as well as the minor level of 132.01 (April 13) and the April low of 130.62. (April 5). On the daily chart, the RSI improved to the 61 region.
Resistance levels: 145.95 146.40 146.56 (4H chart)
Support levels: 144.53 143.25 142.28 (4H chart)
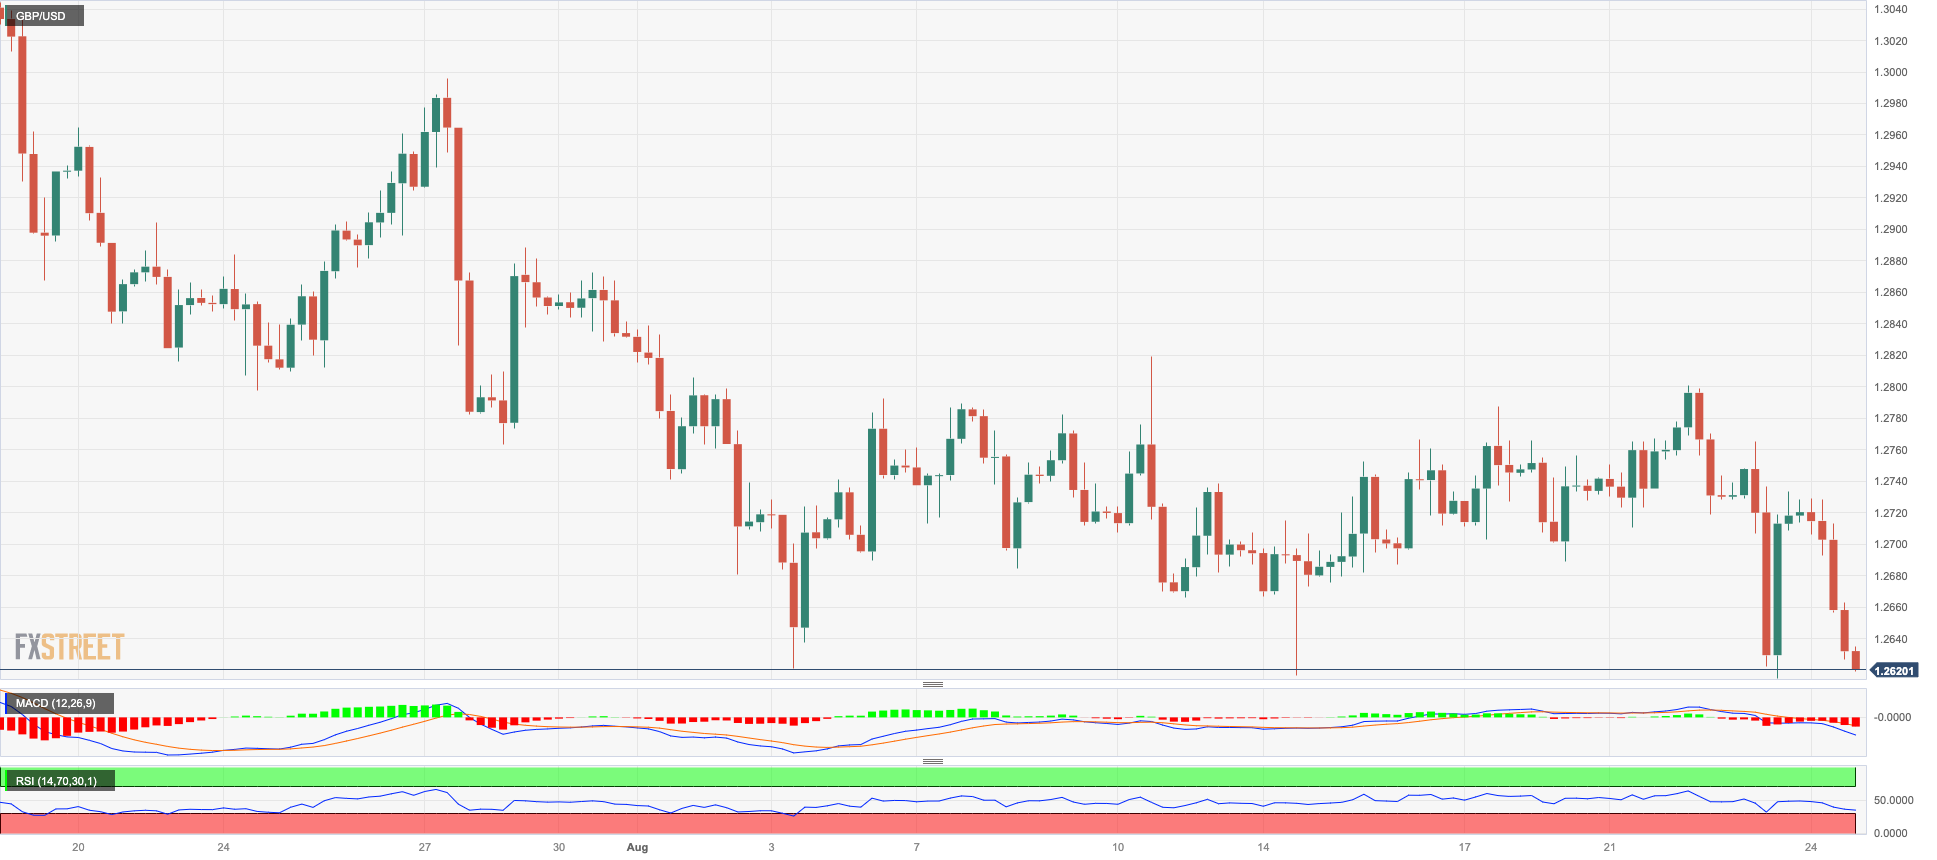
GBPUSD
GBP/USD added to the weekly leg lower and lost ground for the third session in a row on Thursday.
The strong comeback in the greenback encouraged the USD Index (DXY) to rapidly leave behind Wednesday’s pullback and re-shift its focus to the upside amidst the recovery in US yields and the sour mood prevailing among risk-linked assets.
Across the Channel, CBI Distributive Trades deteriorated to -44 for the current month (from -25).
If GBP/USD breaks the August low of 1.2614 (August 23), it could subsequently challenge the weekly low of 1.2590 (June 29) ahead of the 2021-2023 trendline around 1.2440. South of here, the 200-day SMA is at 1.2394, followed by the June low at 1.2368 (June 5) and the May low at 1.2308 (May 25). On the other hand, the weekly high of 1.2818 (August 10) is followed by another weekly top of 1.2995 (July 27), which is just before the critical barrier of 1.3000. Once the pair clears the 2023 peak of 1.3142 (July 14), the weekly highs of 1.3146 (April 14, 2022) and 1.3298 (March 15, 2022) become relevant. The RSI on the daily chart sank to the sub-38 zone.
Resistance levels: 1.2800 1.2824 1.2888 (4H chart)
Support levels: 1.2614 1.2591 1.2486 (4H chart)
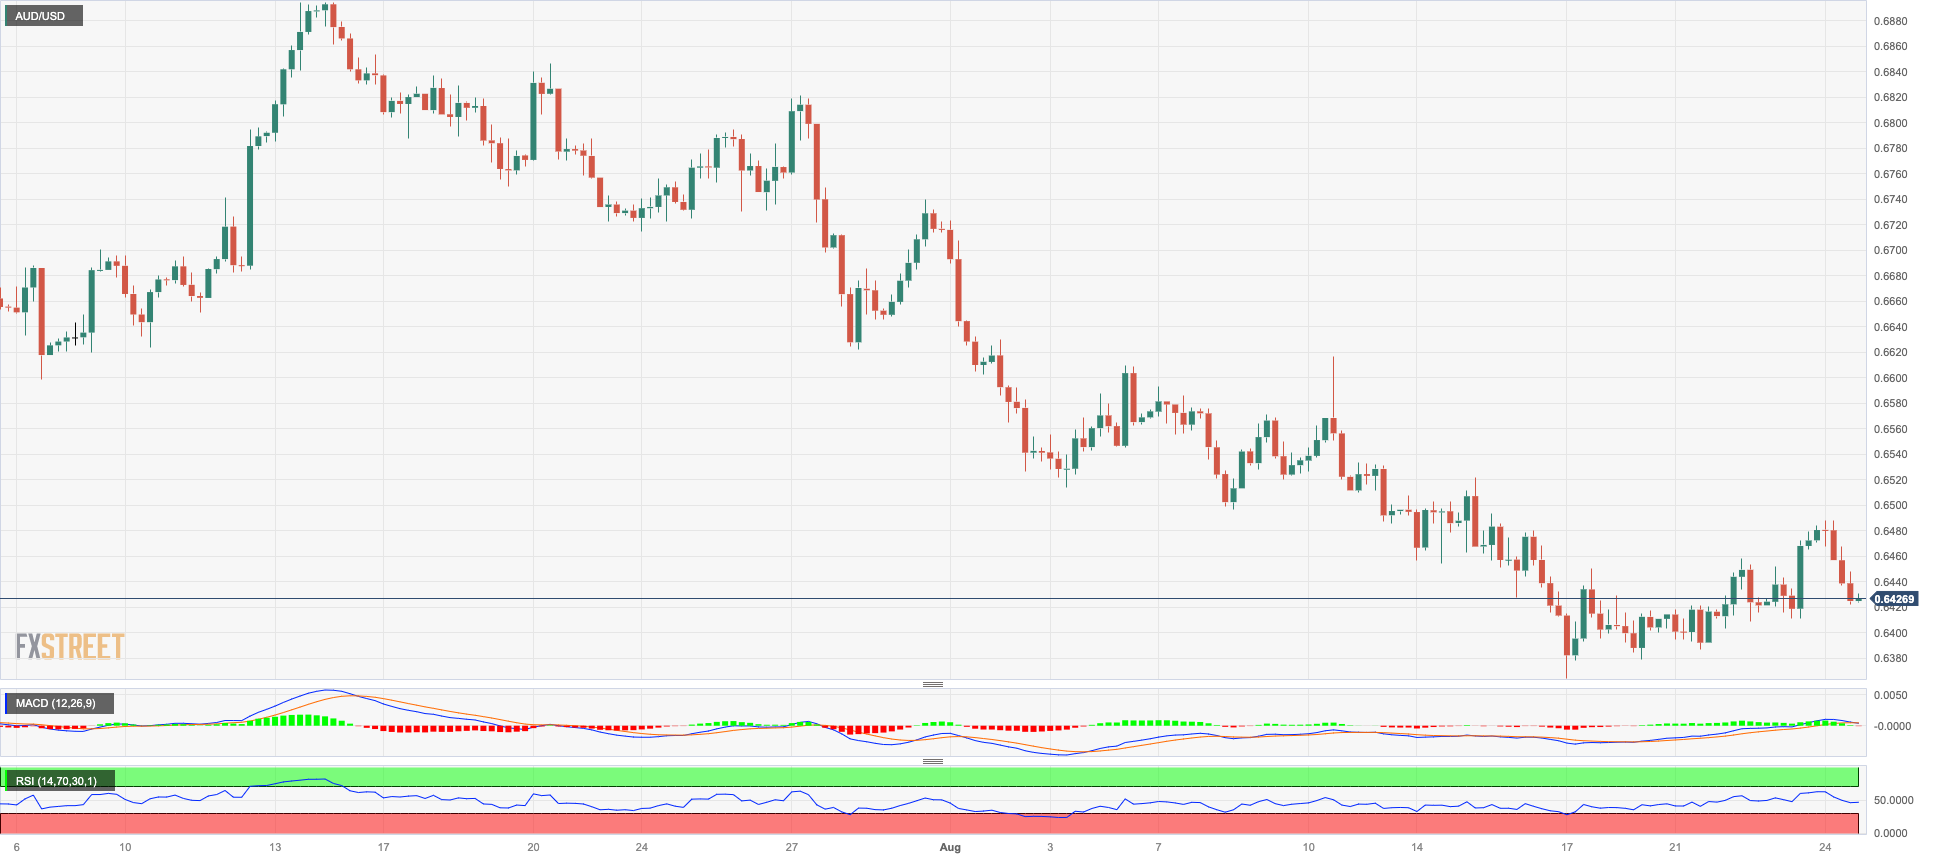
AUDUSD
A reality check sent AUD/USD lower after three consecutive daily pullbacks on Thursday.
Indeed, the sharp advance in the greenback coupled with higher yields and a broad-based cautious tone ahead of the speech by Chair Powell at Jackson Hole on Friday kept the buying interest depressed and sponsored the return of sellers to the market.
Not even the generalized positive tone in the commodity galaxy was enough to lend some support to the Aussie dollar on Thursday.
There were no data releases Down Under on Thursday.
Despite the comeback so far this week, the AUD /USD remains under pressure. Against this backdrop, the next key support is at the 2023 low of 0.6364 (August 17), ahead of the November 2022 low of 0.6272 (November 7) and the 2022 low of 0.6179 (October 13). On the flip side hand, there is a first barrier at the weekly high of 0.6616 (August 10) prior to the 0.6660 region where the preliminary 100-day and 55-day SMAs converge. Once above this region, the pair could tackle the 200-day SMA at 0.6727 before reaching the July peak of 0.6894 (July 14), which appears closely followed by the June top of 0.6899 (June 16). The crucial 0.7000 level is ahead of the weekly high of 0.7029 (February 14) and the 2023 top of 0.7157 (February 2). The day-to-day RSI slipped back below 37.
Resistance levels: 0.6488 0.6521 0.6616 (4H chart)
Support levels: 0.6364 0.6272 0.6210 (4H chart)
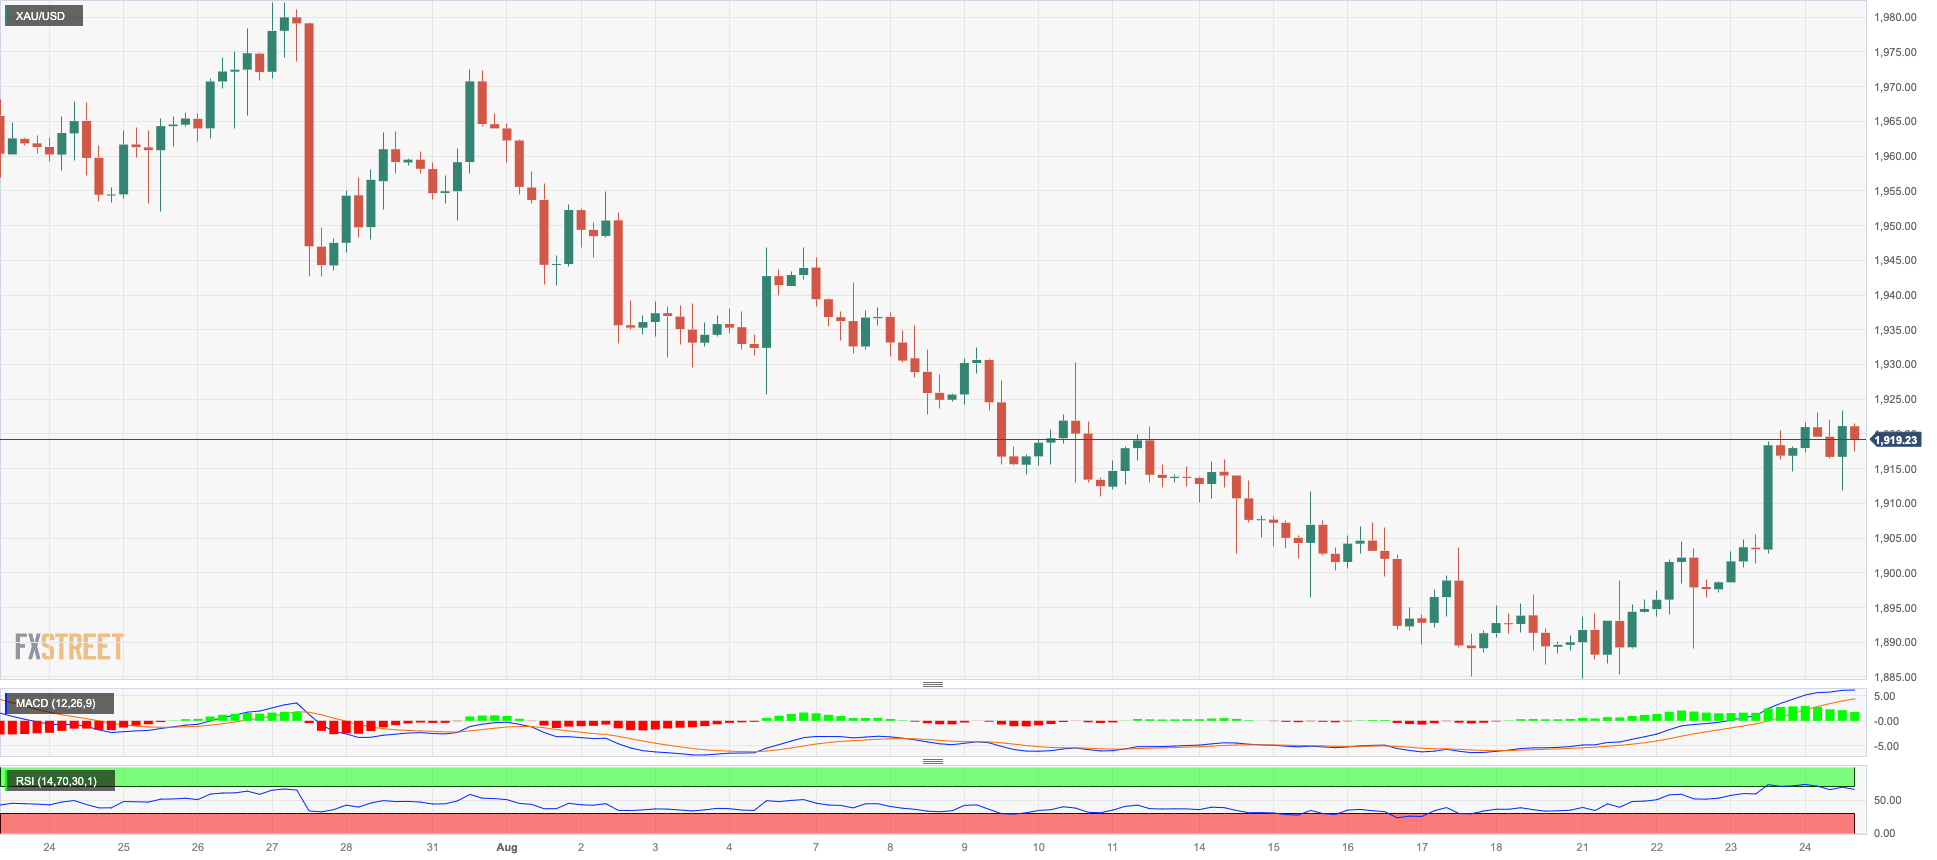
GOLD
Another positive session in prices of the precious metal allowed the fourth consecutive daily advance as well as the test of multi-day highs near $1925 per troy ounce on Thursday.
Bullion managed to regain traction despite the sharp comeback of the greenback and the slight bounce in US yields across different time frames.
Looking ahead, there is a strong anticipation that the yellow metal will be closely examined in the coming hours as we approach the highly anticipated Jackson Hole Symposium and the speech by Fed’s Powell.
If the recovery accelerates, gold prices will face the next challenge at the interim 55-day and 100-day SMAs of $ 1933 and $ 1958, respectively. Furthermore, the July high of $1987 represents a substantial barrier to overcome, just ahead of the psychological $2000 threshold. The latter's breakout might pave the way for a test of the 2023 high at $2067 (May 4), followed by the 2022 top at $2070 (March 8) and the all-time peak at $2075 (August 7, 2020). On the contrary, there is immediate support at the August low of $1884 before the 2023 low of $1804 (February 28) and the critical support zone of $1800.
Resistance levels: $1923 $1936 $1946 (4H chart)
Support levels: $1884 $1809 $1804 (4H chart)
CRUDE WTI
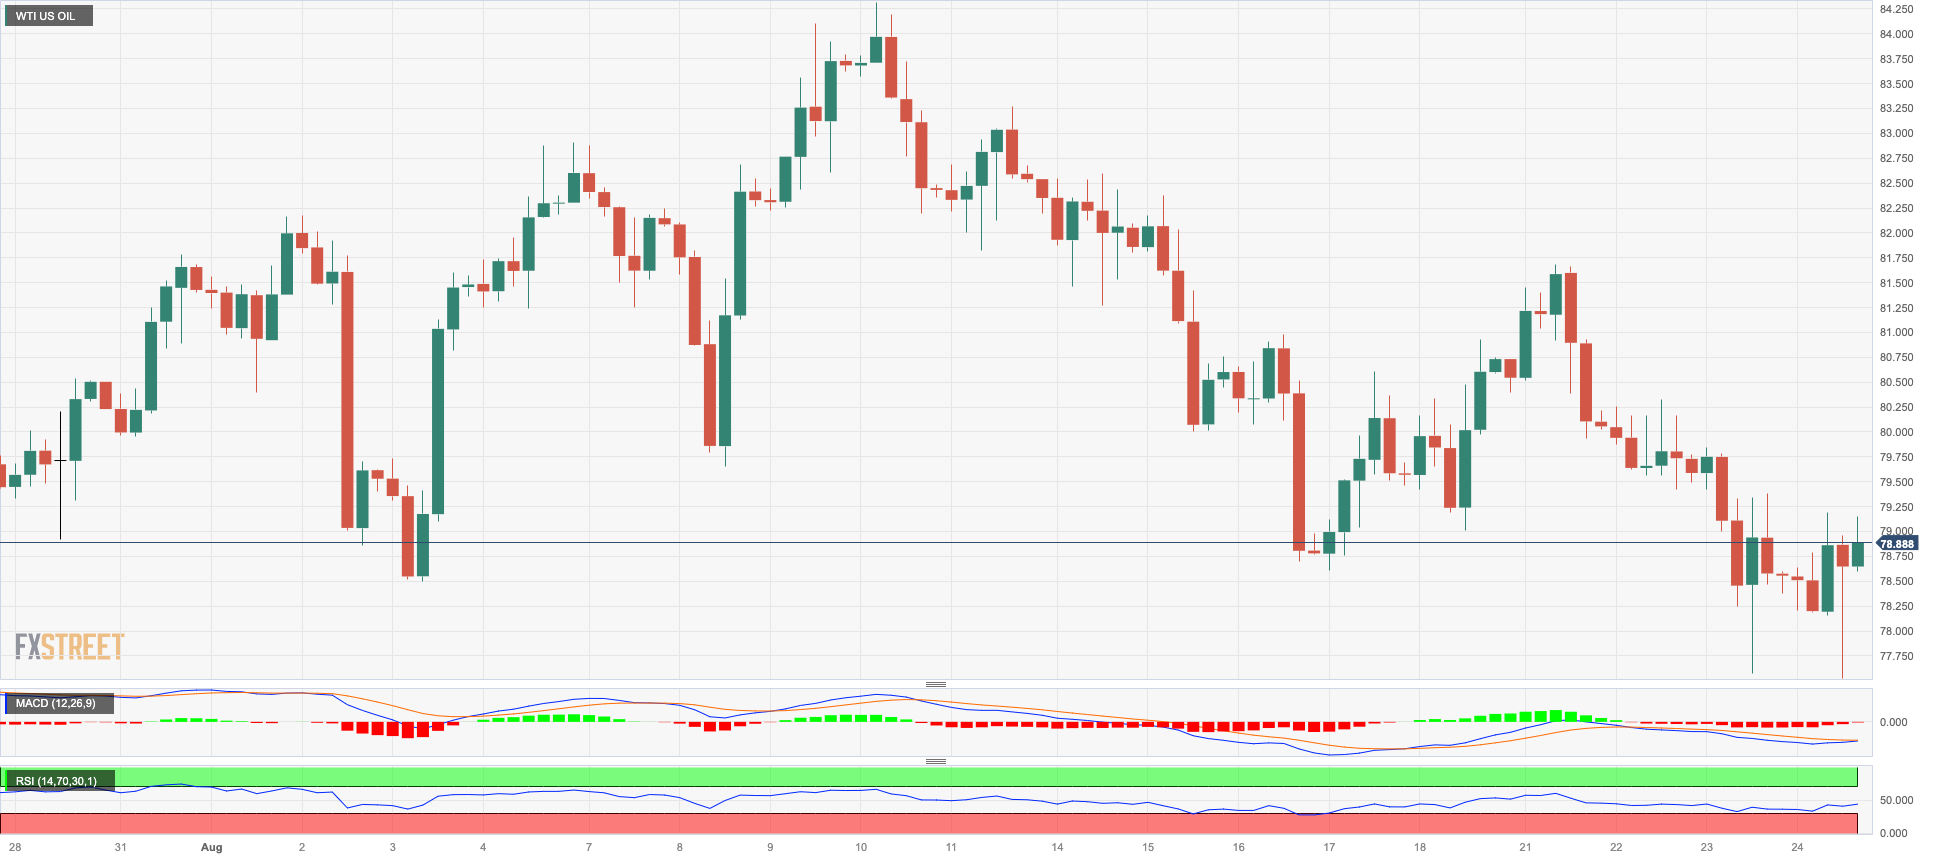
The small rebound in prices of the American benchmark for sweet light crude oil was enough to reverse three consecutive daily pullbacks on Thursday.
However, despite the uptick, demand concerns remained pretty much unabated, while rising cautiousness ahead of Powell’s speech at Jackson Hole on Friday combined with persevering fears that the Fed might keep the tight monetary stance for longer than anticipated also limited the upside potential of the commodity.
On a brighter side, the larger-than-expected weekly drop in US crude oil inventories (according to the EIA) and speculation that Saudi Arabia might extend its voluntary oil output cuts into October acted as decent drivers supporting WTI prices.
Extra losses in WTI are aimed at the August low of $77.64 (August 24), which is just above the 200-day SMA at $76.05 and the provisional 55-day and 100-day SMAs at $75.85 and $75.23, respectively. South of this emerges the weekly low of $73.89 (July 17), the June low of $66.86 (June 12), and the 2023 low of $63.61 (May 4). A deeper decrease may prompt prices to dispute the December 2021 low of $62.46 (December 2), just before the key $60.00 threshold. Just the opposite, the next upward hurdle looks to be the 2023 top of $84.85 (August 10) prior to the November 2022 high of $93.73 (November 7) and before the weekly peak of $97.65 (August 30 2022).
Resistance levels: $81.69 $83.77 $84.85 (4H chart)
Support levels: $77.56 $73.81 $72.64 (4H chart)
GER40
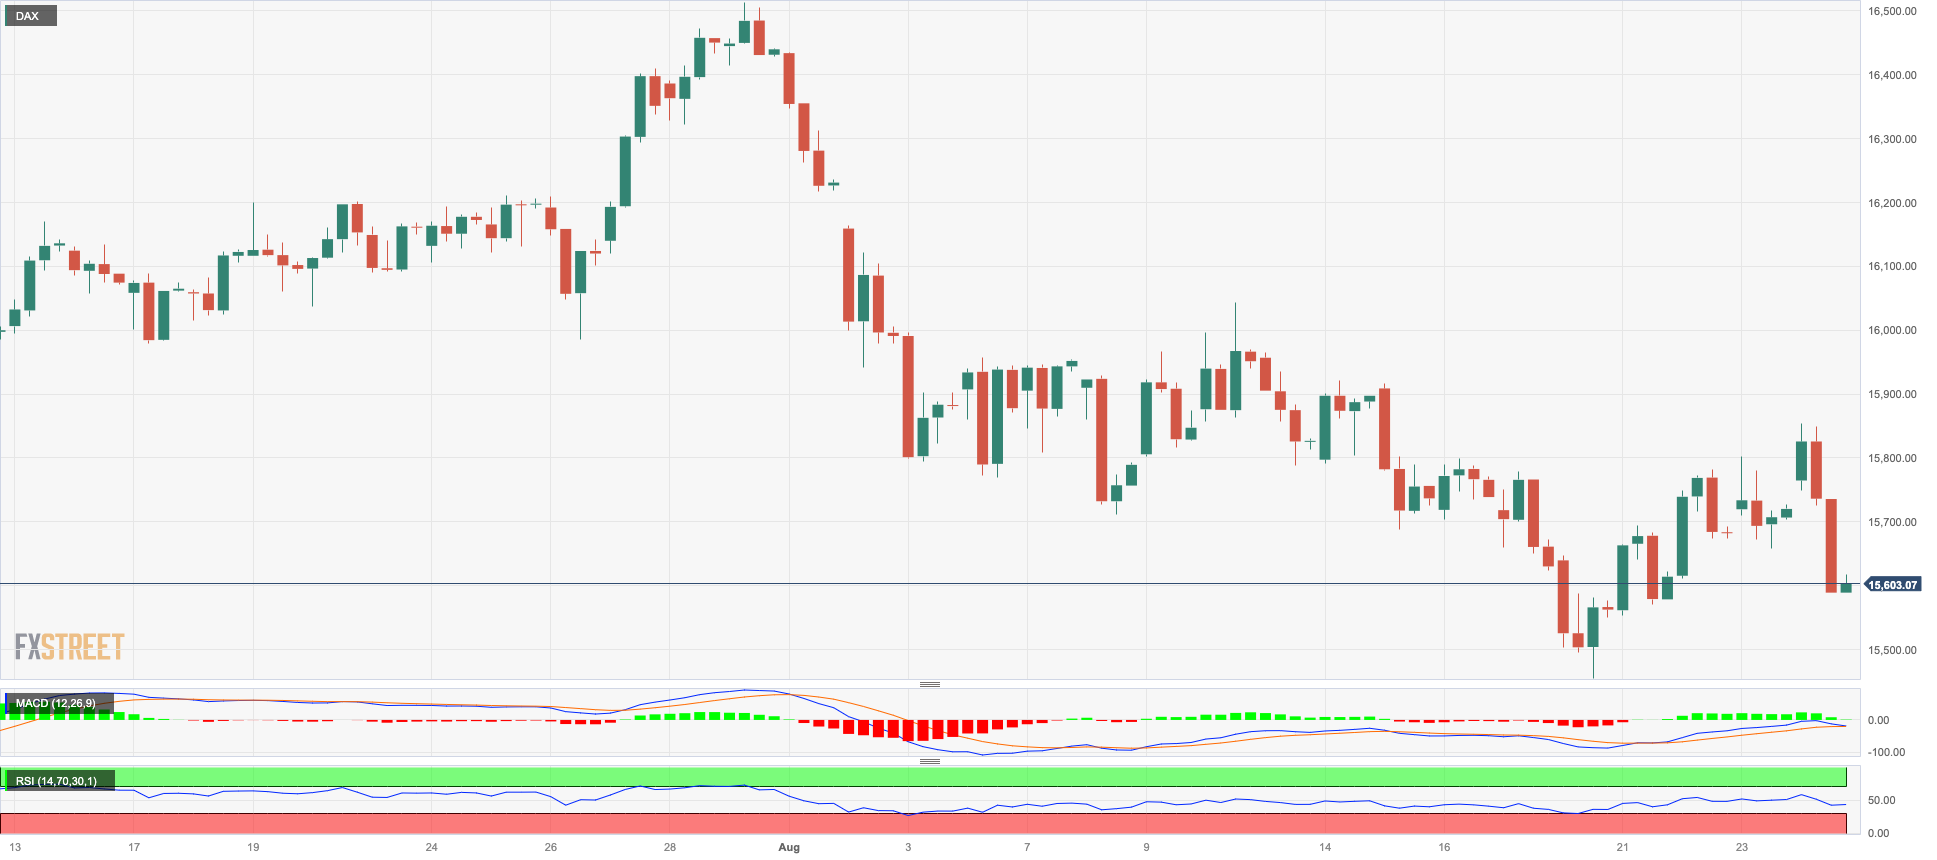
Germany’s blue-chip index DAX40 left behind three consecutive daily advances, closing at three-day lows near 15600 on Thursday.
The daily losses in the benchmark index came on the back of rising unease ahead of the speeches by Fed Chairman J. Powell and ECB President C. Lagarde at the Jackson Hole Symposium on Friday.
Regarding the ECB, speculation about the likelihood of a pause by the central bank at the September gathering has been picking up pace as of late. This market chatter also appeared to be exacerbated by the gloomy prints from recent flash PMIs for the month of August.
Adding to the sour mood among traders emerged the almost omnipresent concerns surrounding China and its (so far non-existent) strong economic recovery.
Extra DAX40 gains should retarget the weekly high of 16060 (August 10), which appears to be supported by the intermediate 55-day line SMA (15989) and comes ahead of the all-time high of 16528 (July 31). On the contrary, first support is projected around the August low of 15468 (August 18), followed by the July low of 15456 (July 7) and the crucial 200-day SMA of 15404. If the index goes below this level, it may challenge the March bottom of 14458 (March 20), before hitting the December low of 13791 (December 20) and the 2022 low of 11862 (September 28). The everyday daily RSI weakened below the 40 yardstick.
Best Performers: Covestro, Symrise AG, Hannover Rueck SE
Worst Performers: Daimler Truck Holding, Infineon, SAP
Resistance levels: 16896 16060 16528 (4H chart)
Support levels: 15468 15456 14809 (4H chart)
NASDAQ
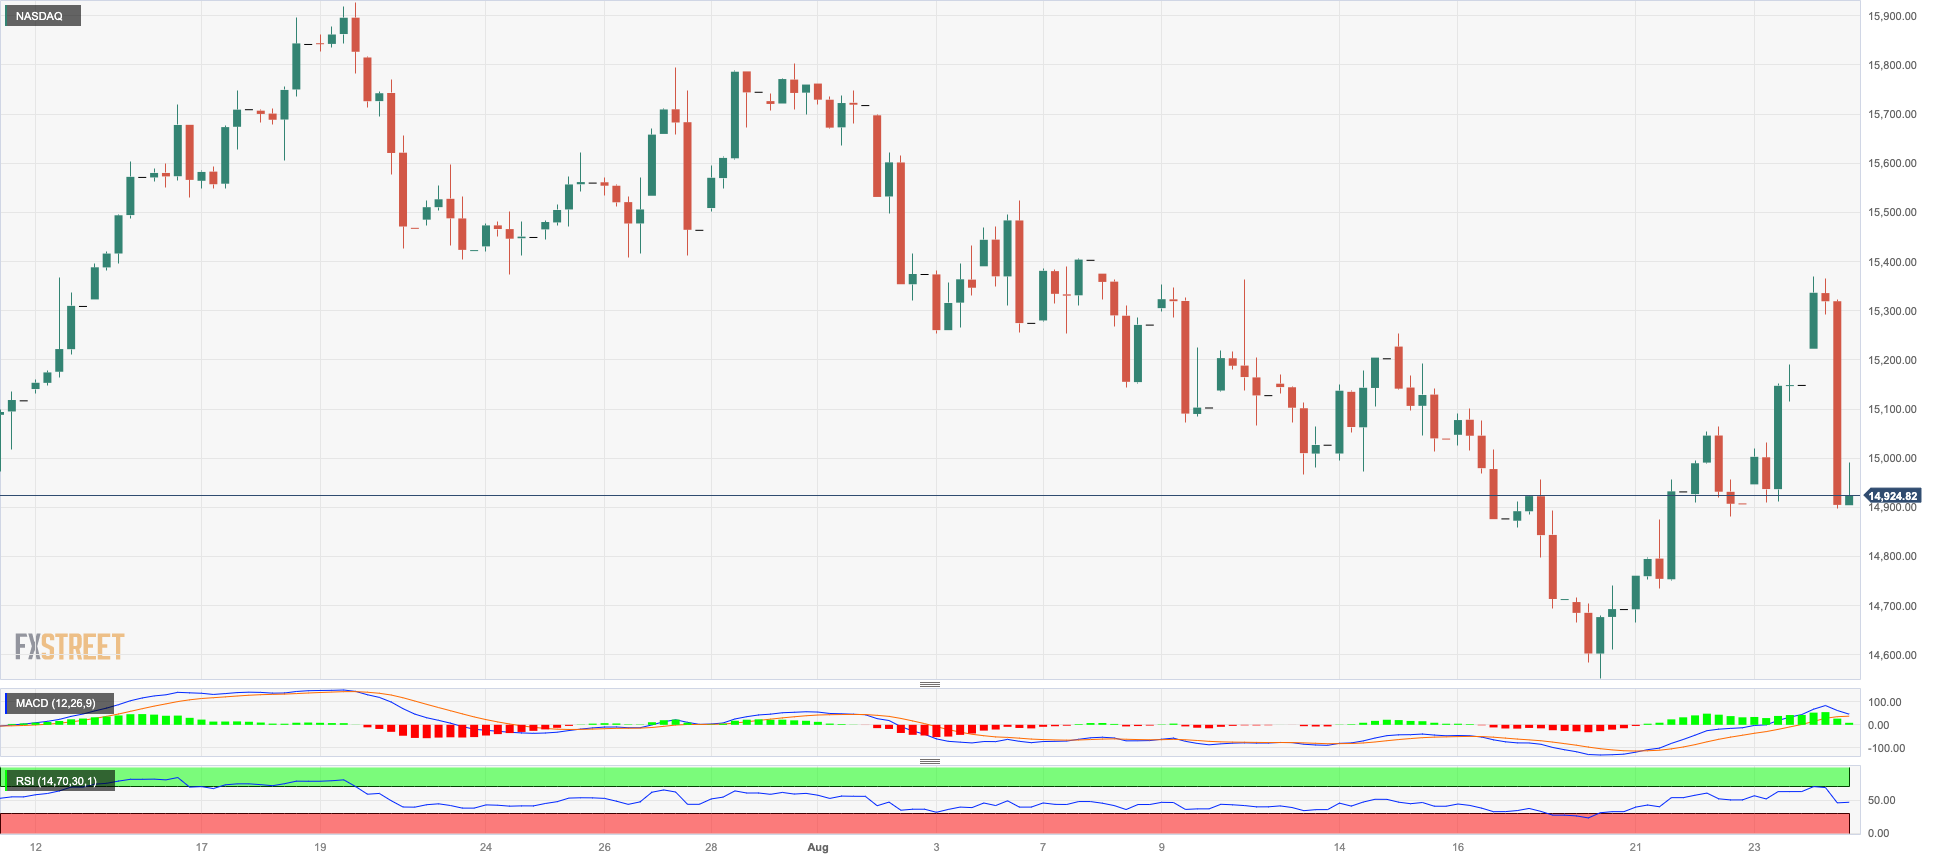
In line with its US peers, the Nasdaq 100 came under downside pressure soon after hitting new two-week peaks near 15300 on Thursday.
Indeed, the early NVIDIA-driven move higher quickly ran out of steam and forced the tech index to not only give away those gains but also recede to two-day lows near 14900.
In the meantime, sentiment in the tech sector remained sour on the back of the robust bounce in the greenback, which was accompanied by a decent rebound in US yields across the curve, all ahead of the key speech by Fed Chairman Powell at the Jackson Hole Symposium at the end of the week.
If sellers regain control, the Nasdaq 100 could revisit the August low of 14557 (August 18), which is slightly ahead of the transitory 100-day SMA at 14377. The weekly low of 14283 (June 7) follows next before the weekly low of 13520 (May 24), the 200-day SMA of 13120, and the April low of 12724 (April 25). Having said that, the index faces the immediate up barrier at the weekly top of 15803 (July 31), seconded by the 2023 peak of 15932 (July 19) and the round mark of 16000. The daily RSI deflated to the proximity of 45.
Top Gainers: NVIDIA, Autodesk, PDD Holdings DRC
Top Losers: Dollar Tree, Enphase, AMD
Resistance levels: 15279 15795 15932 (4H chart)
Support levels: 14557 14293 13520 (4H chart)
DOW JONES
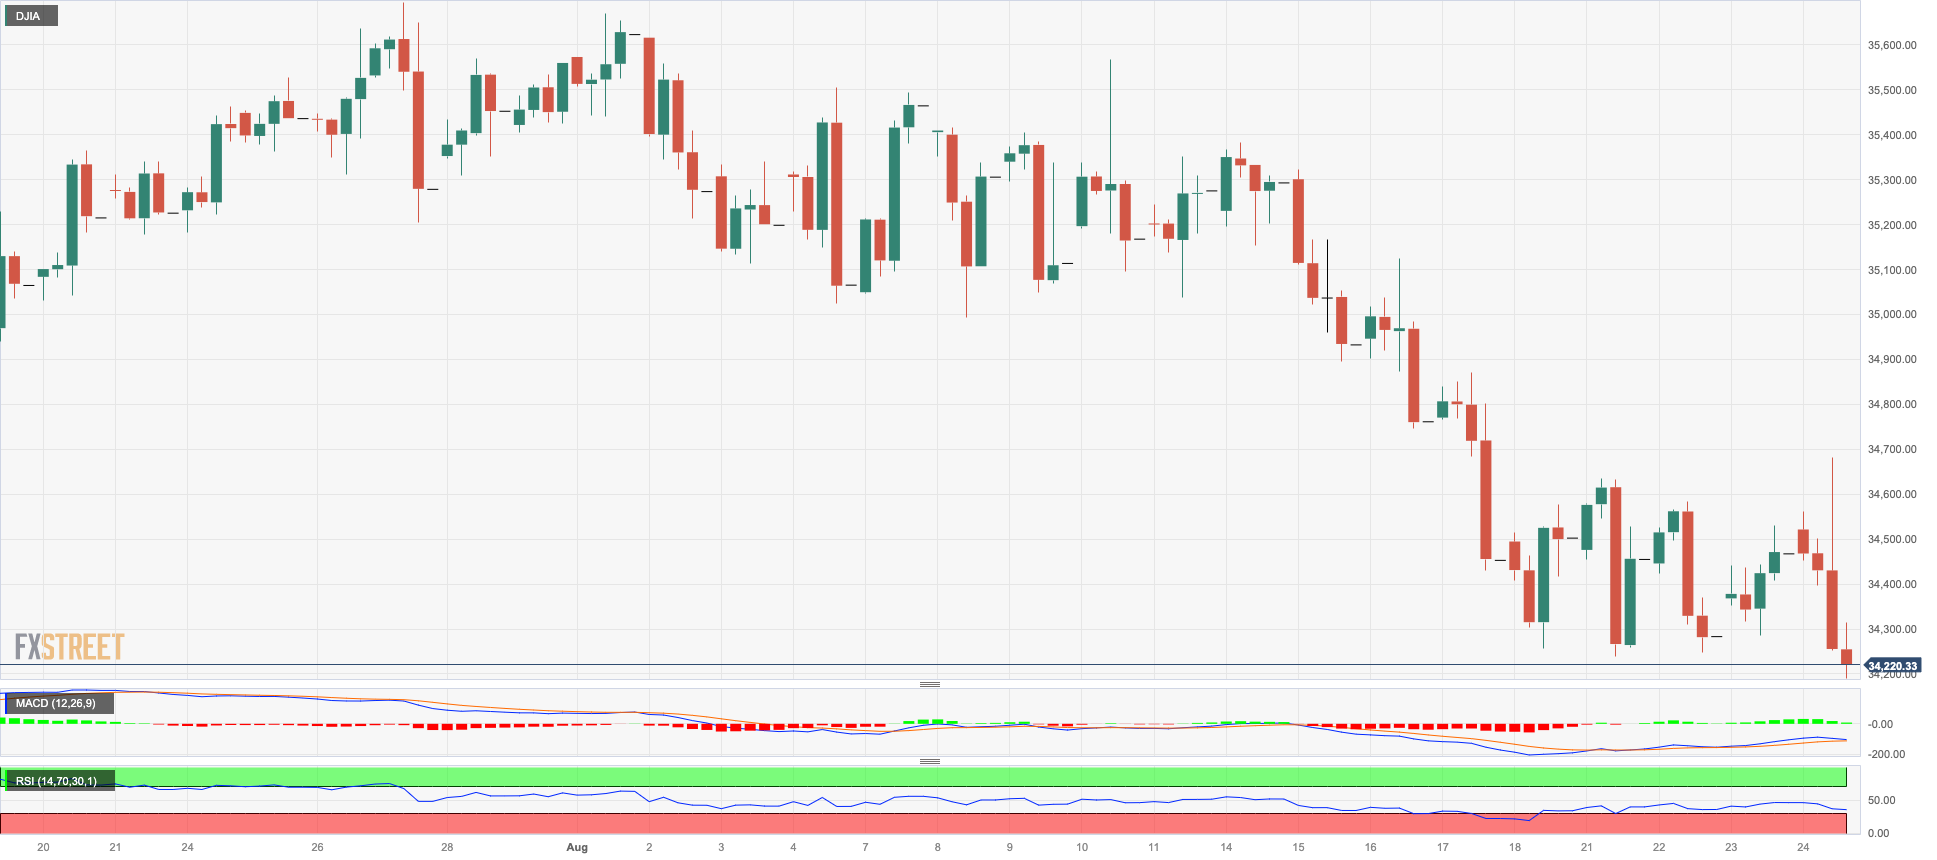
US equities tracked by the Dow Jones could not sustain the earlier bull run to weekly tops near the 34700 region and came all the way down to end the session with modest losses below the 34300 mark.
In fact, rising prudence ahead of the speech by Chair Powell at the Jackson Hole event on Friday reignited the Fed’s tighter-for-longer narrative and somewhat halted the initial optimism following NVIDIA’s over-the-top earnings results.
Overall, the Dow Jones retreated 0.60% to 34266, the S&P500 lost 0.71% to 4404, and the tech-reference Nasdaq Composite dropped 1.02% to 13578.
If the Dow Jones continues its downward movement, the 100-day SMA at 34104 should provide a temporary stop before the July low of 33705 (July 10), a region supported by the 200-day line SMA at 33728. If the latter is broken, the May low of 32586 (May 25) will be targeted before the 2023 low of 31429 (March 15). By contrast, the immediate hurdle is the 2023 high of 35679 (August 1) ahead of the February 2022 top of 35824 (February 9) and the all-time peak of 36952 (January 5, 2022). The daily RSI retreated below 38.
Top Performers: Dow, Travelers, Verizon
Worst Performers: Boeing, Walgreen Boots, Walt Disney
Resistance levels: 34694 35112 35679 (4H chart)
Support levels: 34248 34090 33705 (4H chart)
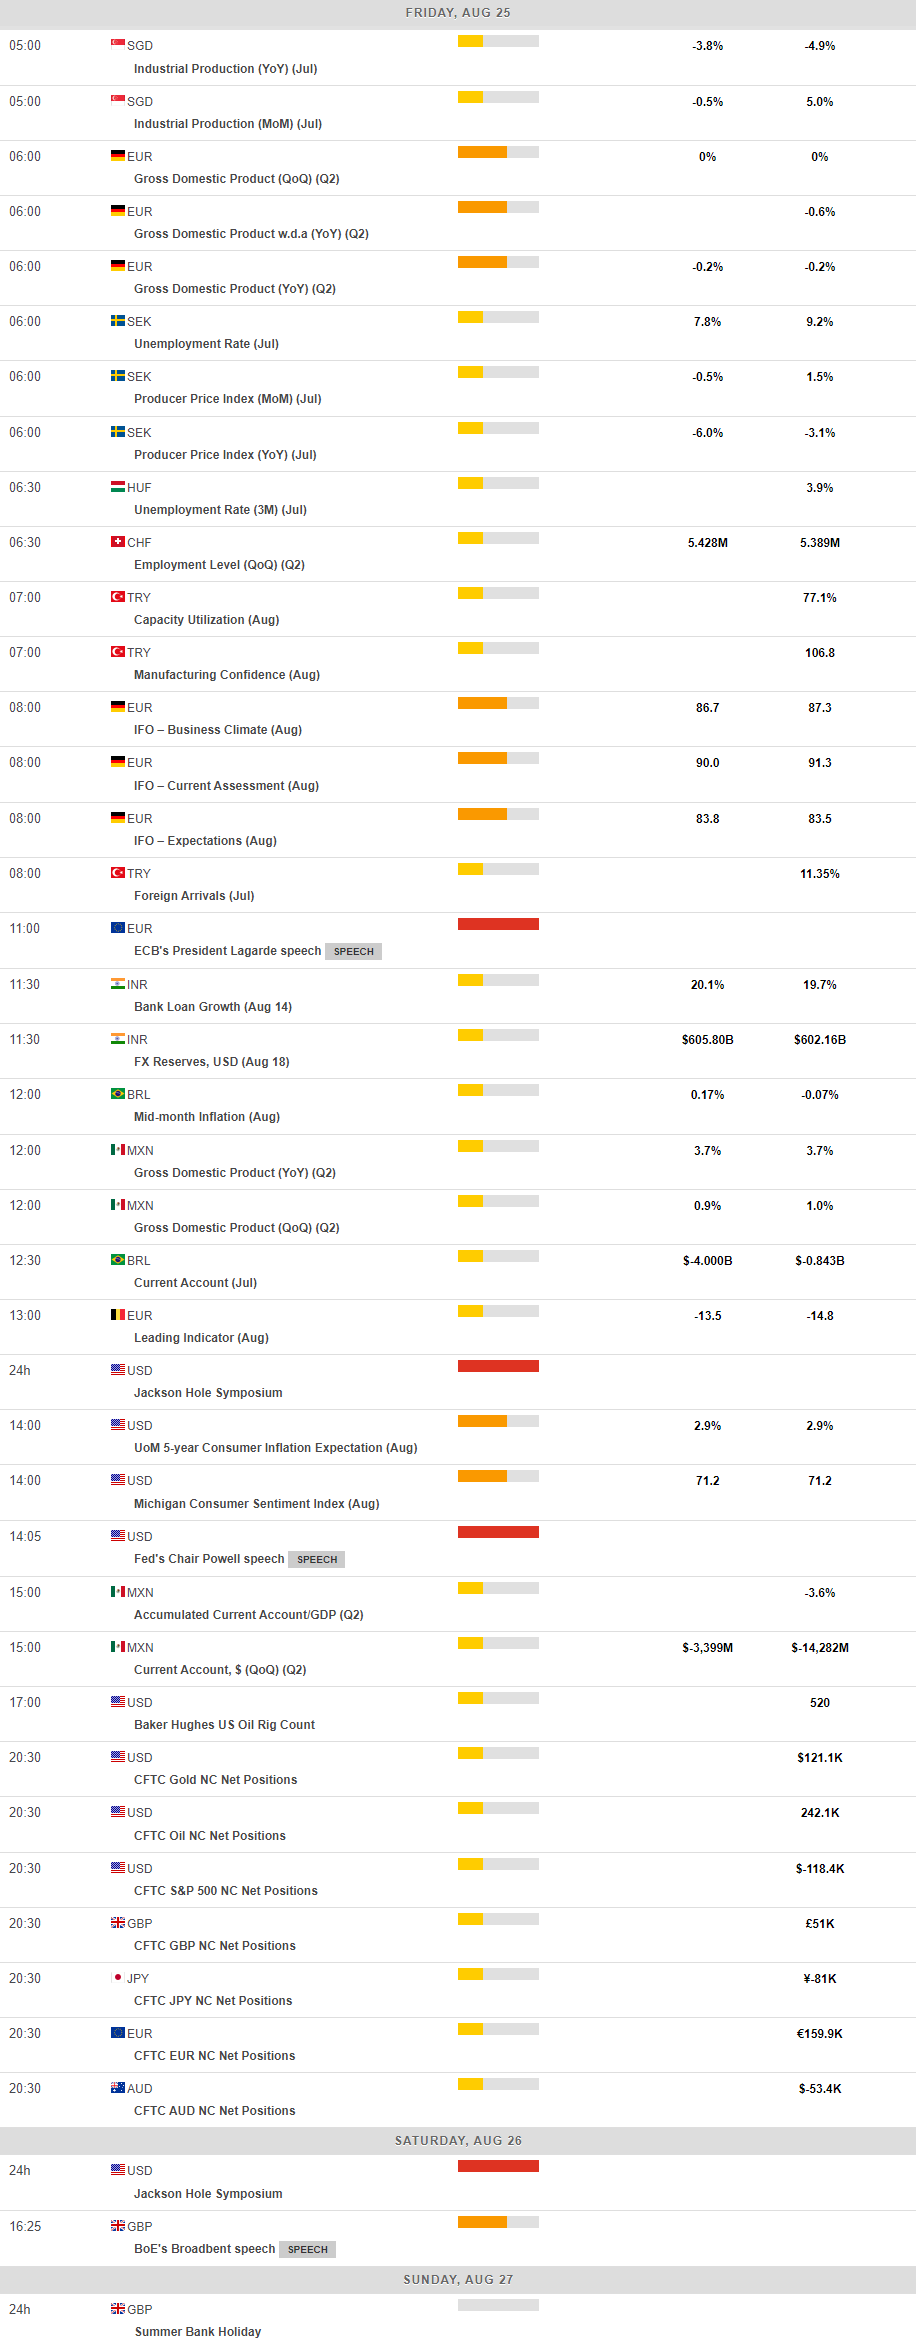
MACROECONOMIC EVENTS
All Information & Updates provided by:

All information relating to the financial markets available on this page has been prepared and issued by FXStreet (Forexstreet SL, Spain, Reg: B62498233) on the basis of publicly available information and all information believed to be reliable and does not conflict with Kuwaiti local laws, and all necessary care has been taken to before the company to ensure that the facts mentioned are correct from the source.
NCM Investment nor any of its directors or employees shall in any way be held responsible for the contents of this news, and the information contained on this page is intended only to provide clients with publicly available information and should not be construed as investment advice, report or analysis and/or constitute an offer or invitation to buy or sell financial instruments of any kind.
RISK WARNING: Forex and CFDs are highly risky leveraged products, as losses can exceed deposits. Please ensure you understand all the risks and take independent advice if necessary. NCM will segregate the clients based on the criteria of the regulator and its bylaws. NCM does not provide any advisory service; the material published does not constitute advice or a recommendation for a transaction in any financial instrument. NCM accepts no responsibility for any use of the content presented and any consequences of that use. Anyone acting on the information provided does so at their own risk.