
- Contact Us:
-

-

-

-


Daily Market Updates
28 Aug 2023
USDJPY
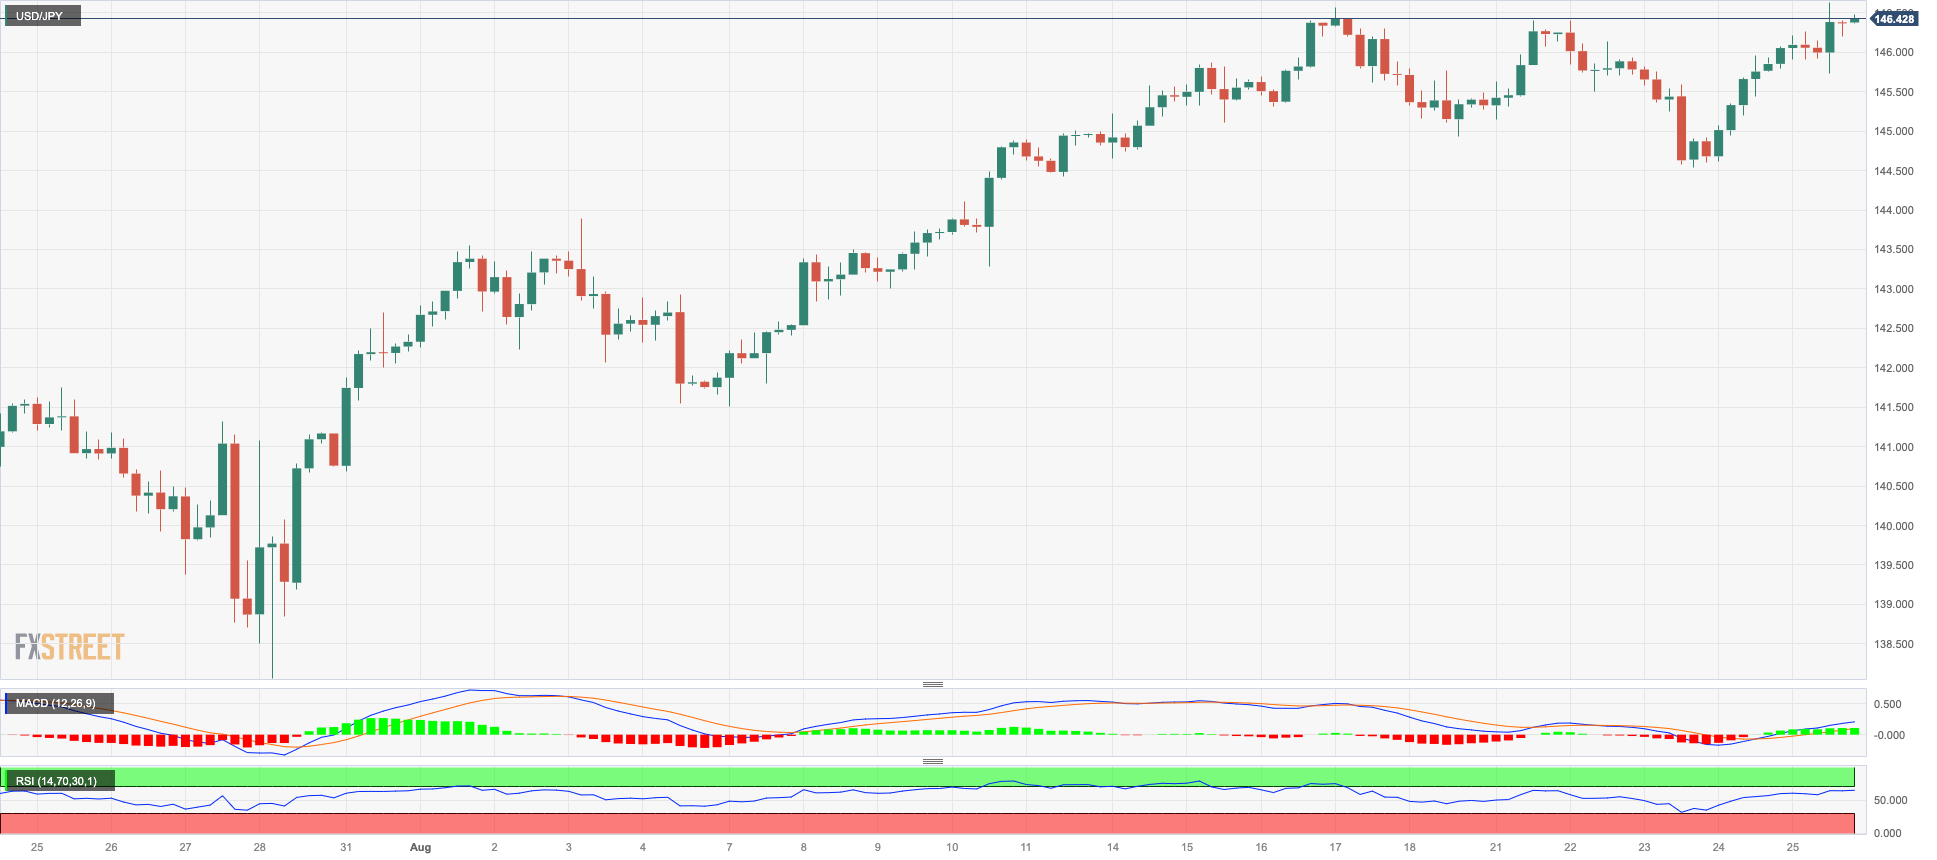
USD/JPY added to the optimism seen in the latter part of the week and advanced to new yearly highs around 146.60, an area last seen in early November 2022.
The continuation of the upward bias in the dollar in combination with further gains in US yields on the short end and the belly of the curve were enough to keep the pair on the positive side for the second session in a row on Friday.
In the Japanese bond market, the JGB 10-year reference yields settled around the 0.65% region, marginally up from Thursday’s close.
There were no noteworthy data releases in the Japanese docket at the end of the week.
The 2023 high of 146.63 (August 25) is the next upward barrier for USD/JPY, followed by the 2022 high of 151.94 (October 21). Instead, the weekly low of 144.53 (August 23) emerges as the immediate contention before the provisional 55-day SMA at 142.62 and the August low at 141.50 (August 7). If this level is broken, the pair may fall to the weekly low of 138.05 (July 28), then to the July low of 137.23 (July 14), and finally to the 200-day SMA of 136.66. A steeper slide may put the weekly low of 133.01 (April 26) in jeopardy, as well as the minor level of 132.01 (April 13) and the April low of 130.62 (April 5). On the daily chart, the RSI rose north of the 63 region.
Resistance levels: 146.63 147.56 148.44 (4H chart)
Support levels: 144.53 143.25 142.28 (4H chart)
GBPUSD
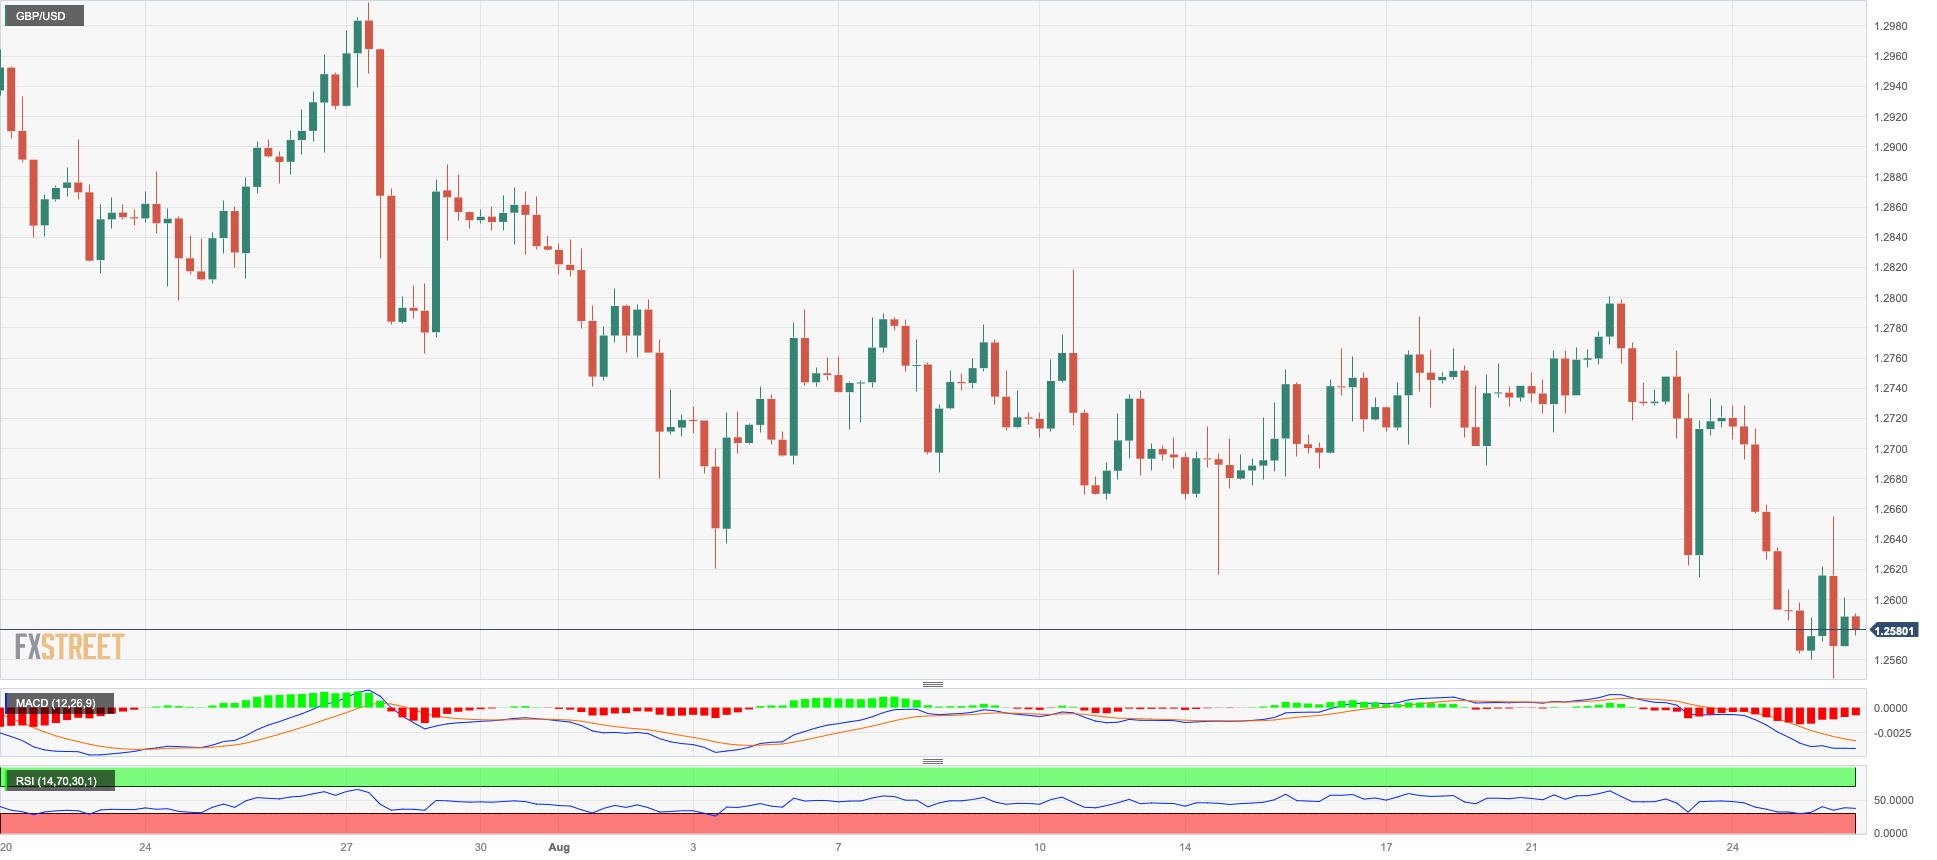
GBP/USD dropped for the fourth session in a row and intensified the weekly decline to levels last seen in mid-June around 1.2550, always on the back of the strong performance of the greenback.
On the latter, the lack of surprises at Powell’s speech at the Jackson Hole event lent extra legs to the buck and sponsored fresh tops in the USD Index (DXY) well north of 104.00 the figure. The uptick in the dollar also appeared propped up by speculation of a potential rate hike at the November gathering.
In the UK data space, Consumer Confidence improved to -25 for the month of August (from -30), according to Gfk.
If GBP/USD breaks below the August low of 1.2547 (August 25), it could subsequently challenge the 2021-2023 trendline around 1.2440. South of that, the 200-day SMA aligns at 1.2397, seconded by the June low at 1.2368 (June 5) and the May low at 1.2308 (May 25). On the other hand, the weekly high at 1.2818 (August 10) is followed by another weekly top at 1.2995 (July 27), which is just before the critical barrier of 1.3000. Once the pair clears the 2023 high of 1.3142 (July 14), the weekly peaks of 1.3146 (April 14, 2022) and 1.3298 (March 15, 2022) become relevant. The RSI on the daily deflated to the vicinity of 34.
Resistance levels: 1.2654 1.2707 1.2800 (4H chart)
Support levels: 1.2547 1.2486 1.2440 (4H chart)
AUDUSD
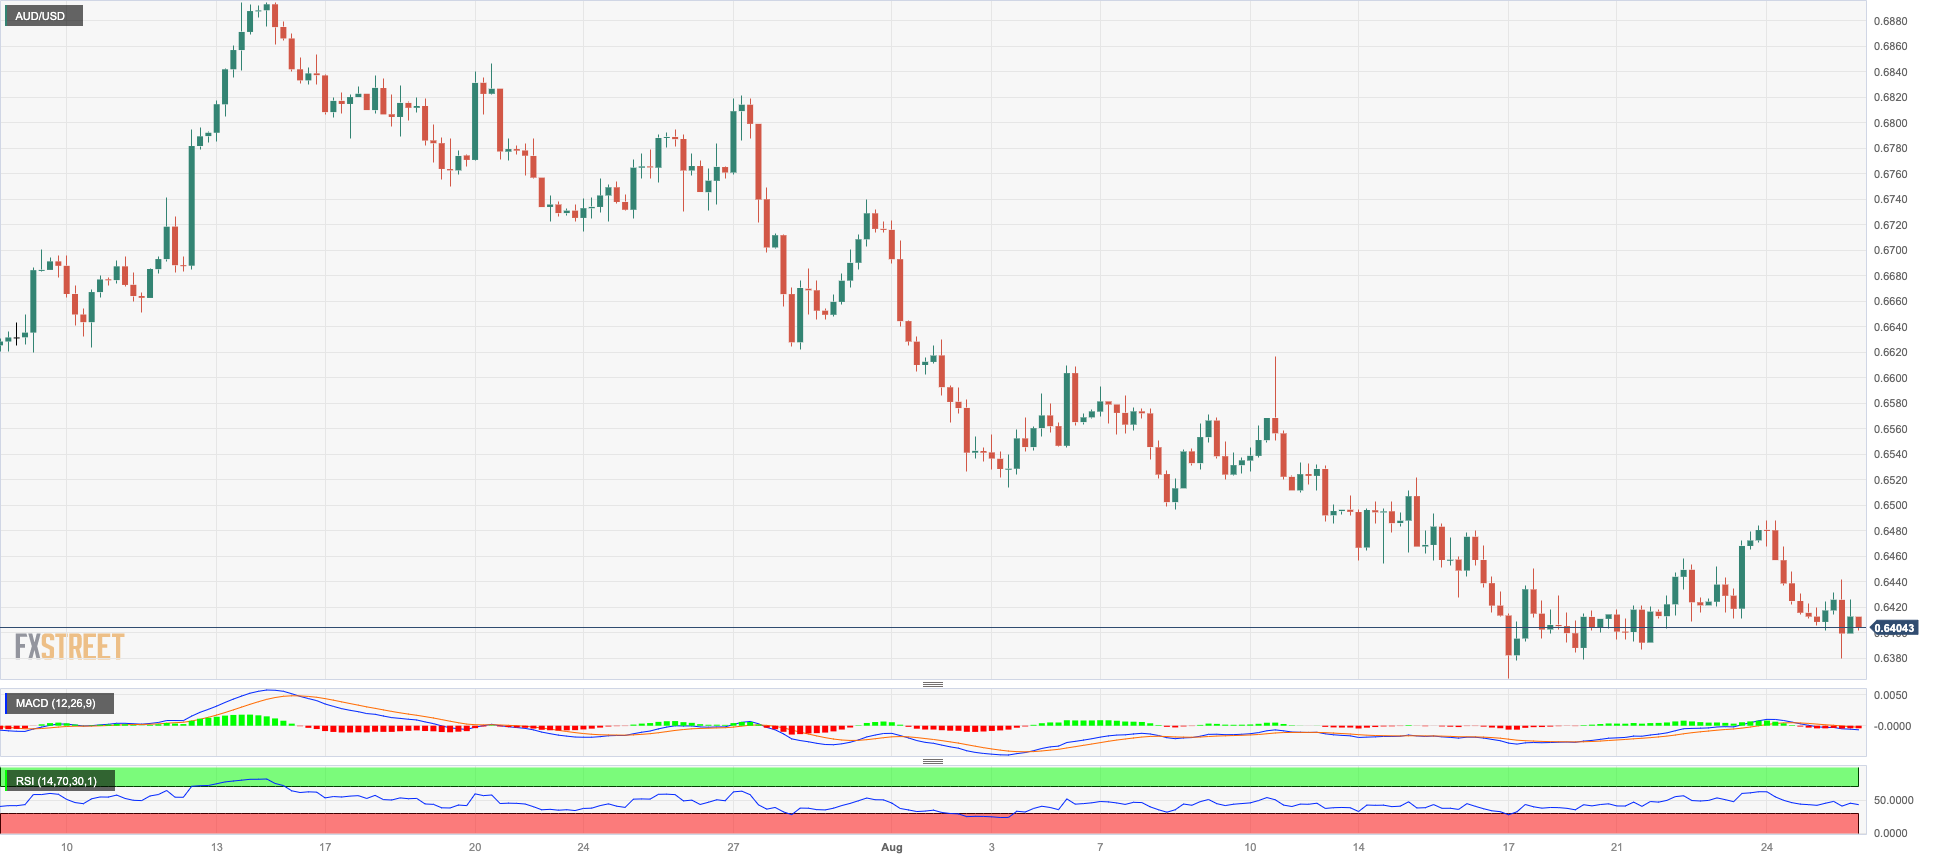
In line with the rest of the risk-linked galaxy, the Aussie dollar succumbed to intense upside momentum in the greenback and sponsored the second straight daily pullback in AUD/USD, which revisited the sub-0.6400 region once again on Friday.
Fears of further tightening by the Federal Reserve seem to have been reignited after Powell’s speech at the Symposium in Wyoming, which ultimately underpinned extra gains in the buck and favoured some selling bias in the commodity space.
The Australian calendar was empty on Friday.
Despite the rebound seen in the first half of the week, the AUD /USD remains under pressure. Against this backdrop, the next key support is at the 2023 low of 0.6364 (August 17) prior to the November 2022 low of 0.6272 (November 7) and the 2022 low of 0.6179 (October 13). On the other hand, there is a first up-barrier at the weekly high of 0.6616 (August 10) ahead of the 0.6650 region, where the preliminary 100-day and 55-day SMAs coincide. Once above this region, the pair could tackle the 200-day SMA at 0.6726 before reaching the July top of 0.6894 (July 14) and the June peak at 0.6899 (June 16). The crucial 0.7000 level is next, before the weekly high of 0.7029 (February 14) and the 2023 top of 0.7157 (February 2). The day-to-day RSI slipped back to the 34 region.
Resistance levels: 0.6488 0.6521 0.6616 (4H chart)
Support levels: 0.6379 0.6364 0.6272 (4H chart)
GOLD
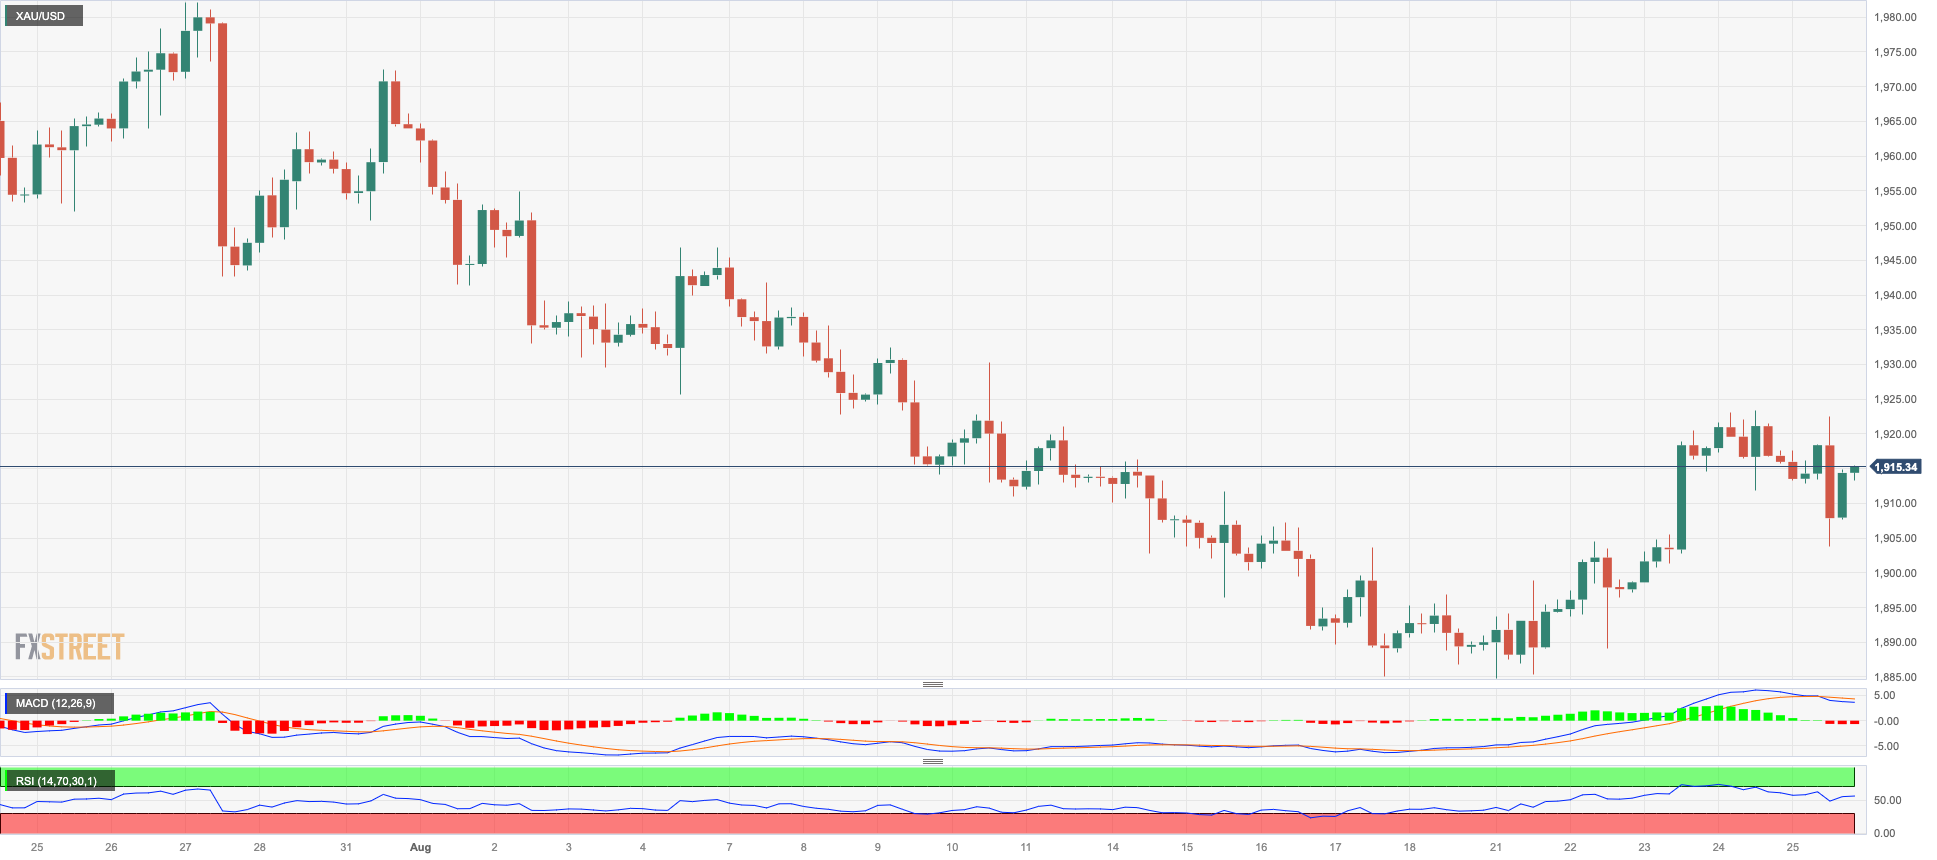
Fresh multi-week tops in the greenback coupled with higher yields in the 2-year/10-year segment of the US curve and renewed speculation of a Fed rate raise (this time at the November 1 gathering) all weighed on the precious metal at the end of the week.
That said, bullion halted a six-day positive streak that lifted the yellow metal back above the key $1900 mark per troy ounce after receding to monthly lows near $1880 recorded in past sessions.
Moving forward, the non-yielding metal should keep monitoring the upcoming releases of key fundamentals, namely US CPI and Nonfarm Payrolls, for a clearer direction in its price action in the relatively short term.
If the recovery accelerates, gold prices will confront the next test at the intermediate 55-day and 100-day SMAs of $1932 and $1957, respectively. Furthermore, the July high of $1987 is a significant hurdle to cross, just ahead of the psychological $2000 mark. The latter's breakout might clear the path for a test of the 2023 high at $2067 (May 4), then the 2022 top at $2070 (March 8) and the all-time peak at $2075 (August 7, 2020). On the contrary, the August low of $1884 provides immediate support before the 2023 low of $1804 (February 28) and the key support zone of $1800.
Resistance levels: $1923 $1936 $1946 (4H chart)
Support levels: $1884 $1809 $1804 (4H chart)
CRUDE WTI
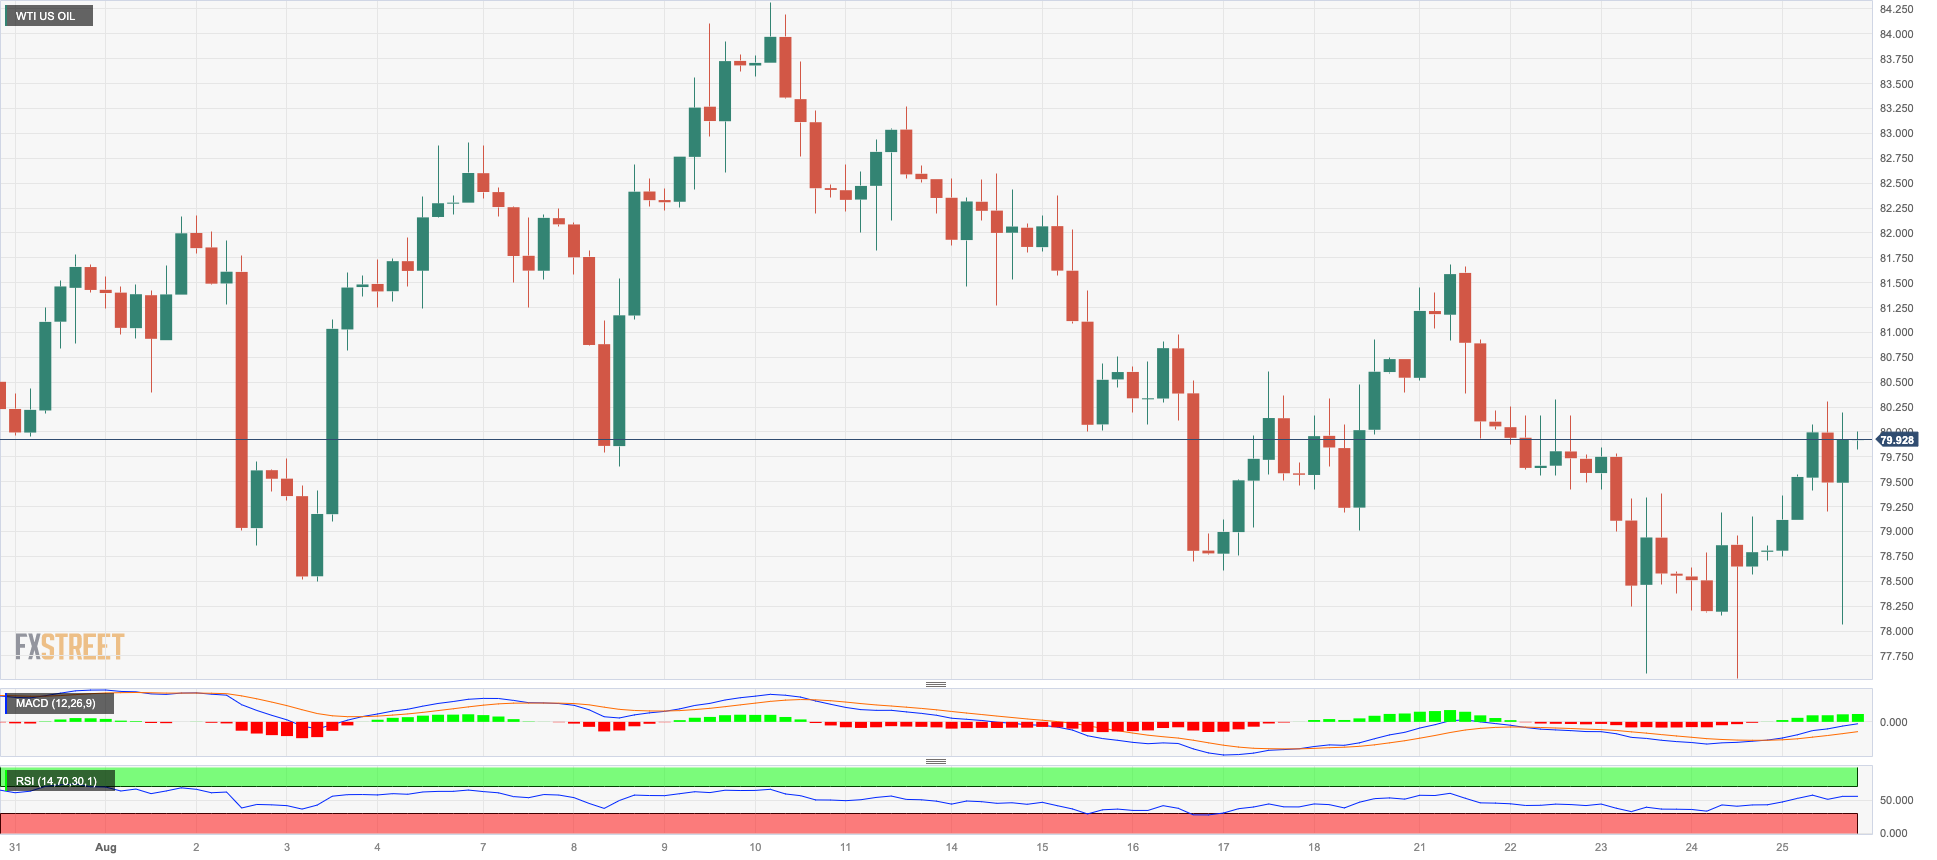
The prices of WTI built on Thursday’s gains and revisited once again the area above the key $80.00 mark per barrel on Friday, although they closed just below it.
Crude oil prices managed to record decent gains on Friday despite the strong dollar, firmer chatter surrounding the Fed’s tighter-for-longer stance, and news that Iran could see its crude oil output boosted by the end of next month.
On the calendar, the total number of US active oil rigs went down by 8 to 512 in the week ended on August 25, according to driller Baker Hughes.
In case the recovery becomes more serious, the next upward obstacle for WTI appears to be the 2023 high of $84.85 (August 10) prior to the November 2022 top of $93.73 (November 7) and before the weekly peak of $97.65 (August 30, 2022). The other way around, initial support emerges at the August low of $77.64 (August 24), which is above the 200-day SMA of $76.02. South of this region are the weekly lows of $73.89 (July 17), $66.86 (June 12), and $63.61 (May 4), as well as the 2023 low of $63.61 (May 4). A deeper retracement may cause prices to challenge the December 2021 low of $62.46 (December 2) ahead of the critical $60.00 mark per barrel.
Resistance levels: $80.42 $81.69 $83.77 (4H chart)
Support levels: $77.56 $73.81 $72.64 (4H chart)
GER40
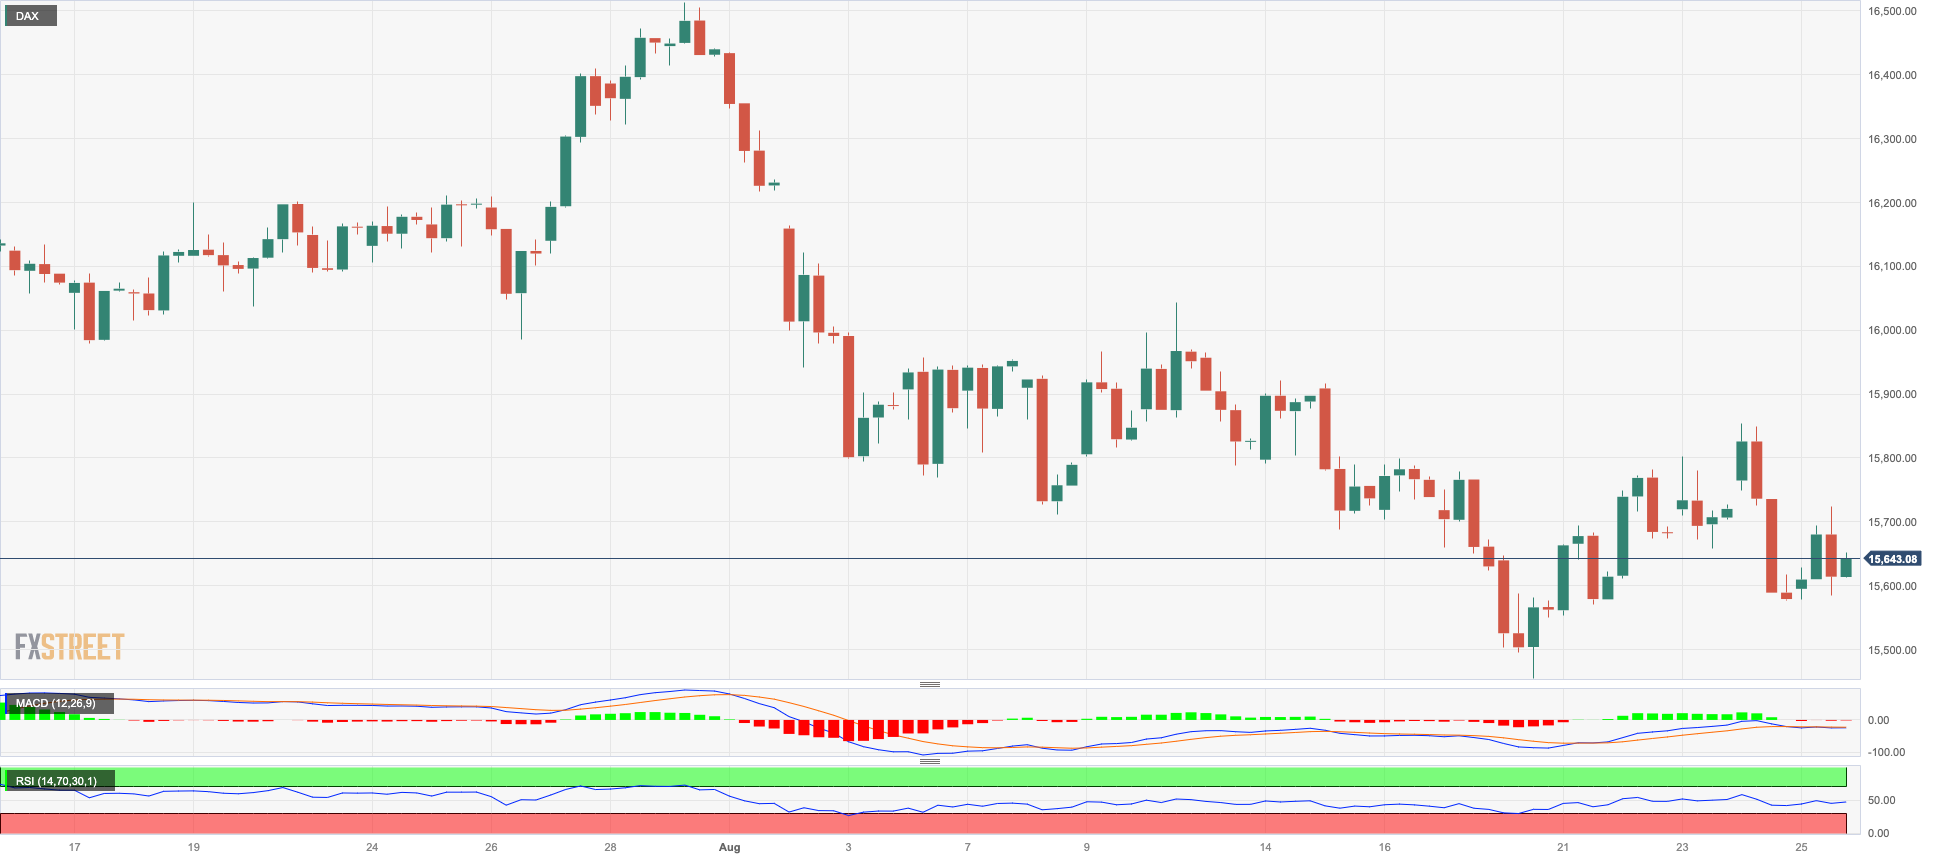
When measured by the reference DAX40, German equities concluded the week with small gains, advancing for the first time following three weeks of falls.
In fact, the index remained cautious ahead of the speeches by Fed Powell and ECB Lagarde at the Jackson Hole event later on Friday.
However, discouraging prints from the German Business Climate tracked by the IFO Institute for the month of August (in collaboration with gloomy flash PMIs) seem to have reignited recession fears in the region, along with expectations of a pause by the ECB at its meeting next month.
In addition, the modest advance in the index was accompanied by another positive session in the 10-year bund yields, which approached the 2.60% level.
Additional DAX40 gains should target the weekly high of 15896 (August 24) ahead of the temporary 55-day SMA at 15894 and another weekly top of 16060 (August 10). The breakout of this level could put a potential test of the all-time high of 16528 (July 31) back on the radar. Just the opposite, the August low of 15468 (August 18) offers immediate contention prior to the July low of 15456 (July 7) and the crucial 200-day SMA of 15411. If the index falls below this level, it could confront the March low of 14458 (March 20) before hitting the December 2022 low of 13791 (December 20) and the 2022 low of 11862 (September 28). The daily RSI edged a tad higher past 40.
Best Performers: E.ON SE, Beiersdorf AG, Symrise AG
Worst Performers: Covestro, Continental AG, Sartorius AG VZO
Resistance levels: 15896 16060 16528 (4H chart)
Support levels: 15468 15456 14809 (4H chart)
NASDAQ
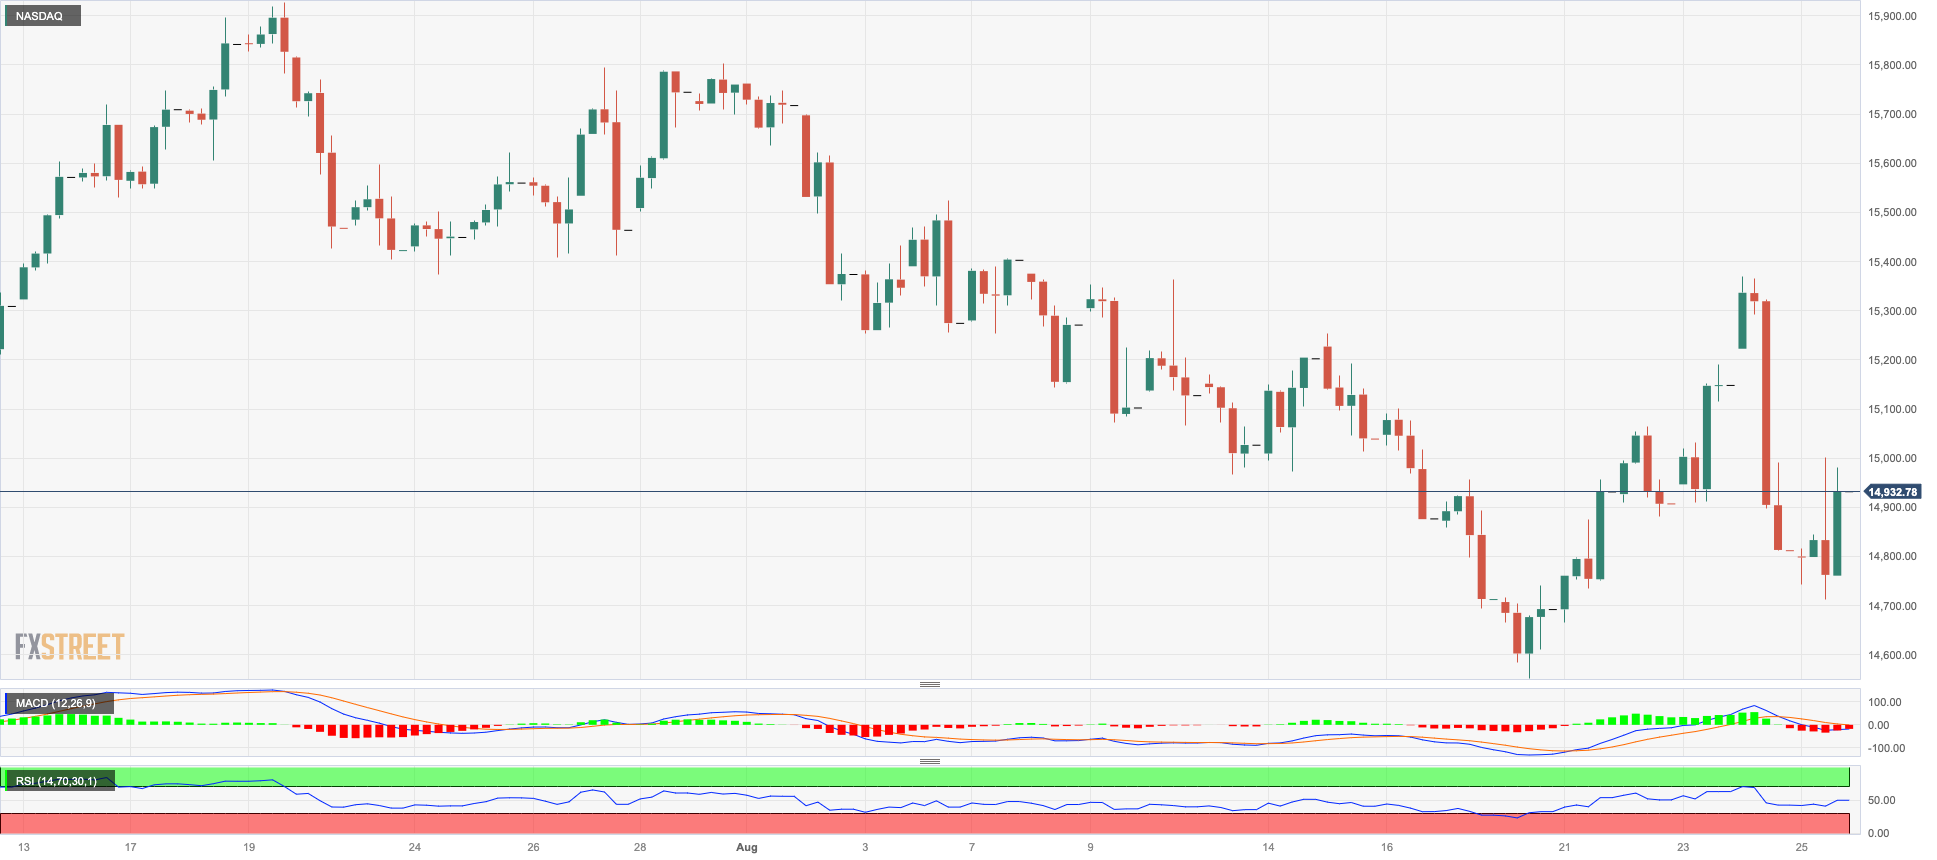
US tech equities measured by the Nasdaq 100 index reversed part of Thursday’s strong decline and closed Friday’s session near the 15000 yardstick. The uptick was enough to allow the index to reverse three consecutive weeks closing in the red territory.
In fact, the index managed to by-pass the stronger dollar, higher US yields across the curve, renewed market chatter around a potential rate hike as soon as the November 1 meeting and the marked pullback in megacap chip maker NVIDIA.
If sellers retake control, the Nasdaq 100 might return to its August low of 14557 (August 18), which is just above the transitory 100-day SMA at 14392. Following that is the weekly low of 14283 (June 7), the weekly low of 13520 (May 24), the 200-day SMA of 13120, and the April low of 12724 (April 25). On the opposite side, the index confronts an immediate uphill battle at the weekly high of 15279 (August 24) prior to another weekly top at 15803 (July 31), and the 2023 high of 15932 (July 19), all ahead of the round mark of 16000. The daily RSI ticked higher to the boundaries of 46.
Top Gainers: Workday, Intuitive Surgical, Intuit
Top Losers: Marvell, Warner Bros Discovery, NVIDIA
Resistance levels: 15279 15795 15932 (4H chart)
Support levels: 14715 14557 14376 (4H chart)
DOW JONES
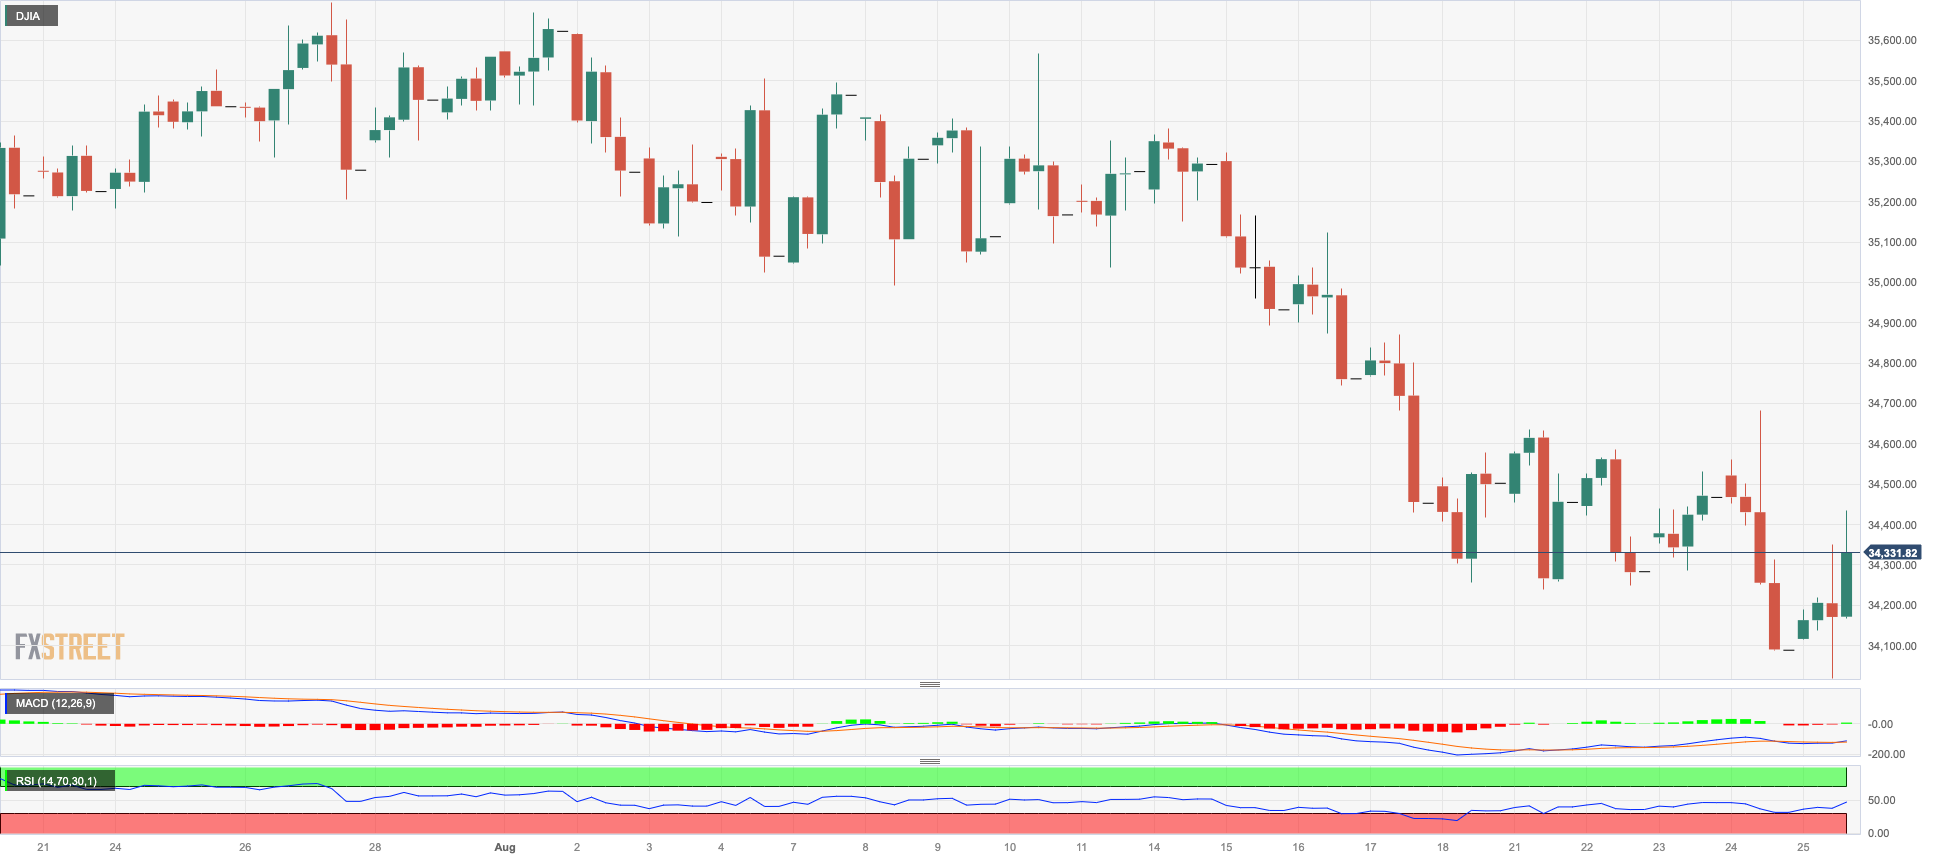
US stocks measured by the Dow Jones partially recovered ground lost in the previous session and charted marked gains on Friday. Despite the daily uptick, the benchmark index closed its second straight week with losses.
Gains in US equities came despite the fact that Chair Powell delivered no news at his speech at Jackson Hole, where he reiterated the Fed’s readiness to tighten its policy further in case inflation proves to be stickier than anticipated, as well as the data-dependent stance when it comes to deciding about interest rates.
All in all, the Dow Jones gained 0.73% to 34346, the S&P500 rose 0.67% to 4405, and the tech-reference Nasdaq Composite advanced 0.96% to 13590.
The breach of the August low of 34029 (August 25) could put the Dow Jones en route to challenge the key 200-day SMA at 33734 ahead of the July low of 33705 (July 10). Further down comes the May low of 32586 (May 25) before the 2023 low of 31429 (March 15 ). Having said that, there is an initial resistance at the 2023 high of 35679 (August 1), seconded by the February 2022 top of 35824 (February 9) and the all-time peak of 36952 (January 5, 2022). The daily RSI rose past the 41 hurdle.
Top Performers: Boeing, Intel, Salesforce Inc
Worst Performers: Walgreen Boots, Travelers, JPMorgan
Resistance levels: 34694 35068 35679 (4H chart)
Support levels: 34029 33705 32586 (4H chart)
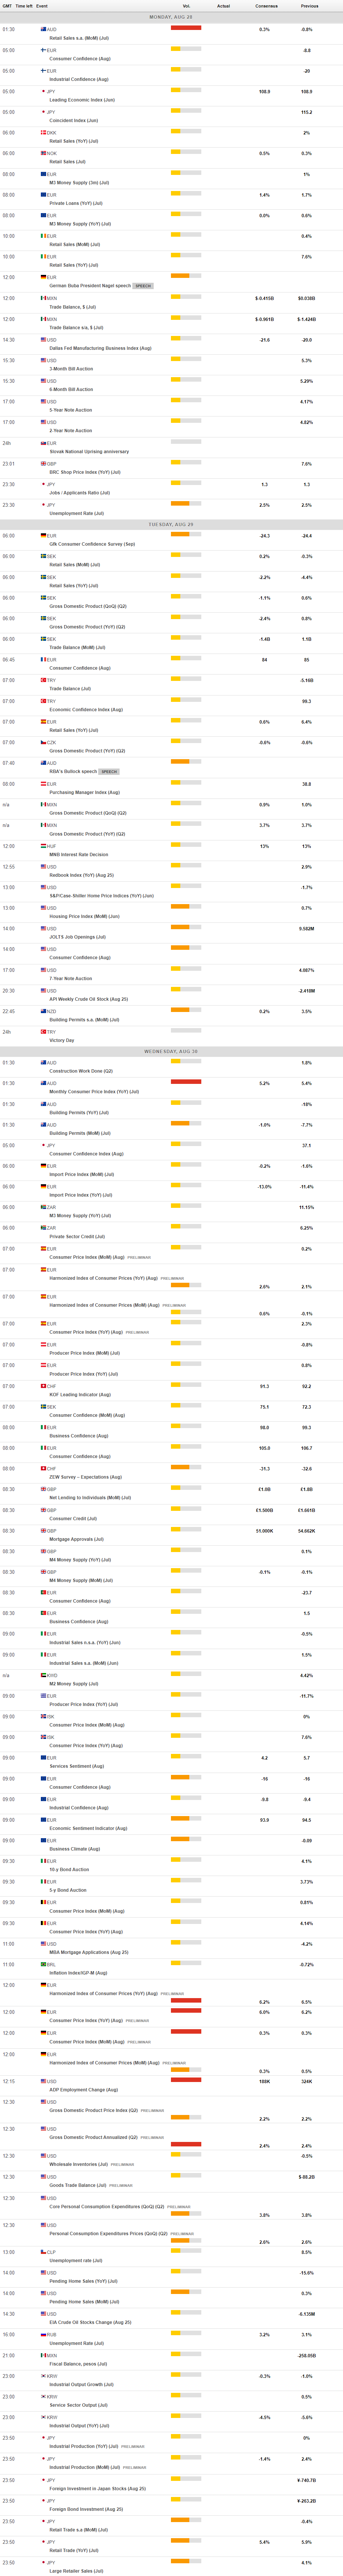
MACROECONOMIC EVENTS
All Information & Updates provided by:

All information relating to the financial markets available on this page has been prepared and issued by FXStreet (Forexstreet SL, Spain, Reg: B62498233) on the basis of publicly available information and all information believed to be reliable and does not conflict with Kuwaiti local laws, and all necessary care has been taken to before the company to ensure that the facts mentioned are correct from the source.
NCM Investment nor any of its directors or employees shall in any way be held responsible for the contents of this news, and the information contained on this page is intended only to provide clients with publicly available information and should not be construed as investment advice, report or analysis and/or constitute an offer or invitation to buy or sell financial instruments of any kind.
RISK WARNING: Forex and CFDs are highly risky leveraged products, as losses can exceed deposits. Please ensure you understand all the risks and take independent advice if necessary. NCM will segregate the clients based on the criteria of the regulator and its bylaws. NCM does not provide any advisory service; the material published does not constitute advice or a recommendation for a transaction in any financial instrument. NCM accepts no responsibility for any use of the content presented and any consequences of that use. Anyone acting on the information provided does so at their own risk.