
- Contact Us:
-

-

-

-


Daily Market Updates
29 Aug 2023
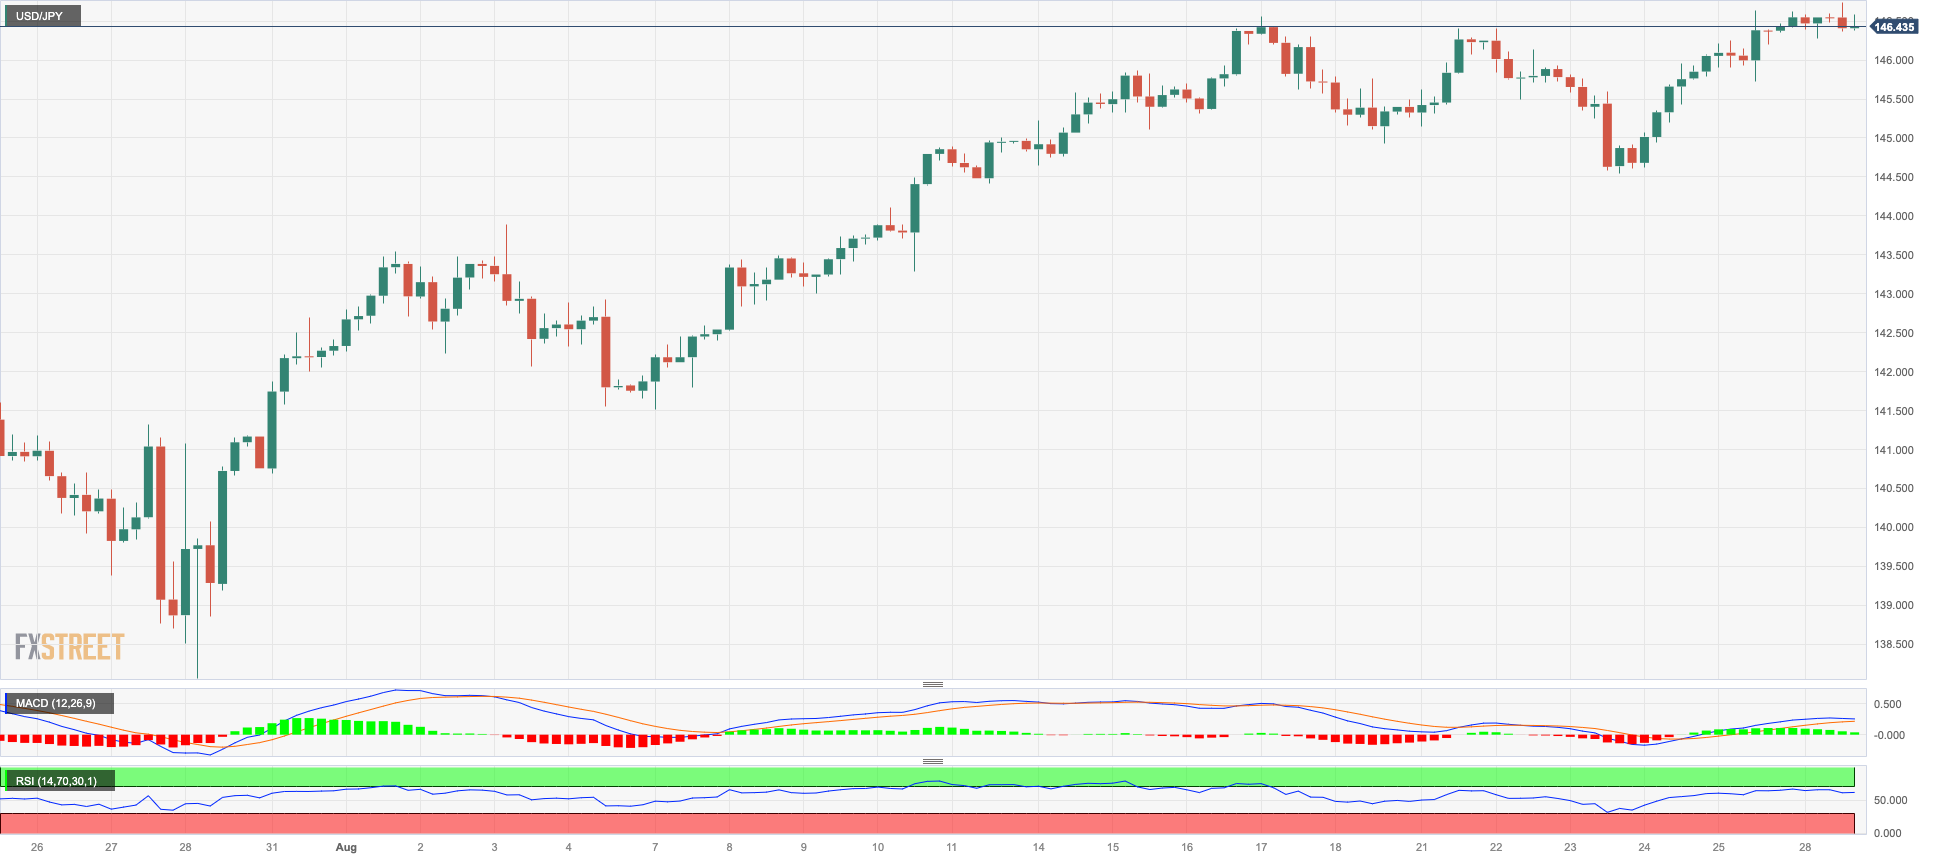
USDJPY
USD/JPY added to the ongoing recovery and flirted with recent 2023 peaks around 146.60 at the beginning of the week.
The move higher in the pair came despite the corrective decline in the buck as well as renewed weakness in US yields across different maturities vs. a small uptick in JGB 10-year yields.
From the BoJ, Governor K. Ueda said the need for the continuation of the ultra-accommodative stance appears justified by underlying inflation still running below the bank’s target.
In Japan, final readings for the month of June saw the Coincident Index at 115.1 (from 114.3) and the Leading Economic Index at 108.9 (from 109.1).
The next upward hurdle for USD/JPY is the 2023 high of 146.63 (August 25), followed by the 2022 high of 151.94 (October 21). Instead, the weekly low of 144.53 (August 23) takes precedence over the preliminary 55-day SMA of 142.74 and the August low of 141.50 (August 7). The breakdown of this level may prompt the pair to challenge the weekly low of 138.05 (July 28), ahead of the July low of 137.23 (July 14), and ultimately the 200-day SMA of 136.68. A deeper retracement might jeopardise the weekly low of 133.01 (April 26), as well as the minor level of 132.01 (April 13) and the April low of 130.62 (April 5). The day-to-day RSI looked stable near 64.
Resistance levels: 146.63 147.56 148.44 (4H chart)
Support levels: 144.53 143.25 142.66 (4H chart)
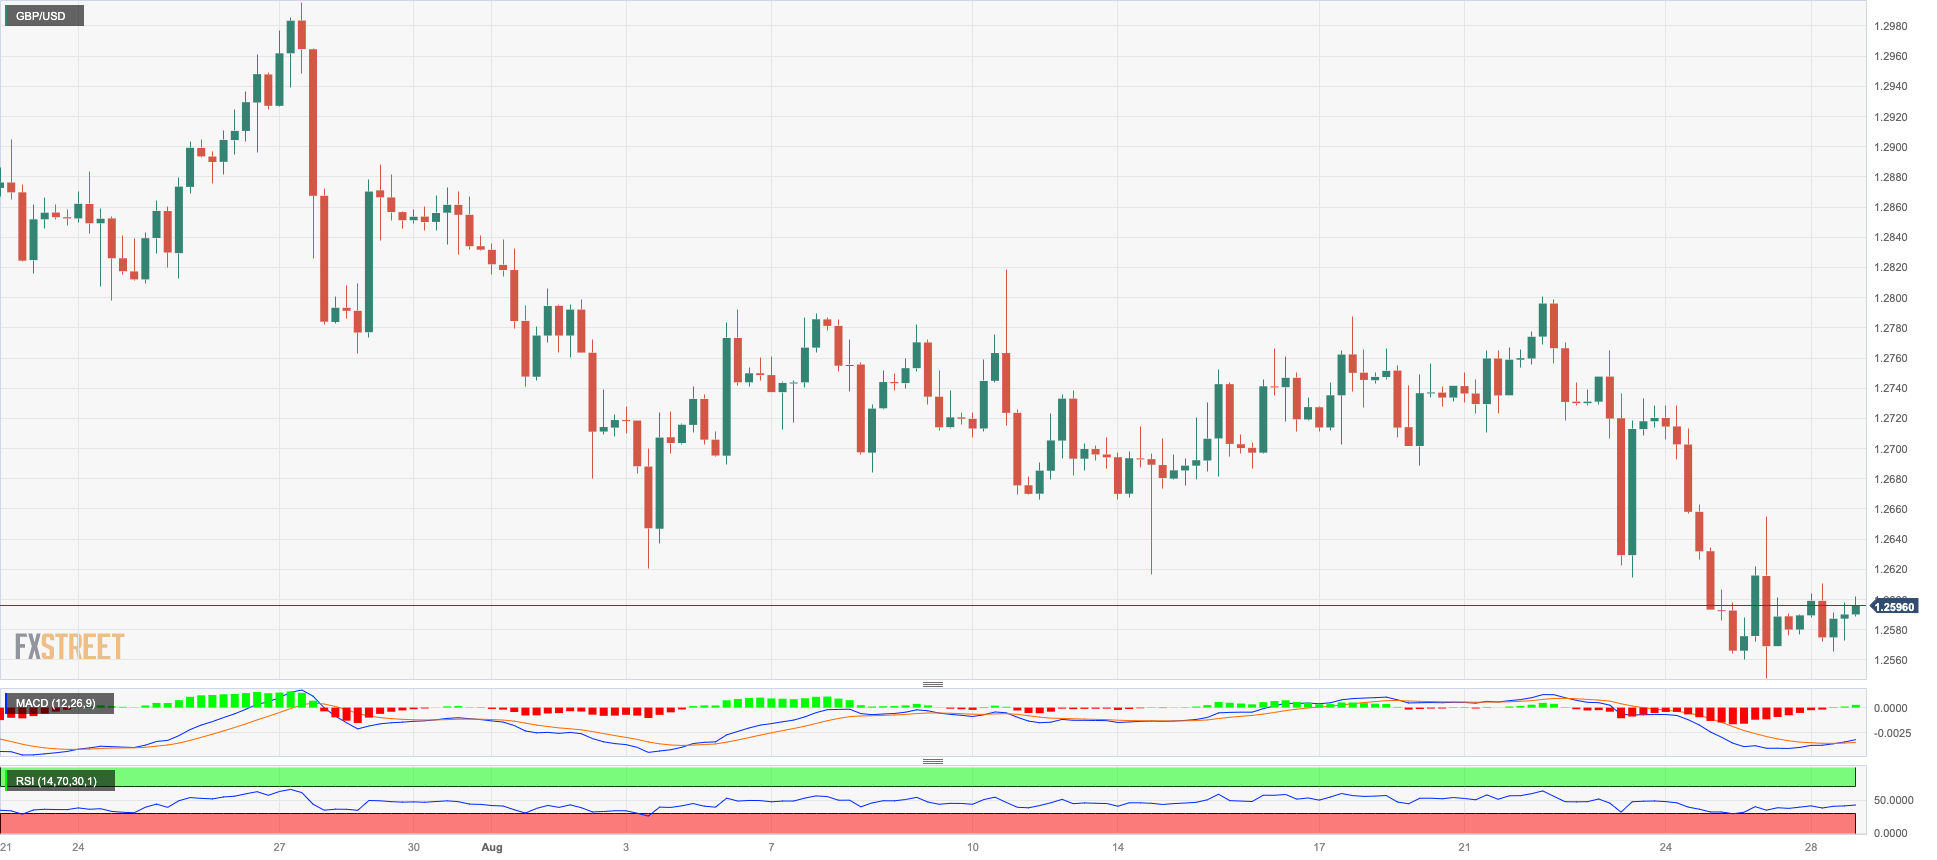
GBPUSD
GBP/USD ended the session with humble gains and just below 1.2600 the figure in an atmosphere of marginal improvement in the risk-linked galaxy on Monday.
Indeed, the greenback’s negative start to the new trading week allowed some rebound in the sterling as investors continued to assess Fed Powell’s comments at the Jackson Hole event on Friday.
Extra legs for the quid might have also turned up after BoE MPC member Broadbent indicated that the bank’s monetary policy stance may well have to stay in restrictive territory for longer.
There were no data releases across the Channel on Monday.
If GBP/USD breaks below the August low of 1.2547 (August 25), it could subsequently challenge the 2021-2023 trendline around 1.2440. South of this is the 200-day SMA at 1.2401 ahead of the June low at 1.2368 (June 5) and the May low at 1.2308 (May 25). On the other hand, there is an interim hurdle at the 55-day SMA at 1.2777 prior to the weekly high at 1.2818 (August 10) and another weekly top at 1.2995 (27 July), which is just before the critical barrier of 1.3000. Once the pair clears the 2023 peak at 1.3142 (14 July), the weekly highs of 1.3146 (April 14, 2022) and 1.3298 (March 15, 2022) become relevant. The RSI on the daily chart improved above the 36 level.
Resistance levels: 1.2654 1.2764 1.2800 (4H chart)
Support levels: 1.2547 1.2486 1.2368 (4H chart)
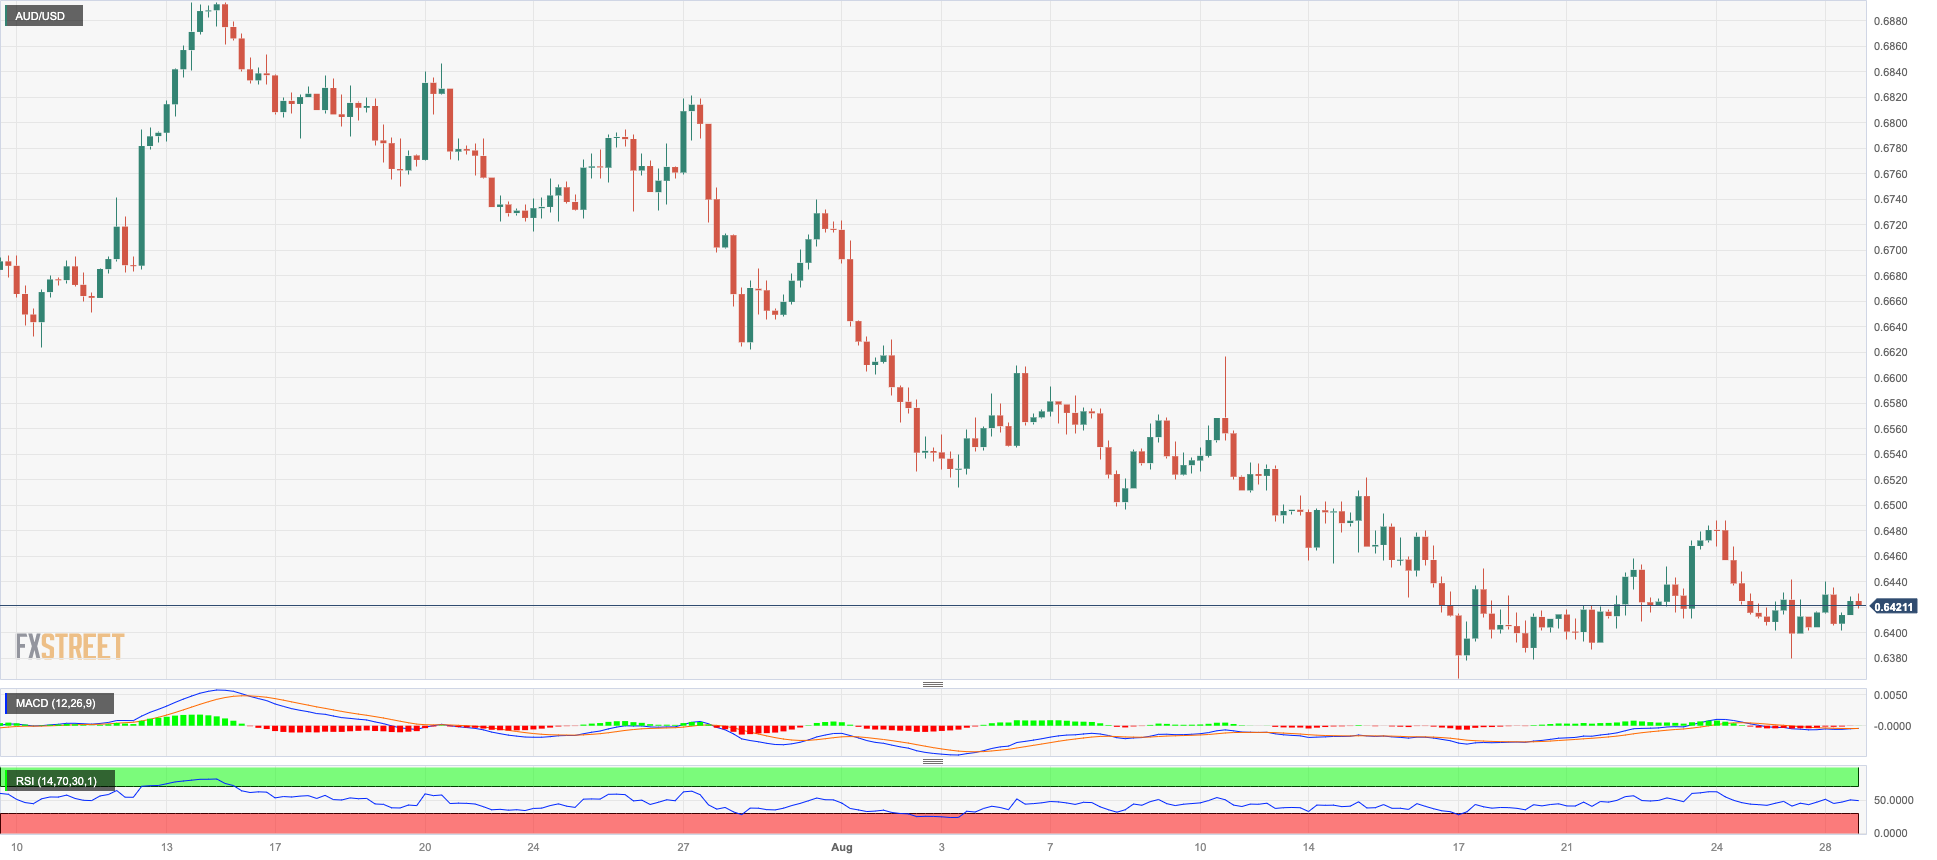
AUDUSD
The softer tone in the greenback lent oxygen to the high-beta currencies and the risk complex, sponsoring a daily uptick in AUD/USD on Monday.
Indeed, the Aussie dollar regained composure and left behind two straight sessions of losses at the beginning of the week, helped at the same time by the generalized upbeat mood in the commodity space.
In addition, better-than-expected preliminary prints saw Australian Retail Sales expand at a monthly 0.5% in July.
The next important support for AUD/USD is at the 2023 low of 0.6364 (August 17), ahead of the November 2022 low of 0.6272 (November 7) and the 2022 low of 0.6179 (October 13). On the flip side, there is a first upside barrier at the weekly high of 0.6616 (August 10) before the 0.6650 area, where the preliminary 100-day and 55-day SMAs coincide. Once above this region, the pair could tackle the 200-day SMA at 0.6725 prior to the July top at 0.6894 (July 14) and the June peak at 0.6899 (June 16). The crucial 0.7000 level is next before reaching the weekly high of 0.7029 (Feb 14) and the 2023 top of 0.7157 (Feb 2). The daily RSI improved past the 37 level.
Resistance levels: 0.6488 0.6521 0.6616 (4H chart)
Support levels: 0.6379 0.6364 0.6272 (4H chart)
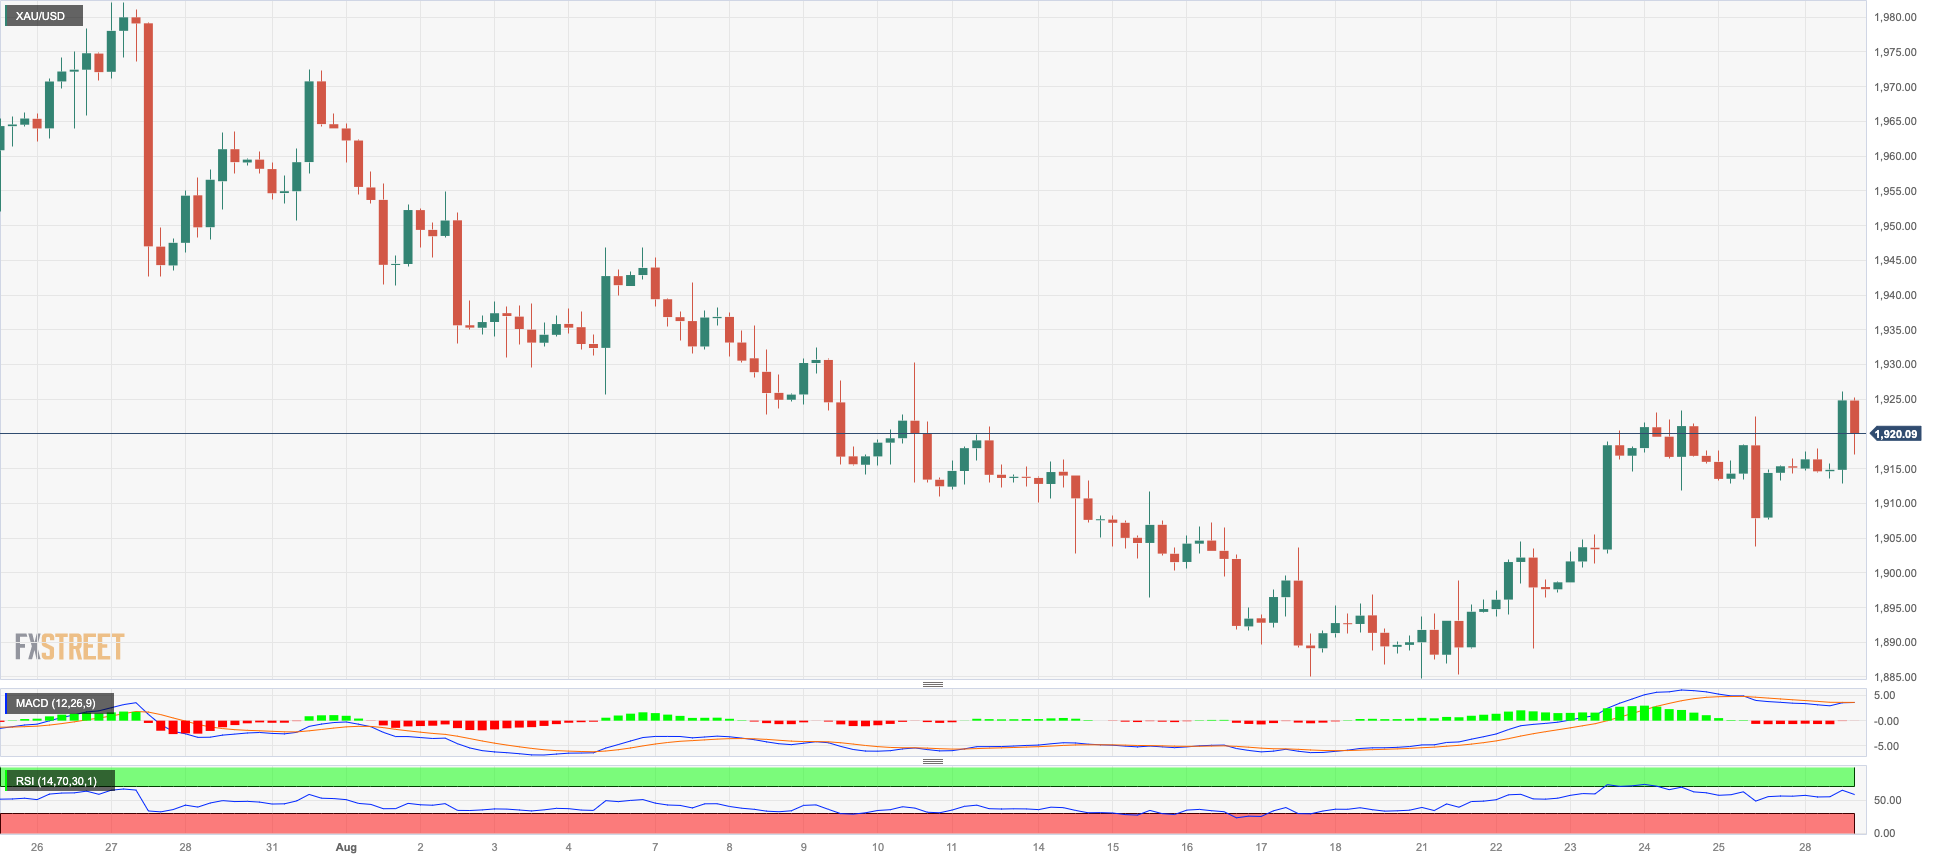
GOLD
Gold prices rose to multi-day highs near the $1930 region per troy ounce at the beginning of the week, rapidly leaving behind Friday’s pullback and resuming the uptrend above the critical 200-day SMA ($1910).
The yellow metal justified another daily advance in the renewed selling pressure hitting the greenback as well as the downward bias in US yields, particularly in the short end and the belly of the curve.
Looking ahead, the precious metal is expected to continue closely monitoring the release of important economic indicators, specifically inflation and the jobs report. These releases will provide valuable insights and guidance for the precious metal's price movements in the near future.
If the rebound picks up speed, gold prices will face another challenge at the intermediate 55-day and 100-day SMAs of $1932 and $1957, respectively. Furthermore, the July high of $1987 is a substantial barrier to overcome, just ahead of the psychological $2000 level. The latter's breakout might pave the way for a test of the 2023 top of $2067 (May 4), followed by the 2022 peak of $2070 (March 8) and the all-time high of $2075 (August 7, 2020). Having said that, the August low of $1884 provides immediate support before the 2023 low of $1804 (February 28) and the crucial support zone of $1800.
Resistance levels: $1926 $1936 $1946 (4H chart)
Support levels: $1884 $1809 $1804 (4H chart)
CRUDE WTI
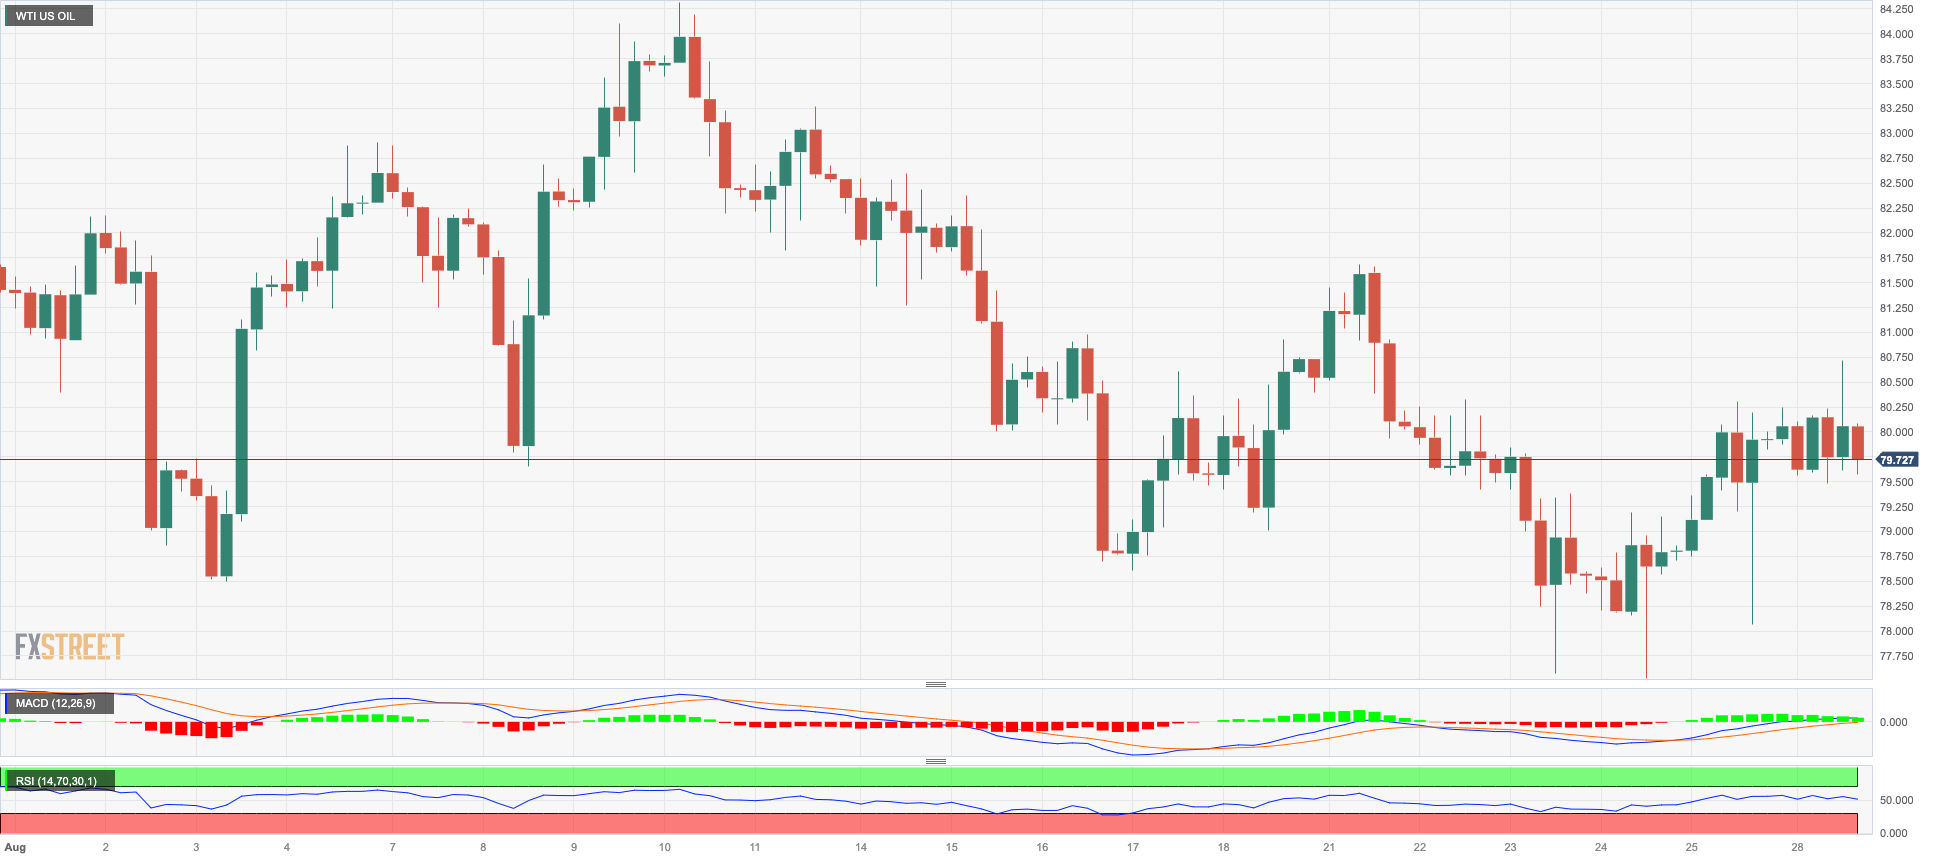
Prices of the American benchmark for sweet light crude oil charted an inconclusive session on Monday around the key level of $80.00 per barrel.
The likelihood of further tightening by the Federal Reserve reignited demand concerns, which added to the already existing unease surrounding China and its laggard economic rebound.
On the supply side, prices seem to have found some support ahead of the potential disruptions from Hurricane Idalia, which is expected to hit the eastern part of the Gulf Coast anytime soon.
Later in the week, the usual weekly reports on US crude oil inventories by the API and the EIA are expected on Tuesday and Wednesday, respectively.
If the recovery becomes more severe, the next upward barrier for WTI seems to be the 2023 high of $84.85 (August 10) prior to the November 2022 top of $93.73 (November 7) and before the weekly peak of $97.65 (August 30, 2022). In the opposite direction, first support appears at the August low of $77.64 (August 24), prior to the 200-day SMA of $75.99. The weekly lows of $73.89 (July 17), $66.86 (June 12), and $63.61 (May 4) are all south of this zone, as is the 2023 low of $63.61 (May 4). A deeper decline might push prices closer to the December 2021 low of $62.46 (December 2), ahead of the crucial $60.00 threshold per barrel.
Resistance levels: $80.83 $81.69 $83.77 (4H chart)
Support levels: $77.56 $73.81 $72.64 (4H chart)
GER40
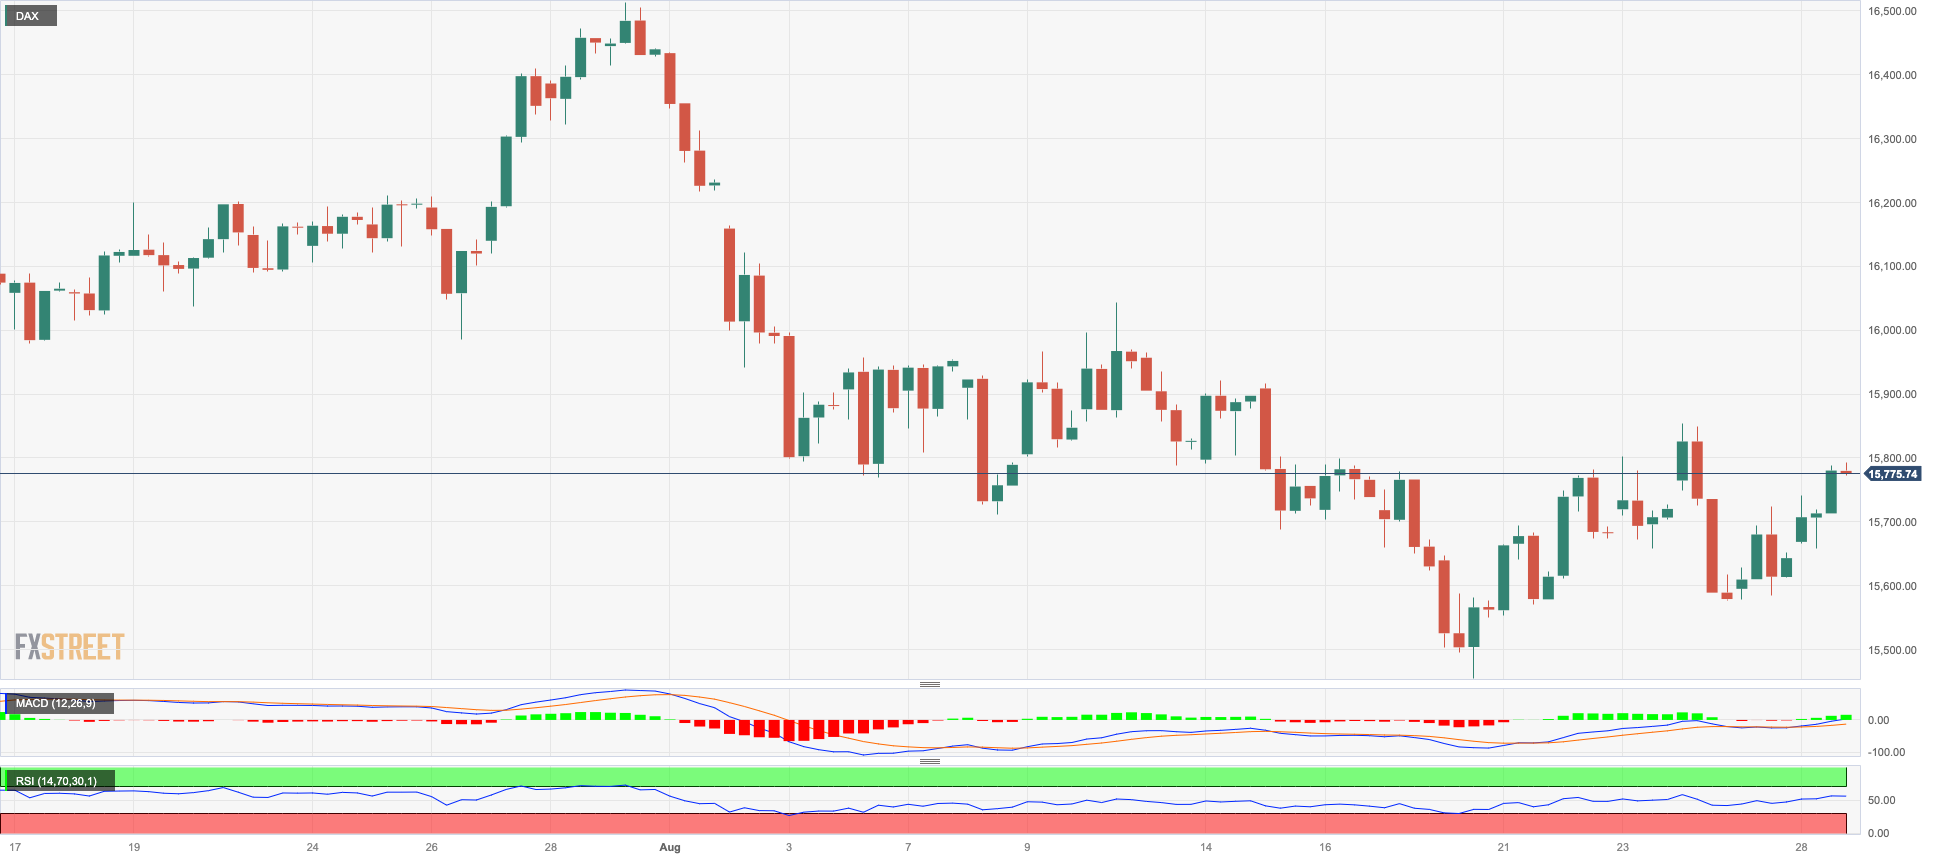
Germany’s benchmark DAX40 clinched the second consecutive daily advance on Monday, this time retesting the 15800 region.
The upbeat mood among investors prevailed throughout the European trading hours in response to positive news from China after the country’s announcement of measures to support its stock market.
Extra support also came from speculation that the ECB could pause its hiking campaign in September amidst the recent deterioration of key fundamentals and despite some ECB hawks being vocal regarding the need for further rate hikes to tackle the still elevated inflation in the region.
The daily uptick in the index came in line with a marginal advance in the 10-year bund yields, which settled around 2.55%.
Additional DAX40 gains should target the weekly high of 15896 (August 24) ahead of the temporary 55-day SMA at 15978 and another weekly top of 16060 (August 10). The breakout of this level could put a potential test of the all-time high of 16528 (July 31) back on the investors’ radar. Just the opposite, the August low of 15468 (August 18) offers immediate contention prior to the July low of 15456 (July 7) and the crucial 200-day SMA of 15418. If the index falls below this level, it could challenge the March low of 14458 (March 20) before hitting the December 2022 low of 13791 (December 20) and the 2022 low of 11862 (September 28). The daily RSI leapt to the boundaries of 48.
Best Performers: Commerzbank, Zalando SE, Deutsche Bank AG
Worst Performers: Vonovia, E.ON SE, Beiersdorf AG
Resistance levels: 15896 16060 16528 (4H chart)
Support levels: 15468 15456 14809 (4H chart)
NASDAQ
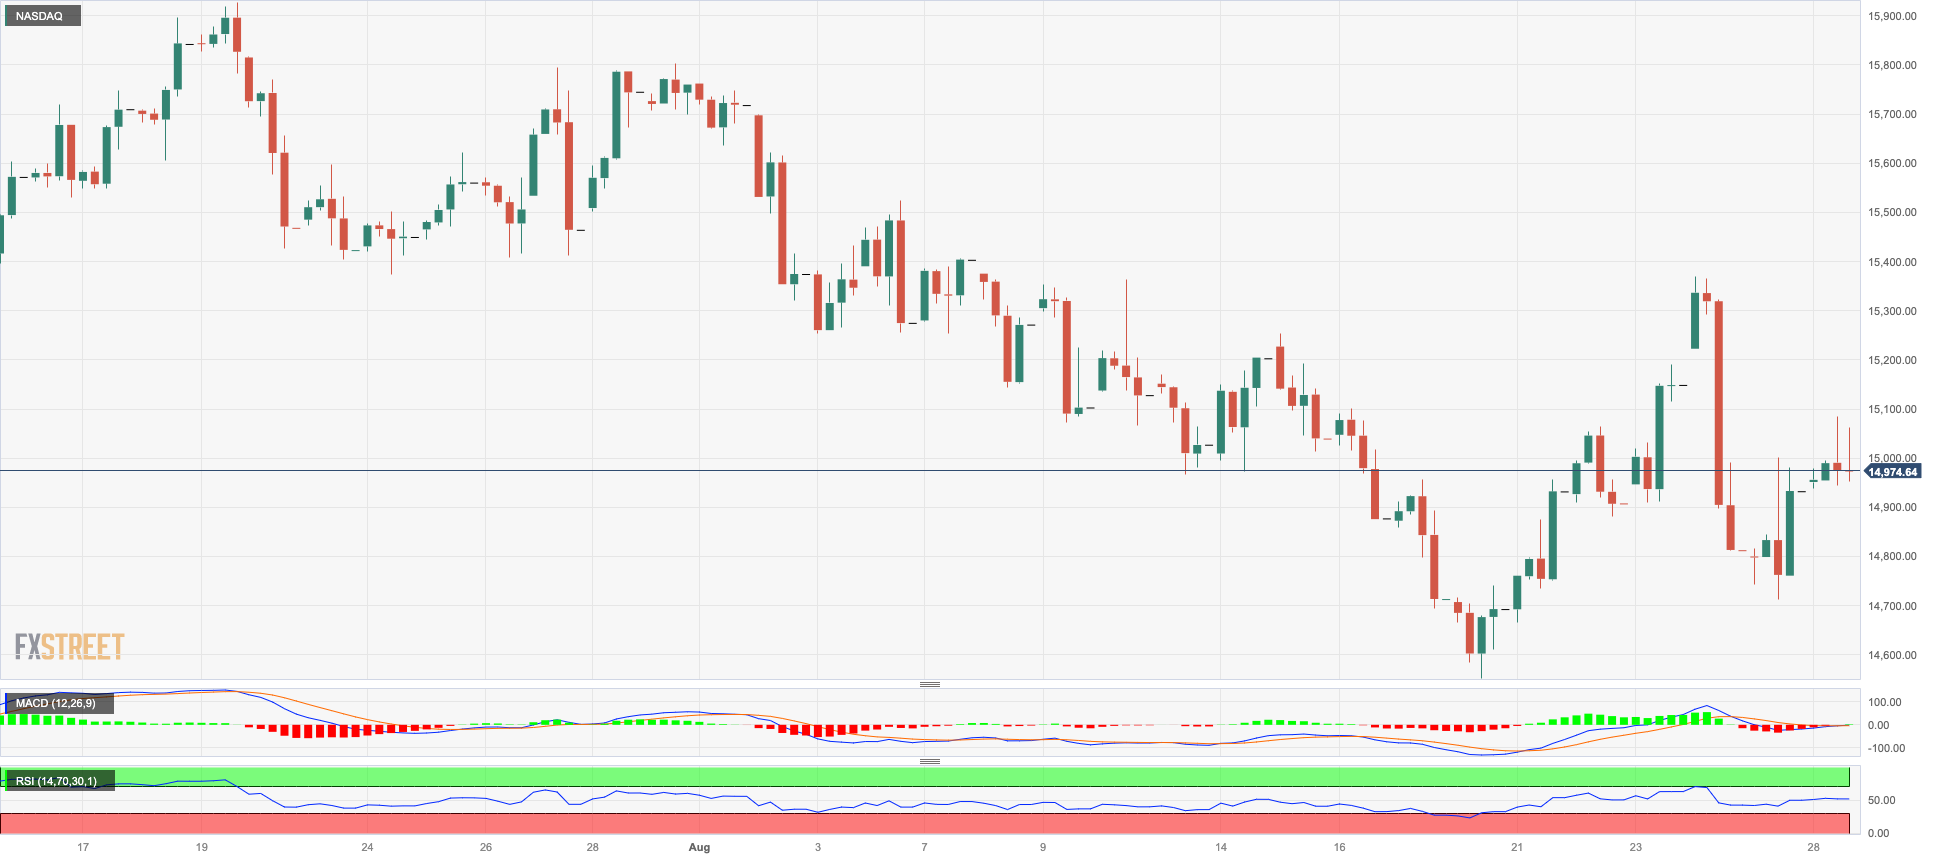
Tech stocks gauged by the key Nasdaq 100 advanced further north of the 15000 threshold at the beginning of the week.
The renewed selling bias in the greenback and the marked decline in US yields in the 2-year/10-year segment helped tech equities gather extra steam. In addition, investors’ optimism ahead of key data releases in the US calendar in the upcoming sessions (PCE and Nonfarm Payrolls) also added to the daily advance in the index.
If sellers regain control, the Nasdaq 100 could fall back to its August low of 14557 (August 18), seconded by the temporary 100-day SMA at 14413. This is followed by the weekly low of 14283 (June 7), the weekly low of 13520 (May 24), the 200-day SMA of 13159 and the April low of 12724 (April 25). Just the opposite, the index is just ahead of the weekly high of 15279 (August 24), another weekly peak of 15803 (July 31) and the 2023 top of 15932 (19 July), all before the round mark of 16000. The RSI on a daily basis advanced beyond the 48 level.
Top Gainers: Seagen, Warner Bros Discovery, Charter Communications
Top Losers: Crowdstrike Holdings, DexCom , Zscaler
Resistance levels: 15279 15795 15932 (4H chart)
Support levels: 14715 14557 14395 (4H chart)
DOW JONES
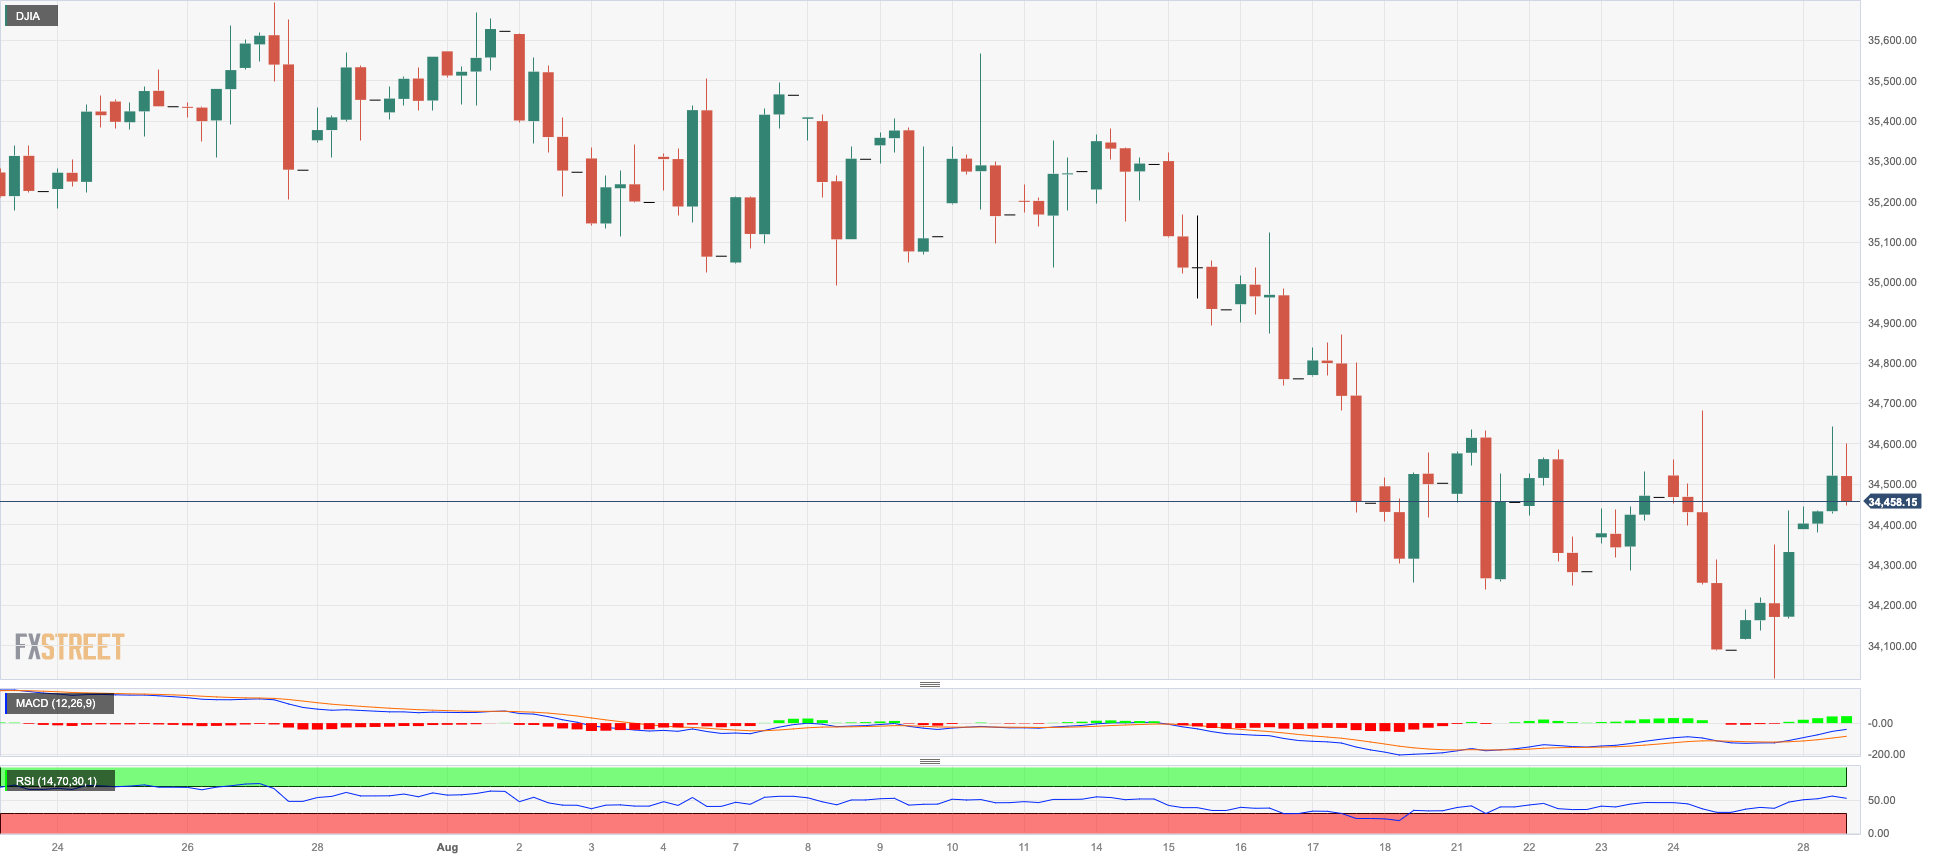
The US benchmark Dow Jones kicked off the new trading week on a strong foot, adding to Friday’s gains and revisiting the 34600 zone, where the 55-day SMA also sits.
Daily gains in US equities came in response to investors’ bets on another lower print from US inflation measured by the PCE and due later in the week. In addition, traders are expected to closely follow the publication of the jobs report for the month of August on Friday, looking for clues regarding the next interest rate decision by the Fed amidst its data-dependent stance.
Overall, the Dow Jones rose 0.64% to 34566, the S&P500 advanced 0.58% to 4431, and the tech-focused Nasdaq Composite gained 0.75% to 13692.
Breaking the August low of 34029 (25 August) could put the Dow Jones on track to attack the key 200-day line SMA at 33734, ahead of the July low of 33705 (10 July). Further down is the May low of 32586 (25 May), before the 2023 low of 31429 (15 March). Initial resistance is at the 2023 high of 35679 (1 August), followed by the February 2022 high of 35824 (9 February) and the all-time high of 36952 (5 January 2022). The RSI on the daily chart surpassed the 46 yardstick.
Top Performers: 3M, Goldman Sachs, Boeing
Worst Performers: J&J, Merck&Co, Travelers
Resistance levels: 34694 35048 35679 (4H chart)
Support levels: 34029 33705 32586 (4H chart)
MACROECONOMIC EVENTS

All Information & Updates provided by:

All information relating to the financial markets available on this page has been prepared and issued by FXStreet (Forexstreet SL, Spain, Reg: B62498233) on the basis of publicly available information and all information believed to be reliable and does not conflict with Kuwaiti local laws, and all necessary care has been taken to before the company to ensure that the facts mentioned are correct from the source.
NCM Investment nor any of its directors or employees shall in any way be held responsible for the contents of this news, and the information contained on this page is intended only to provide clients with publicly available information and should not be construed as investment advice, report or analysis and/or constitute an offer or invitation to buy or sell financial instruments of any kind.
RISK WARNING: Forex and CFDs are highly risky leveraged products, as losses can exceed deposits. Please ensure you understand all the risks and take independent advice if necessary. NCM will segregate the clients based on the criteria of the regulator and its bylaws. NCM does not provide any advisory service; the material published does not constitute advice or a recommendation for a transaction in any financial instrument. NCM accepts no responsibility for any use of the content presented and any consequences of that use. Anyone acting on the information provided does so at their own risk.