
- Contact Us:
-

-

-

-


Daily Market Updates
31 Aug 2023
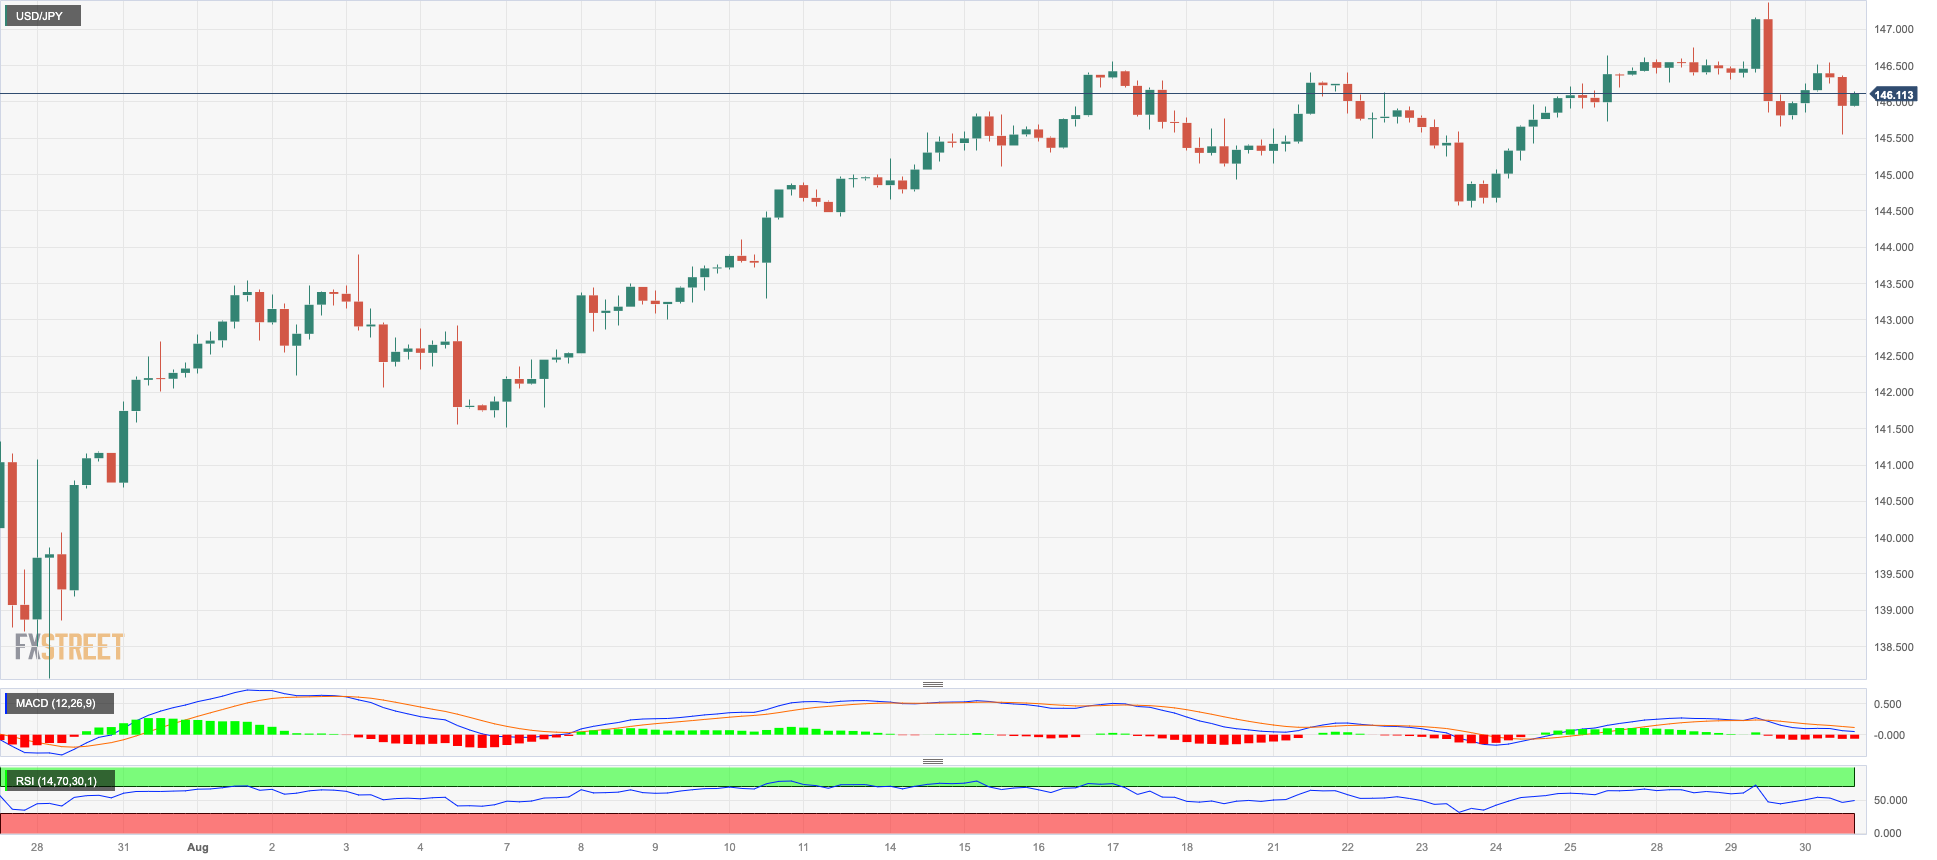
USDJPY
USD/JPY navigated a volatile session amidst a further decline in the greenback and another daily retracement in US yields across the curve.
Against that, the pair settled around the 146.00 neighbourhood amidst humble gains and an equally modest advance in the JGB 10-year yields, which kept hovering around the 0.65% region.
From the BoJ, Board member N. Tamura (hawk) showed optimism in reaching the inflation target next year, at the time when he left the door open to a potential lift-off in H2 2024.
In Japan, Consumer Confidence eased to 36.2 in August (from 37.1).
The surpass of the 2023 high at 147.37 (August 29) should prompt USD/JPY to a possible visit to the 2022 top at 151.94 (October 21). Instead, the weekly low at 144.53 (August 23) takes precedence over the interim 55-day SMA at 142.96 and the August low at 141.50 (August 7). If this level is breached, the pair could target the weekly low of 138.05 (July 28) before hitting the July low of 137.23 (July 13) and finally the 200-day SMA of 136.74. A lower retracement could threaten the weekly low of 133.01 (April 26) as well as the minor level of 132.01 (April 13) and the April low of 130.62 (April 5). The daily RSI looked stable around 60.
Resistance levels: 147.37 147.56 148.44 (4H chart)
Support levels: 145.55 144.53 143.17 (4H chart)
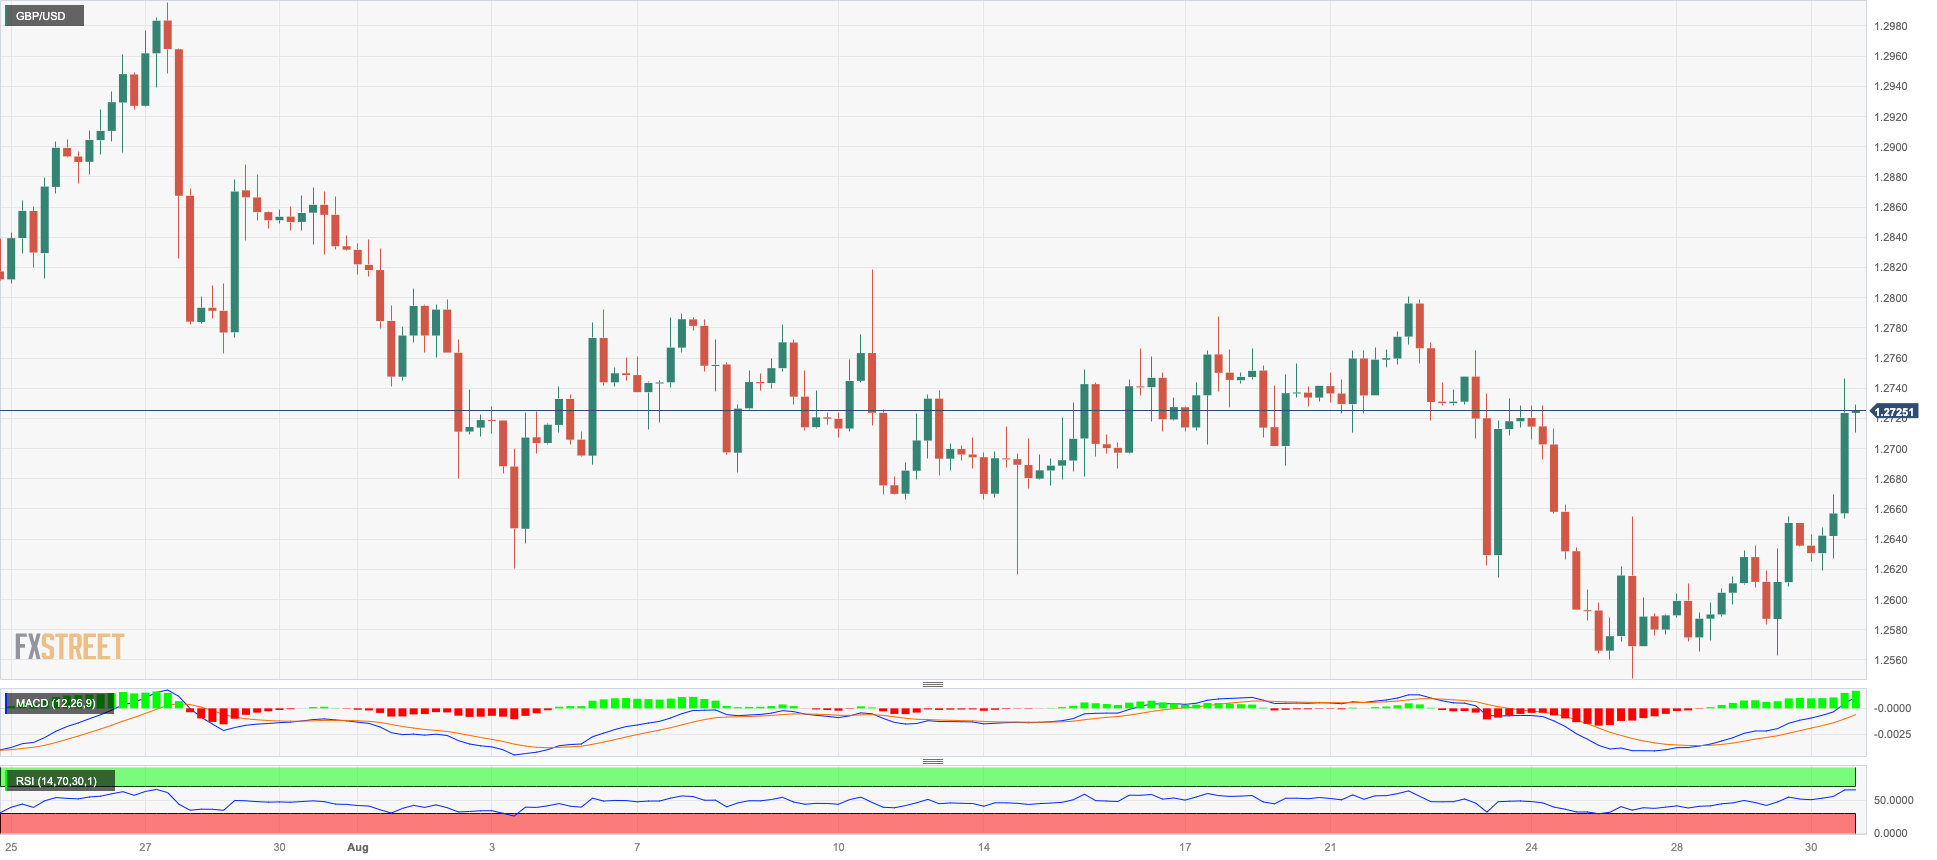
GBPUSD
The continuation of the sell-off in the greenback allowed the British pound to gather extra pace and lift GBP/USD to five-day highs north of 1.2700 the figure on Wednesday.
Indeed, the generalized improvement in sentiment surrounding the risk complex sponsored the third consecutive daily uptick in Cable, which was also bolstered by a small bounce in UK 10-year gilt yields.
In the UK, Mortgage Approvals shrank to 49.444K, while Mortgage Lending increased by £0.23B.
Further upside could see GBP/USD revisiting the provisional 55-day SMA at 1.2779 ahead of the weekly high at 1.2818 (August 10) and another weekly top at 1.2995 (July 27), which is just before the crucial barrier of 1.3000. Once the pair clears the 2023 peak of 1.3142 (14 July), the weekly highs of 1.3146 (April 14, 2022) and 1.3298 (March 15, 2022) should reappear. On the other hand, if the pair falls below the August low of 1.2547 (August 25), it may test the 2021-2023 trendline at 1.2430, just before the 200-day SMA at 1.2408 and the June low of 1.2368 (June 5). The breach of the latter could prompt a potential test of the May low of 1.2308 (May 25) to emerge on the horizon. The daily RSI leapt past the 50 threshold.
Resistance levels: 1.2745 1.2781 1.2800 (4H chart)
Support levels: 1.2547 1.2486 1.2368 (4H chart)
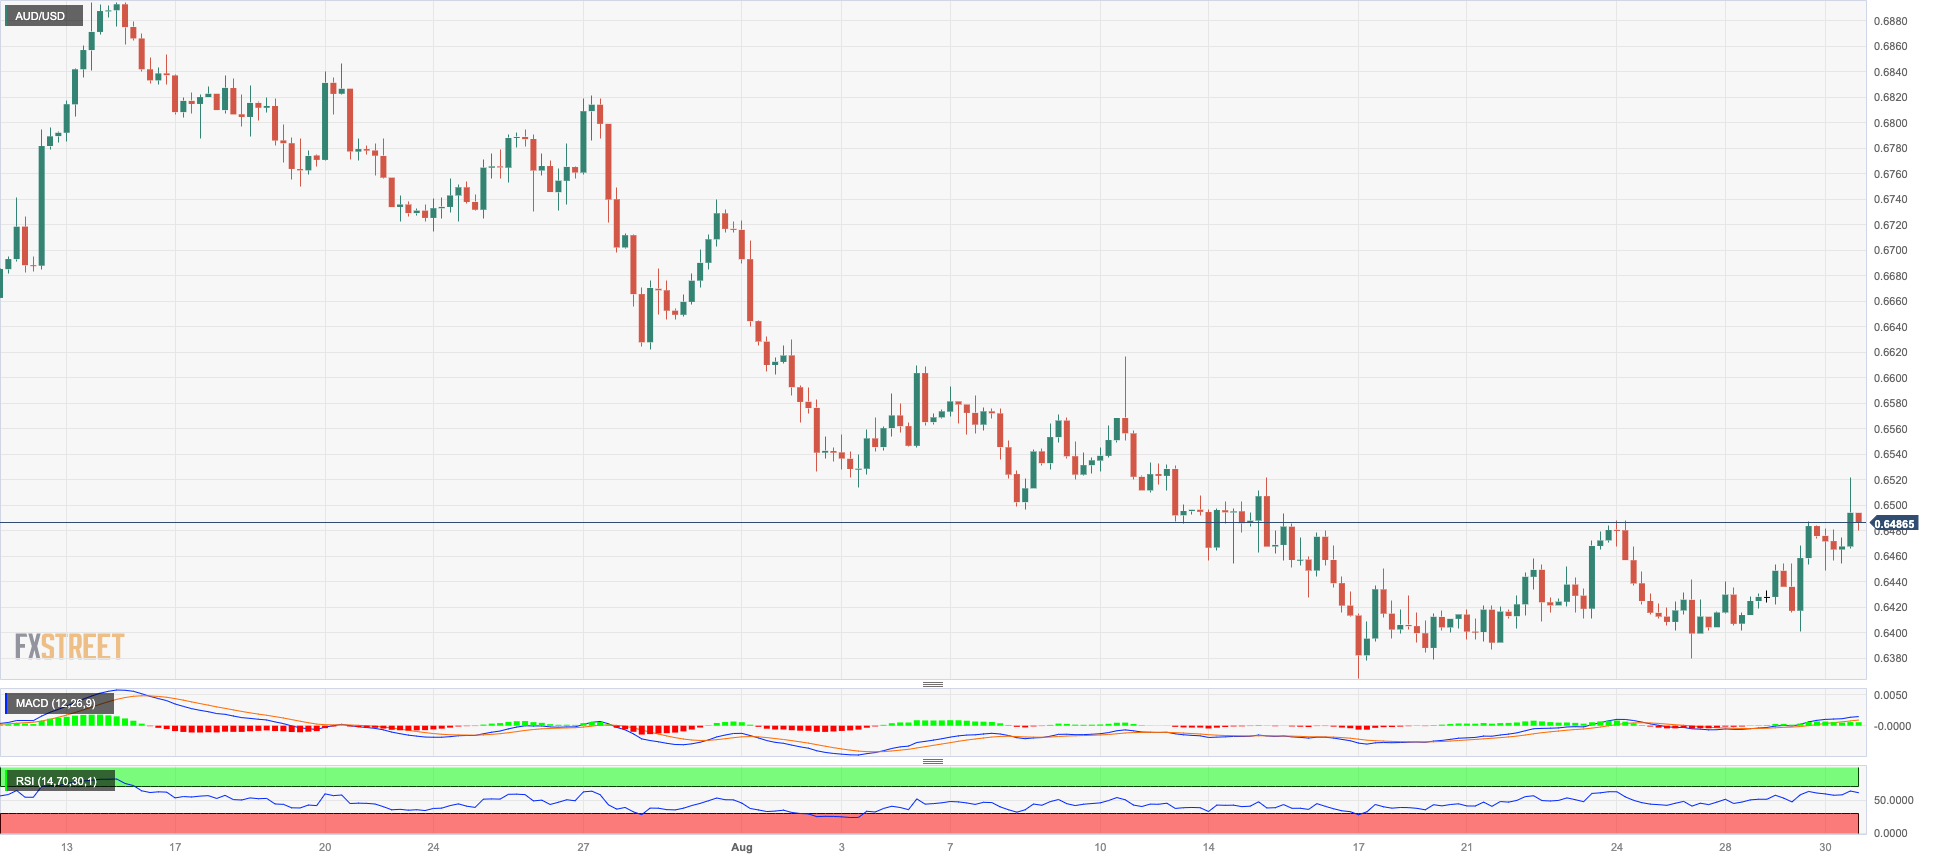
AUDUSD
AUD/USD faded the initial bull run to multi-day highs around 0.6520 and returned to the sub-0.6500 region as the NA session was drawing to a close on Wednesday.
The intense selling pressure around the US dollar in combination with the broad-based firm note in the commodity universe helped the Aussie dollar clinch the third daily advance in as many sessions midweek.
Down Under, preliminary Building Permits contracted 8.1% MoM in July, and the Monthly CPI Indicator rose below consensus by 4.9% in July (from 5.4%).
Despite soon-to-be RBA Governor Bullock leaving the door open to extra hikes in her comments on Tuesday, the latest results from key fundamentals seem to support the view that the RBA will remain on hold in the next couple of meetings.
AUD/USD now faces immediate resistance at the weekly high of 0.6522 (August 30) seconded by another weekly top of 0.6616 (August 10). Once above this level, the pair may challenge the 200-day SMA at 0.6723 ahead of the July peak of 0.6894 (July 14) and June high of 0.6899 (June 16). The key 0.7000 level comes next, before the weekly top of 0.7029 (February 14) and the 2023 peak of 0.7157 (February 2). On the contrary, the 2023 low of 0.6364 (August 17) is the next key support prior to the November 2022 low of 0.6272 (November 7) and the 2022 low of 0.6179 (October 13). The day-to-day RSI advanced marginally to the 46 area.
Resistance levels: 0.6522 0.6582 0.6616 (4H chart)
Support levels: 0.6379 0.6364 0.6272 (4H chart)
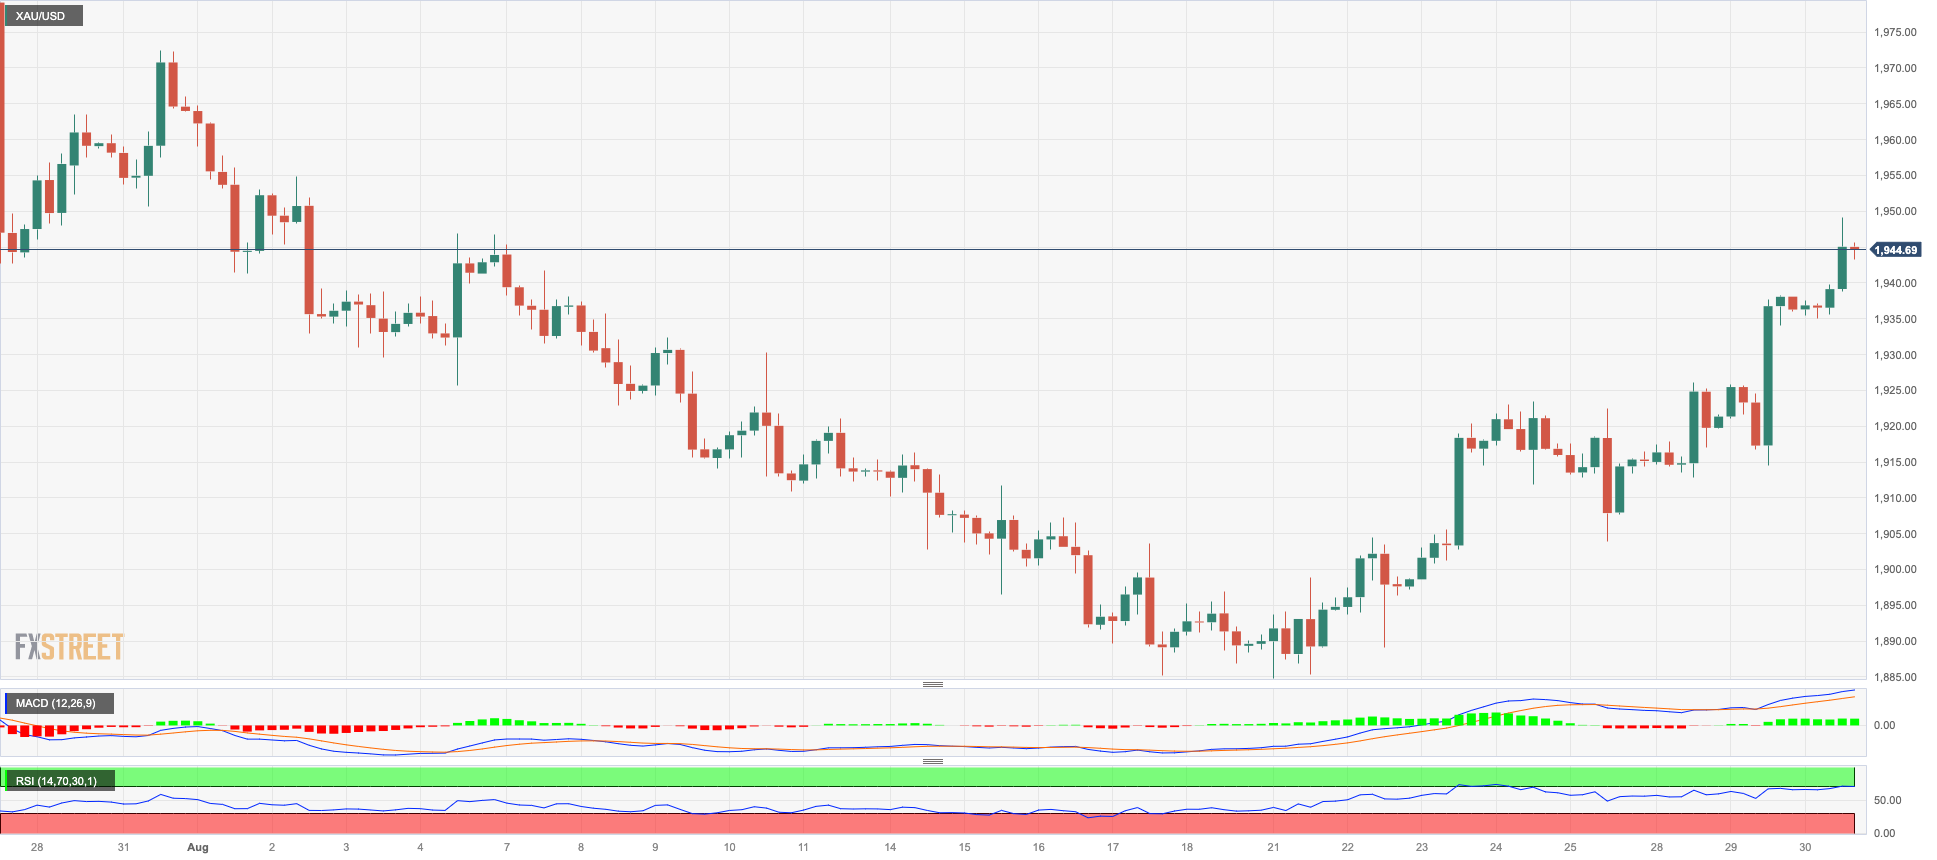
GOLD
Gold prices extended the weekly optimism further and advanced to new four-week highs around $1950 per troy ounce on Wednesday. It is worth noting that bullion closed with gains in eight out of the last nine sessions and almost fully retraced the sharp pullback seen in the first couple of weeks of August.
The intense move higher in the yellow metal came in response to another negative session in the greenback, which was in turn propped up by an extra decline in US yields across different timeframes.
Meanwhile, bullion is expected to experience increased volatility ahead of significant announcements on the US calendar, including PCE inflation statistics (Thursday) and monthly Nonfarm Payrolls (Friday).
As the rally gains momentum, gold will find another challenge at the transitory 100-day SMA at $1955. Moreover, the July high of $1987 is a significant hurdle to overcome before the psychological mark of $ 2000 is reached. A break of the latter mark could pave the way for a test of the 2023 top at $2067 (May 4), followed by the 2022 peak at $2070 (March 8) and the all-time high at $2075 (August 7, 2020). By contrast, the key 200-day SMA at $1912 is expected to hold the initial downside test ahead of the August low of $1884 and the 2023 low of $1804 (28 February), all prior to the crucial support zone of $1800.
Resistance levels: $1949 $1972 $1982 (4H chart)
Support levels: $1934 $1903 $1884 (4H chart)
CRUDE WTI
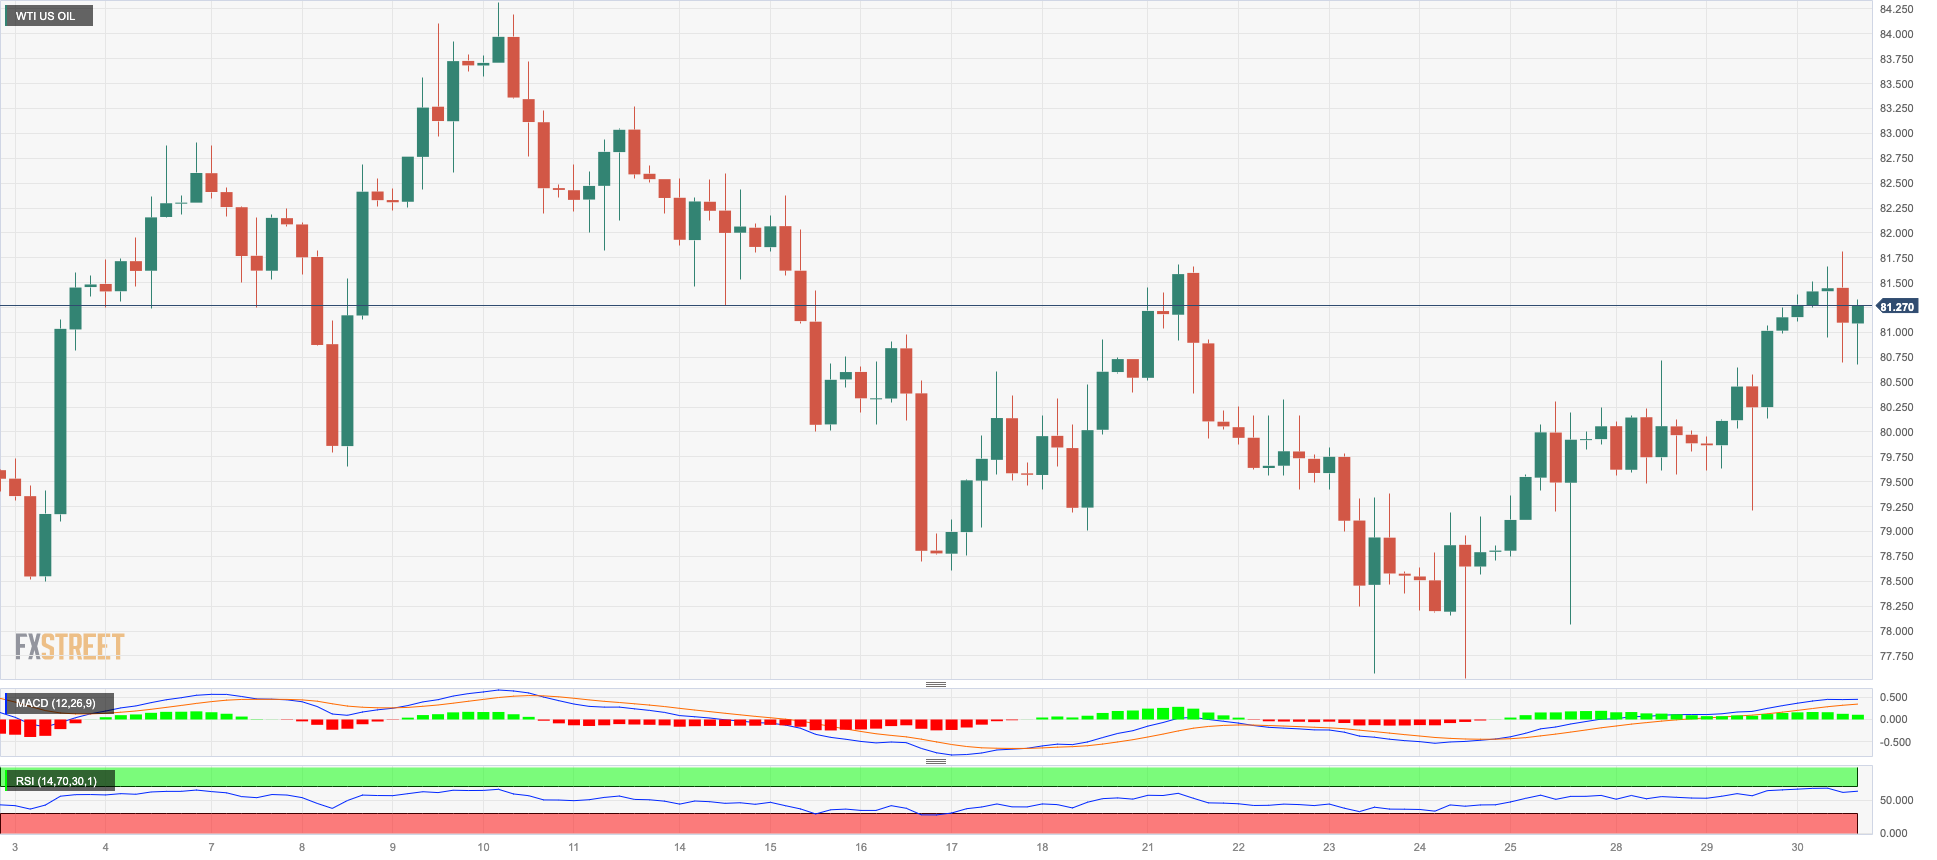
Prices of WTI charted an irresolute session after climbing to new highs just above the $82.00 mark per barrel on Wednesday.
Supporting prices emerged from the likelihood that Saudi Arabia extends its voluntary oil output cuts into October, as well as the potential impact of Hurricane Idalia and the larger-than-expected drop in US crude oil supplies, as reported by the EIA.
On the latter, the agency said that US crude oil inventories dropped more than expected by 10.584M barrels in the week to August 25, while supplies at Cushing shrank by 1.504M barrels, Weekly Distillate Stocks unexpectedly went up by 1.235M barrels and gasoline stockpiles decreased by 0.214M barrels.
Playing against a further advance in crude oil prices, instead, persistent concerns over the health of the Chinese economy emerged, while the recent revision lower of US GDP during the second quarter seems to have also weighed on traders’ sentiment.
If the rally strengthens, the next upside barrier for WTI appears to be the 2023 high at $84.85 (August 10) ahead of the November 2022 top at $93.73 (November 7) and the weekly peak at $97.65 (August 30, 2022), all preceding the psychological 100.00 mark per barrel. In the opposite direction, the first support is at the August low of $77.64 (August 24) before the 200-day SMA at $75.97. Once this region is cleared, WTI could attack the weekly lows at $73.89 (July 17), $66.86 (June 12) and $63.61 (May 4) ahead of the 2023 low at $63.61 (May 4). A deeper drop could take prices closer to the December 2021 low of $62.46 (December 2) before reaching the crucial $60.00 per barrel level.
Resistance levels: $82.01 $83.77 $84.85 (4H chart)
Support levels: $77.56 $73.81 $72.64 (4H chart)
GER40
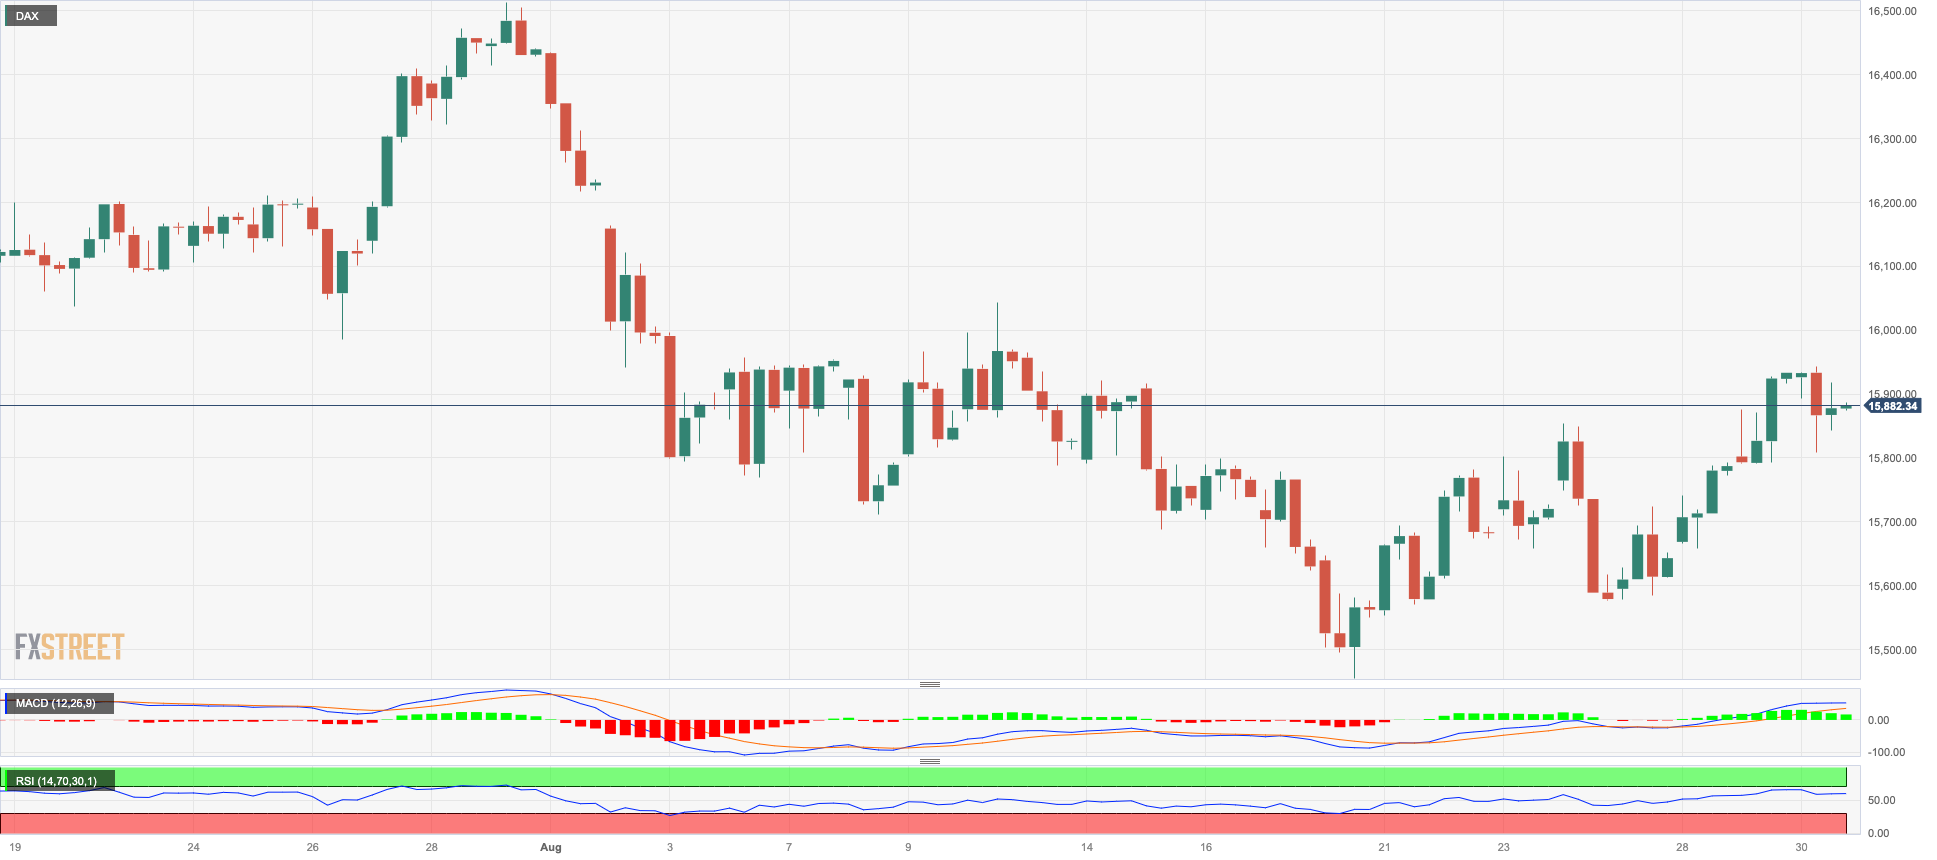
Germany's benchmark DAX40 index concluded Wednesday's trading session in the red zone, marking its first negative finish since the previous Friday. However, this descent followed an earlier ascent to reach fresh three-week highs, stopping just below the 16000 threshold.
The drop in German stock values was prompted by a corrective movement, coinciding with an unexpected and substantial decrease in German Import Prices during July, reaching levels last witnessed back in January 1987 (0.6% MoM, 13.2% YoY). Concurrently, preliminary inflation indicators for Germany revealed that the CPI surged by a higher-than-anticipated 6.1% in the year leading up to August, a slight decrease from July's 6.2% advance.
In contrast to the daily dip observed in the DAX40, there was a resurgence of upward momentum in the yields of 10-year bunds, briefly edging close to the 2.60% milestone.
Further DAX40 gains should target the weekly high at 15960 (August 30), an area reinforced by the temporary 55-day SMA (15965) and just ahead of another weekly top at 16060 (10 August). A break above this level could bring a potential test of the all-time peak at 16528 (July 31) back into investors’ focus. Conversely, the August low of 15468 (August 18) represents an immediate target ahead of the July low of 15456 (July 7) and the crucial 200-day SMA of 15434. If the index falls below this level, it could challenge the March low of 14458 (March 20) before the December 2022 low of 13791 (December 20) and the 2022 low of 11862 (September 28). The RSI on the daily chart eased below 52.
Best Performers: MTU Aero, Sartorius AG VZO, Brenntag AG
Worst Performers: RWE AG ST, Siemens Energy AG, Dr Ing hc F Porsche Prf
Resistance levels: 15960 16060 16528 (4H chart)
Support levels: 15578 15468 15456 (4H chart)
NASDAQ
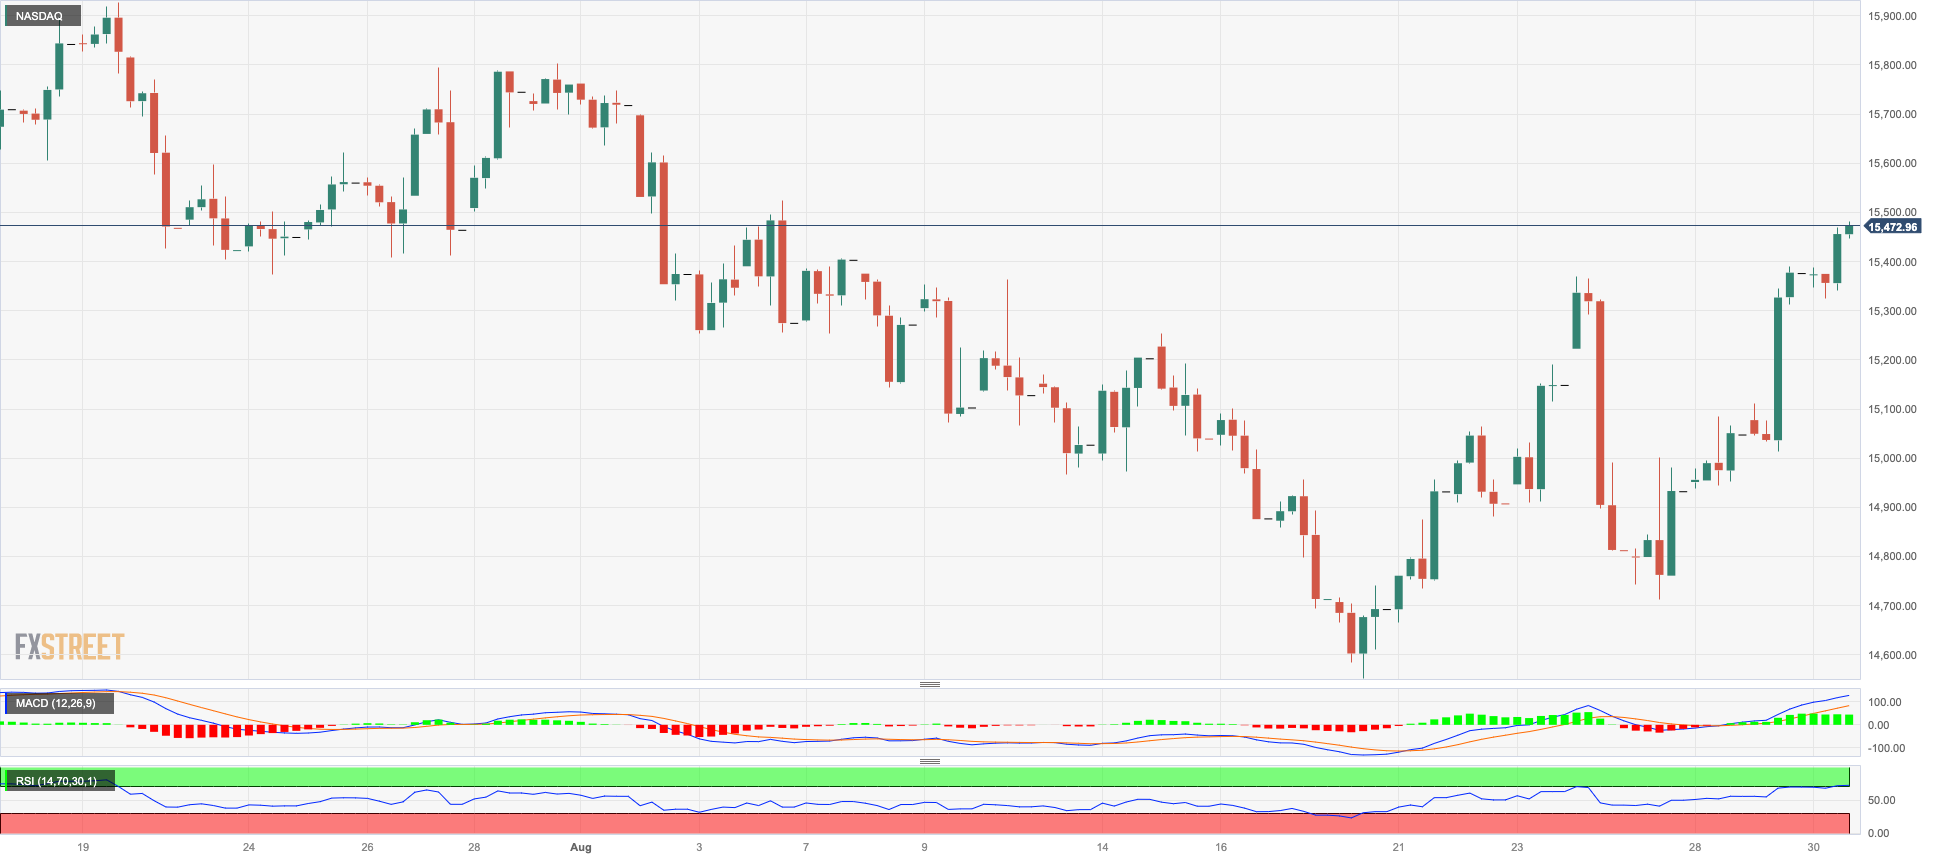
On Wednesday, the technology benchmark Nasdaq 100 continued its upward trend for the fourth consecutive session. This time, it reached new four-week highs around the 15500 level.
Several factors contributed to another positive session in the US tech sector. These included a significant decline in the greenback, a more pronounced pullback in US yields across various maturity periods, and investors reassessing the probability of the Federal Reserve maintaining its interest rates unchanged for the rest of the year.
If bulls push stronger, the Nasdaq 100 might potentially aim for the weekly high of 15803 (July 31), followed by the 2023 high of 15932 (July 19), all before the round mark of 16000. Immediate support, on the other hand, is aligned at the August low of 14557 (August 18), ahead of the intermediate 100-day SMA at 14461 and the weekly low of 14283 (June 7). If the latter is lost, the weekly low of 13520 (May 24), the 200-day SMA of 13202, and the April low of 12724 (April 25) are all exposed. The daily RSI soared beyond the 58 mark.
Top Gainers: Sirius XM, DexCom, PDD Holdings DRC
Top Losers: Charter Communications, JD.com Inc Adr, Airbnb
Resistance levels: 15484 15795 15932 (4H chart)
Support levels: 14715 14557 14283 (4H chart)
DOW JONES
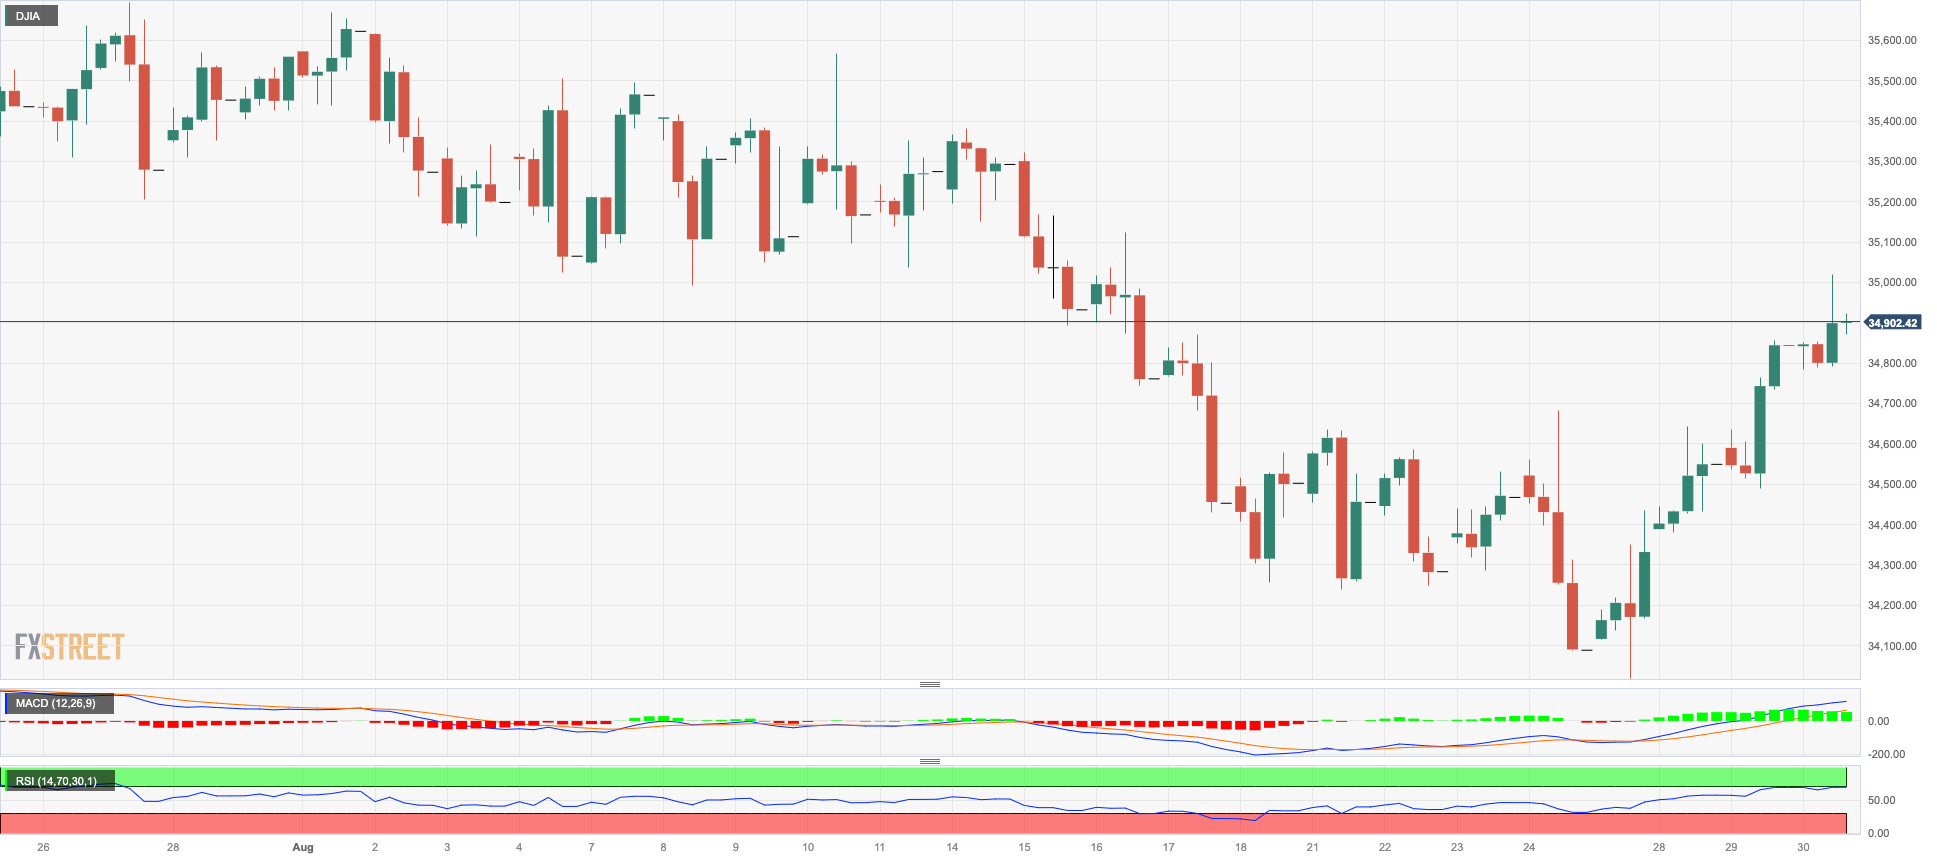
The blue-chip index Dow Jones advanced modestly to new multi-day highs past the key 35000 threshold on Wednesday.
The optimism among investors remained sound and was underpinned by hopes that the Federal Reserve might keep rates unchanged for the rest of the year. This perception has been exacerbated following further cooling of the US labour market as well as persistent disinflationary pressures and the recent lower estimate for Q2 GDP.
On the whole, the Dow Jones advanced 0.13% to 34899, the S&P500 gained 0.42% to 4516, and the tech-heavy Nasdaq Composite rose 0.59% to 14025.
Next on the upside for the Dow Jones appear the weekly peak of 35025 (August 30). The breakout of this level exposes the 2023 high of 35679 (August 1), followed by the February 2022 top of 35824 (9 February) and the all-time high of 36952 (5 January 2022). The other way around, breaking through the August low of 34029 (August 25) might put the index on track to attack the critical 200-day SMA at 33760, ahead of the July low of 33705 (July 10). Following that is the May low of 32586 (May 25), prior to the 2023 low of 31429 (March 15). On the daily chart, the RSI surpassed the 53 level.
Top Performers: Apple. Home Depot, Boeing
Worst Performers: 3M, Honeywell, Amgen
Resistance levels: 35025 35578 35679 (4H chart)
Support levels: 34029 33705 32586 (4H chart)
MACROECONOMIC EVENTS

All Information & Updates provided by:

All information relating to the financial markets available on this page has been prepared and issued by FXStreet (Forexstreet SL, Spain, Reg: B62498233) on the basis of publicly available information and all information believed to be reliable and does not conflict with Kuwaiti local laws, and all necessary care has been taken to before the company to ensure that the facts mentioned are correct from the source.
NCM Investment nor any of its directors or employees shall in any way be held responsible for the contents of this news, and the information contained on this page is intended only to provide clients with publicly available information and should not be construed as investment advice, report or analysis and/or constitute an offer or invitation to buy or sell financial instruments of any kind.
RISK WARNING: Forex and CFDs are highly risky leveraged products, as losses can exceed deposits. Please ensure you understand all the risks and take independent advice if necessary. NCM will segregate the clients based on the criteria of the regulator and its bylaws. NCM does not provide any advisory service; the material published does not constitute advice or a recommendation for a transaction in any financial instrument. NCM accepts no responsibility for any use of the content presented and any consequences of that use. Anyone acting on the information provided does so at their own risk.