
- Contact Us:
-

-

-

-


Daily Market Updates
01 Sep 2023
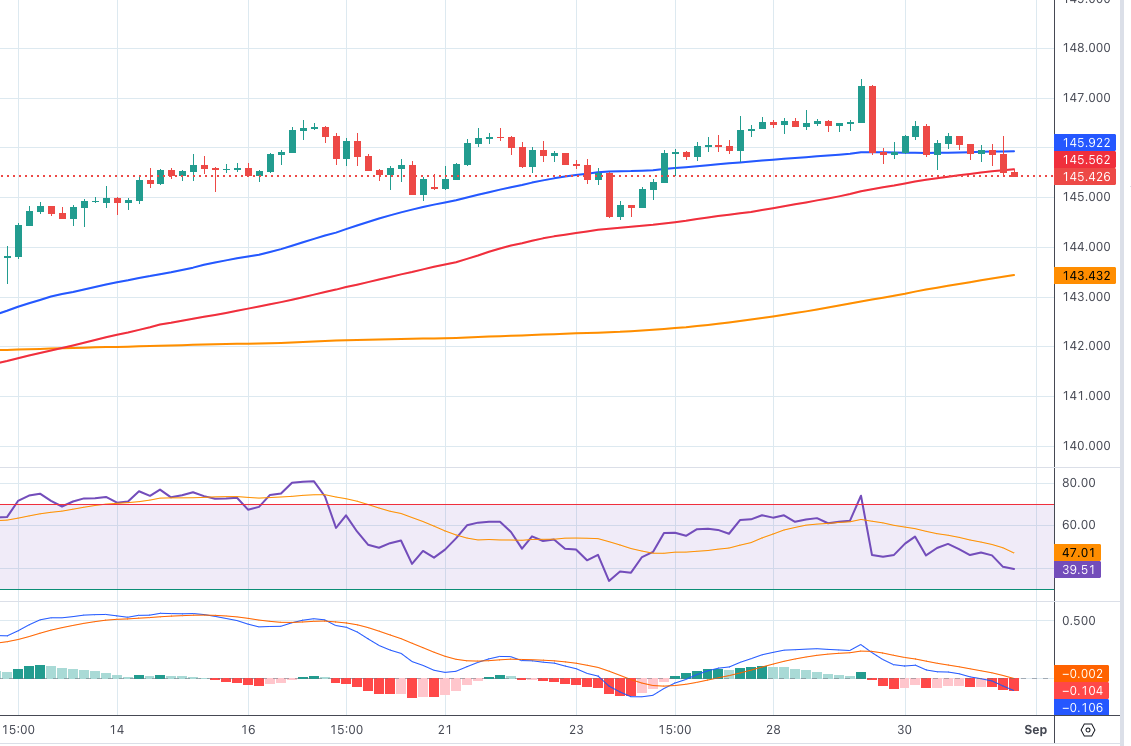
USDJPY
USD/JPY broke below the 146.00 support with certain conviction to print new multi-session lows around 145.40 on Thursday.
The strong decline in spot came pari passu with the equally sharp retracement in US yields across the curve and despite the robust bounce in the greenback.
In the Japanese money market, the JGB 10-year yields dropped to lows not seen in several sessions, around 0.63%.
From the BoJ, and in opposition to Board member N. Tamura’s comments on Wednesday, T. Nakamura (dove) has advised a careful approach and specifically mentioned that the bank should refrain from rushing into policy tightening. He emphasized that members haven't reached a point where they can see a consistent and steady attainment of the 2% inflation goal along with wage growth.
In Japan, Foreign Bond Investment rose by ¥425.1B in the week to August 26. Further data for the month of July saw advanced Industrial Production contract 2.5% YoY, Retail Sales expand 6.8% from a year earlier and Housing Starts drop 6.7% over the last twelve months.
The breakout of the 2023 high of 147.37 (August 29) should encourage USD/JPY to test the 2022 top of 151.94 (October 21). Instead, the weekly low of 144.53 (August 23) trumps the intermediate 55-day SMA of 143.07 and the August low of 141.50 (August 7). If this level is broken, the pair might go for the weekly low of 138.05 (July 28), the July low of 137.23 (July 13), and ultimately the 200-day SMA of 136.78. A lower retracement might put the weekly low of 133.01 (April 26) under threat, as well as the minor level of 132.01 (April 13) and the April low of 130.62 (April 5). The daily RSI eased to the 55 zone.
Resistance levels: 147.37 147.56 148.44 (4H chart)
Support levels: 145.43 144.53 143.36 (4H chart)
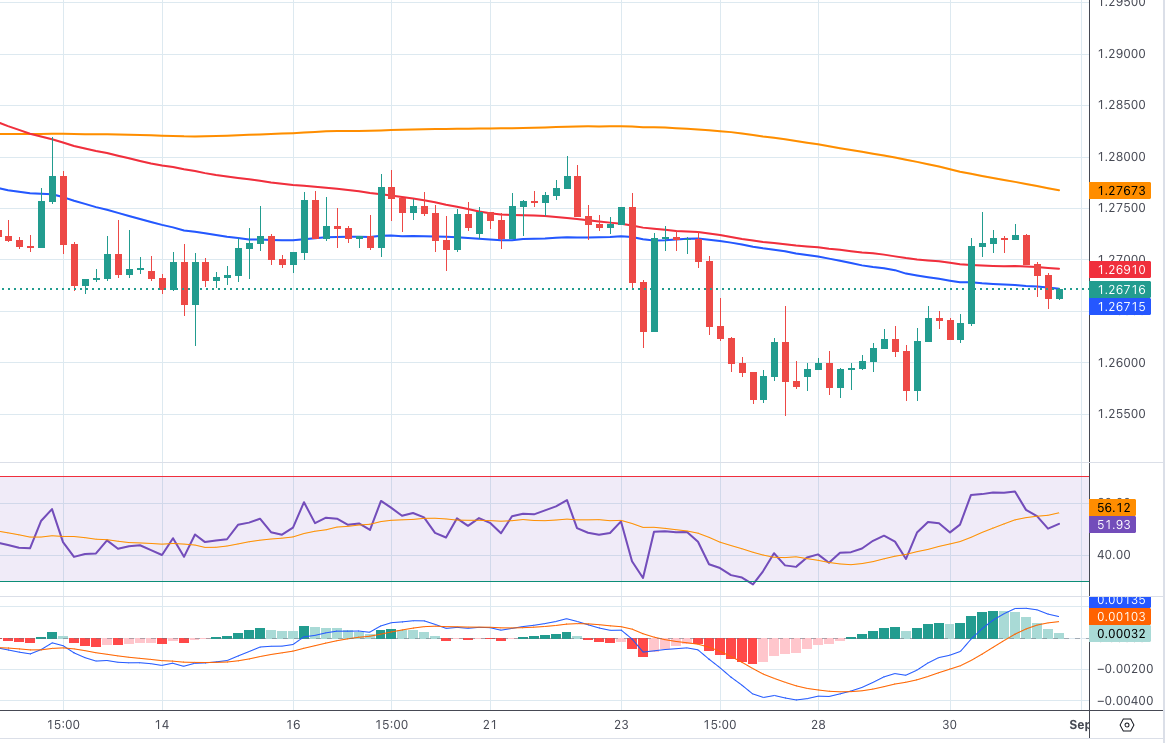
GBPUSD
After three consecutive daily advances, including a move to multi-day highs near 1.2750 on August 30, GBP/USD came under intense selling pressure and briefly revisited the 1.2650 zone on Thursday.
The pronounced move lower in Cable was in response to the equally robust, albeit in the opposite direction, rebound in the greenback, which in turn sponsored a bounce in the USD Index (DXY) after a three-day negative streak.
In the UK docket, the salient event was the speech by H. Pill from the BoE, who presented the viewpoint that the UK is currently experiencing second-round effects of inflation. Additionally, Pill suggested that a significant portion of the tightening measures is yet to have an impact on the economy, while emphasizing that UK inflation has remained consistently elevated.
With further upside, GBP/USD could regain the preliminary 55-day SMA at 1.2777 before hitting the weekly high at 1.2818 (August 10) and another weekly top at 1.2995 (July 27), which precedes the crucial barrier of 1.3000. Once the pair clears the 2023 top of 1.3142 (July 14), the weekly peaks of 1.3146 (April 14, 2022) and 1.3298 (March 15, 2022) should reappear. On the other hand, a drop below the August low of 1.2547 (August 25), could open the door to a test of the 2021-2023 trendline near 1.2430, just ahead of the 200-day SMA at 1.2411 and the June low of 1.2368 (June 5). A break of the latter could see a potential test of the May low of 1.2308 (May 25) re-emerge on the horizon. The daily RSI deflated below the 45 yardstick.
Resistance levels: 1.2746 1.2771 1.2800 (4H chart)
Support levels: 1.2652 1.2547 1.2486 1.2368 (4H chart)
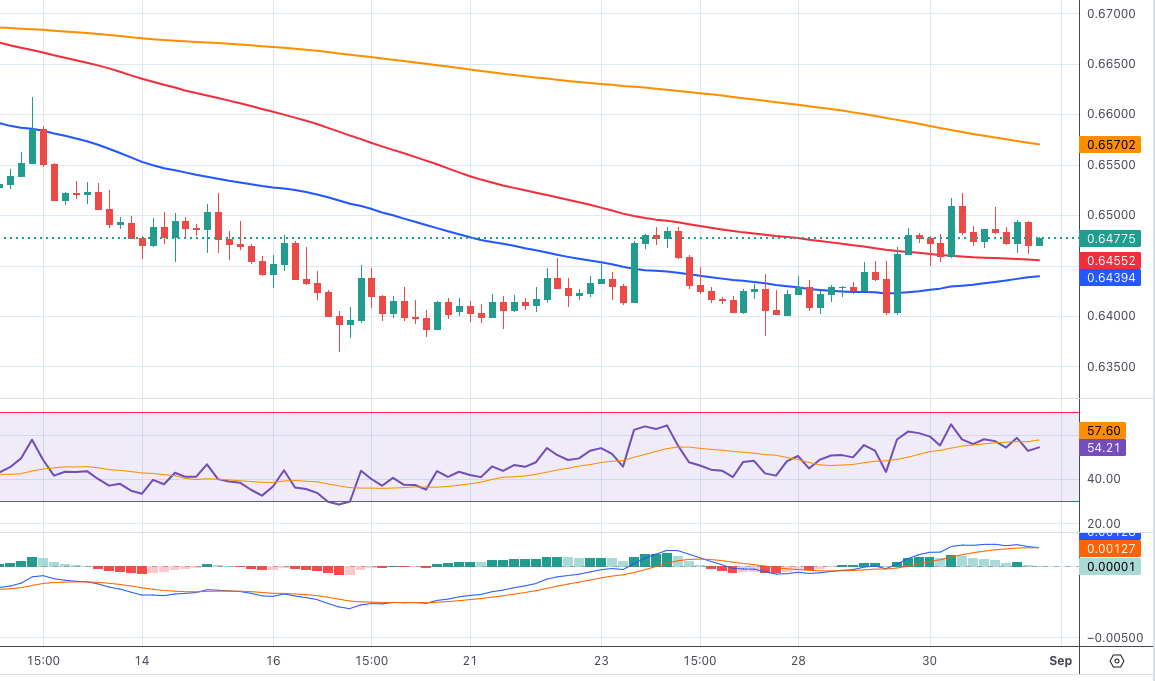
AUDUSD
AUD/USD could not sustain another trespass of the key 0.6500 hurdle and ended the session below that mark and around Wednesday’s closing levels near 0.6480.
This time, the sharp upward bias in the greenback kept the price action around the high-beta currency depressed, while the mixed tone in the commodity complex did nothing to help the Aussie dollar on Thursday. On this, it is worth noting that prices of iron ore rose to levels last seen in late April near the $115 level per tonne.
Data-wise, in Oz, Housing Credit expanded at a monthly 0.3% in July, in line with expectations.
AUD /USD now faces immediate resistance from the weekly high of 0.6522 (August 30), seconded by another weekly top of 0.6616 (August 10). Above this level, the pair could attack the 200-day SMA at 0.6721 prior to the July peak of 0.6894 (July 14) and the June high of 0.6899 (June 16). The key level of 0.7000 is next before the weekly top of 0.7029 (February 14) and the 2023 peak of 0.7157 (February 2). In contrast, the 2023 low of 0.6364 (August 17) is the next key support ahead of the November 2022 low of 0.6272 (November 7) and the 2022 low of 0.6179 (October 13). The day-to-day RSI looked stable around 45.
Resistance levels: 0.6522 0.6582 0.6616 (4H chart)
Support levels: 0.6436 0.6379 0.6364 (4H chart)
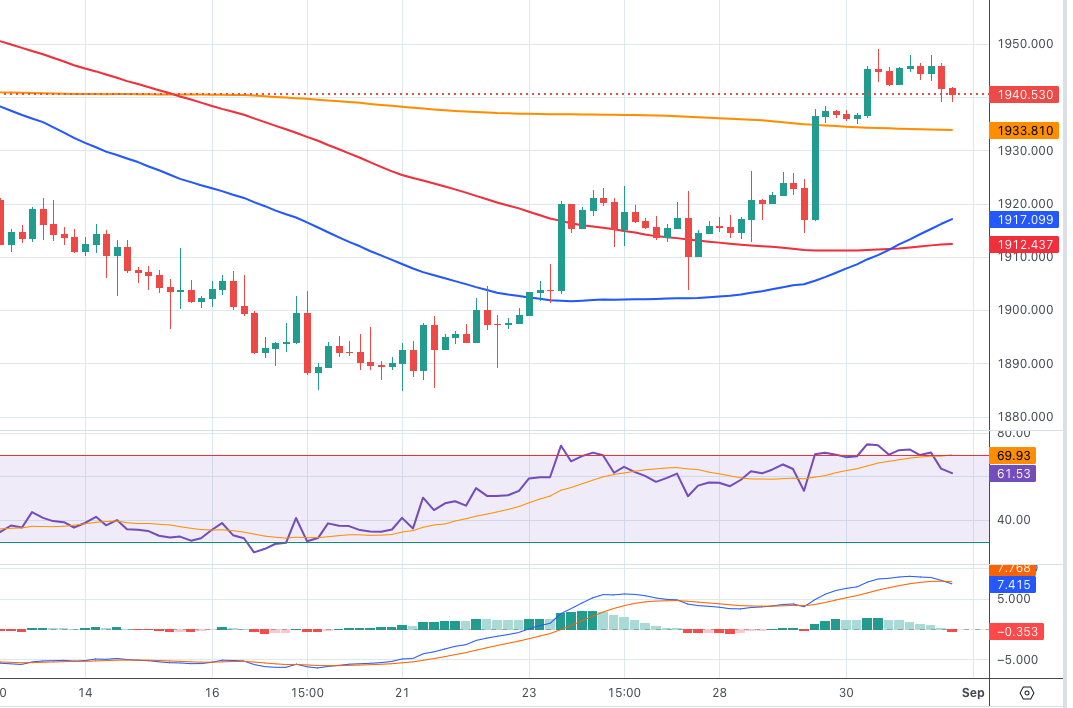
GOLD
Prices of the troy ounce of the yellow metal seem to have met quite a tough barrier around the $1950 mark so far, or four-week tops.
In fact, Thursday’s sharp rebound in the greenback in combination with declining US yields across different timeframes left the precious metal hovering around Wednesday’s closing levels in the $1940 zone.
Meanwhile, bullion should remain under the microscope ahead of the release of the monthly Nonfarm Payrolls on Friday.
The continuation of the uptrend in gold should face another test at the transitory 100-day SMA of $1954. Furthermore, the July high of $1987 is a substantial barrier to overcome before reaching the psychological milestone of $ 2000. The surpass of the latter level might open the way for a challenge of the 2023 peak at $2067 (May 4), then the 2022 top at $2070 (March 8) and the all-time high at $2075 (August 7, 2020). Just the opposite, the major 200-day SMA at $1913 is projected to withstand the initial negative test ahead of the August low of $1884 and the 2023 bottom of $1804 (February 28), all of which are prior to the critical support zone of $1800.
Resistance levels: $1949 $1972 $1982 (4H chart)
Support levels: $1933 $1903 $1884 (4H chart)
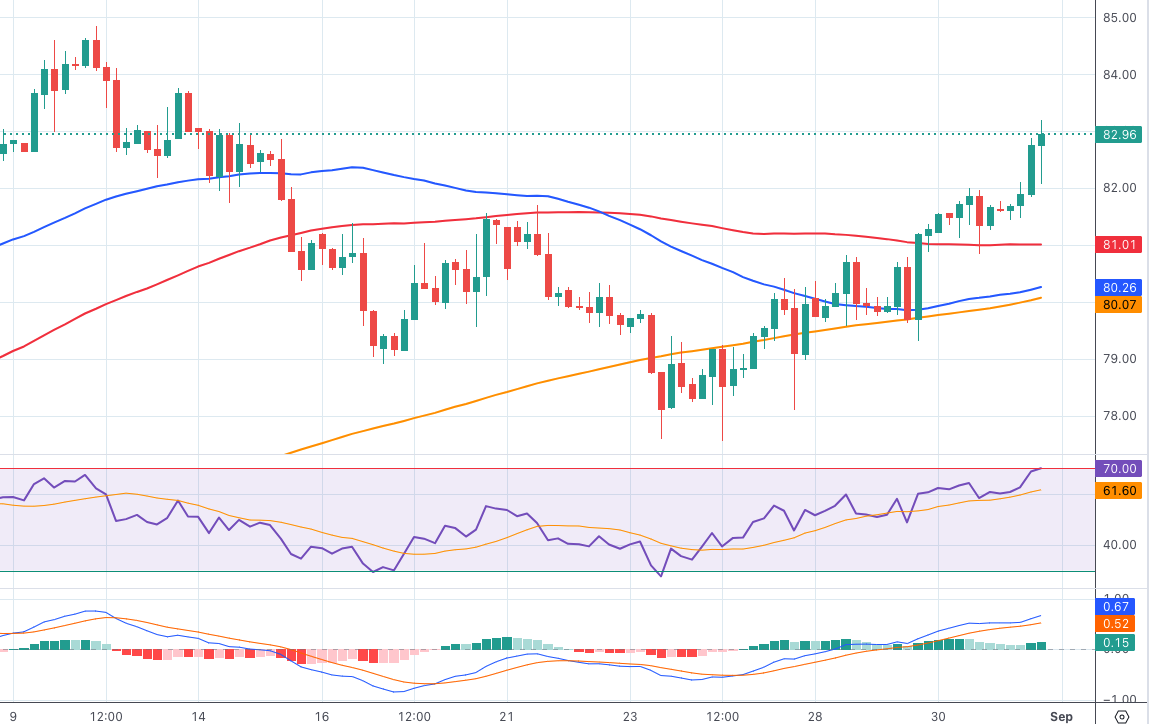
CRUDE WTI
WTI prices extended the weekly recovery and surpassed the $83.00 mark per barrel for the first time since mid-August on Thursday.
Extra gains in the commodity came as traders assessed the larger-than-expected drop in weekly US crude oil inventories (10.6M barrels), as reported by the EIA on Wednesday, as well as Saudi Arabia’s announcement that the country will extend its oil production cuts into October. In addition, rising speculation that the Fed might end its hiking cycle also contributed to the upside bias in crude oil.
Somewhat tempering the upside potential, Chinese PMIs measured by NBS remained far from sparking any hope of a meaningful near-term recovery in that economy.
If the rally continues, the next upward hurdle for WTI seems to be the 2023 high of $84.85 (August 10), followed by the November 2022 top of $93.73 (November 7) and the weekly peak of $97.65 (August 30, 2022), all of which precede the crucial $100.00 per barrel. The initial support in the opposite direction is at the August low of $77.64 (August 24), followed by the 200-day SMA at $75.98. WTI may assault the weekly lows of $73.89 (July 17), $66.86 (June 12), and $63.61 (May 4) after this zone is cleared, ahead of the 2023 low of $63.61. (May 4). A deeper decrease might push prices closer to the December 2021 low of $62.46 (December 2) before reaching the critical $60.00 per barrel barrier.
Resistance levels: $83.21 $83.77 $84.85 (4H chart)
Support levels: $80.85 $79.31 $78.11 (4H chart)
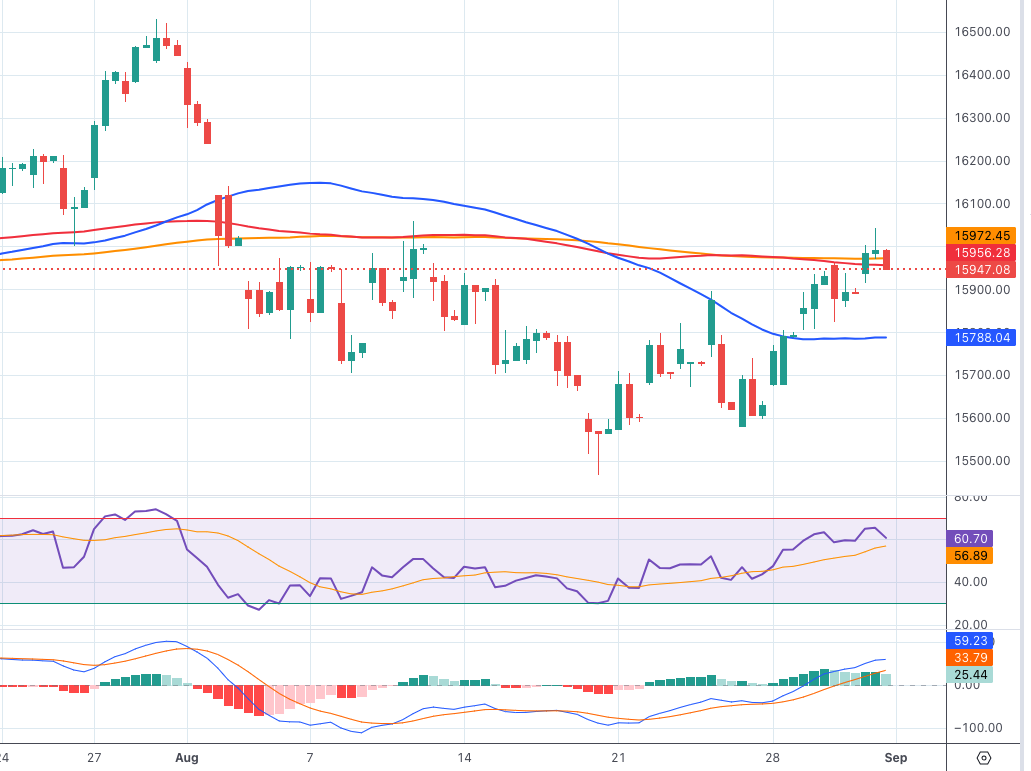
GER40
German equities managed to print a humble advance when tracked by the DAX40 on Thursday.
Despite initially surpassing the 16000 level, stocks retraced and ended the session with a slight positive movement. Market participants analyzed disappointing data from Germany's Retail Sales and the monthly jobs report, while preliminary inflation figures in the euro area failed to surprise anyone.
Furthermore, concerns about stagflation have resurfaced due to discouraging results from fundamentals in the region. Additionally, persistent worries about the absence of a recovery in China contributed to a cautious sentiment ahead of the important US Nonfarm Payrolls report scheduled for Friday.
In contrast to the marginal daily increase in the index, the yields of 10-year bunds approached a two-week low, hovering around 2.45%.
Further DAX40 advances should aim for the weekly high at 16042 (August 31), which is supported by the temporary 55-day SMA (15959) and is just ahead of another weekly high at 16060 (August 10). A break above this level might refocus investors' attention on a potential challenge of the all-time high at 16528 (July 31). The August low of 15468 (August 18), on the other hand, indicates an urgent target ahead of the July bottom of 15456 (July 7) and the critical 200-day SMA of 15442. If the index goes below this level, it might test the March low of 14458 (March 20) before challenging the December 2022 low of 13791 (December 20) and the 2022 low of 11862 (September 28). On the daily chart, the RSI edged past the 53 mark.
Best Performers: Vonovia, Sartorius AG VZO, Zalando SE
Worst Performers: Commerzbank, Deutsche Bank AG, Covestro
Resistance levels: 16042 16060 16528 (4H chart)
Support levels: 15788 15568 15468 (4H chart)
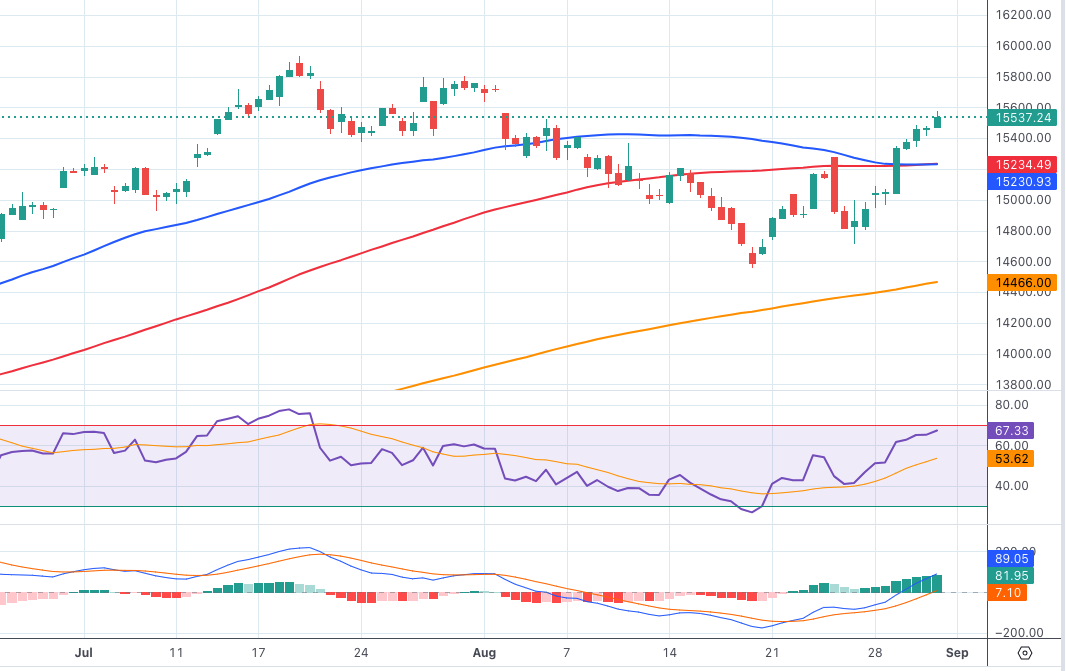
NASDAQ
The positive sentiment in the US technology industry stayed consistent for another day on Thursday.
On this occasion, the prominent Nasdaq 100 index climbed to reach new highs for the past four weeks, coming close to the 15600 level. However, this upward movement lost some momentum as the NA trading session concluded.
The decline in yields across different maturities, coupled with the growing belief that the Fed's rate hike in July could potentially mark the conclusion of its series of tightening measures, seems to have provided additional support to the weekly progress of tech stocks prior to the key release of August Payrolls at the end of the week.
Should the bulls prevail, the Nasdaq 100 could possibly target the weekly high of 15803 (July 31), followed by the 2023 top of 15932 (19 July), all before the round mark of 16000. Immediate support, on the other hand, lies at the August low of 14557 (August 18), ahead of the interim 100-day SMA at 14485 and the weekly low of 14283 (June 7). If the latter is lost, the weekly low of 13520 (May 24), the 200-day SMA of 13220 and the April low of 12724 (April 25) are in danger. The everyday RSI improved past the 59 hurdle.
Top Gainers: Crowdstrike Holdings, Zscaler, Datadog
Top Losers: Sirius XM, JD.com Inc Adr, Moderna
Resistance levels: 15575 15795 15932 (4H chart)
Support levels: 14715 14557 14283 (4H chart)
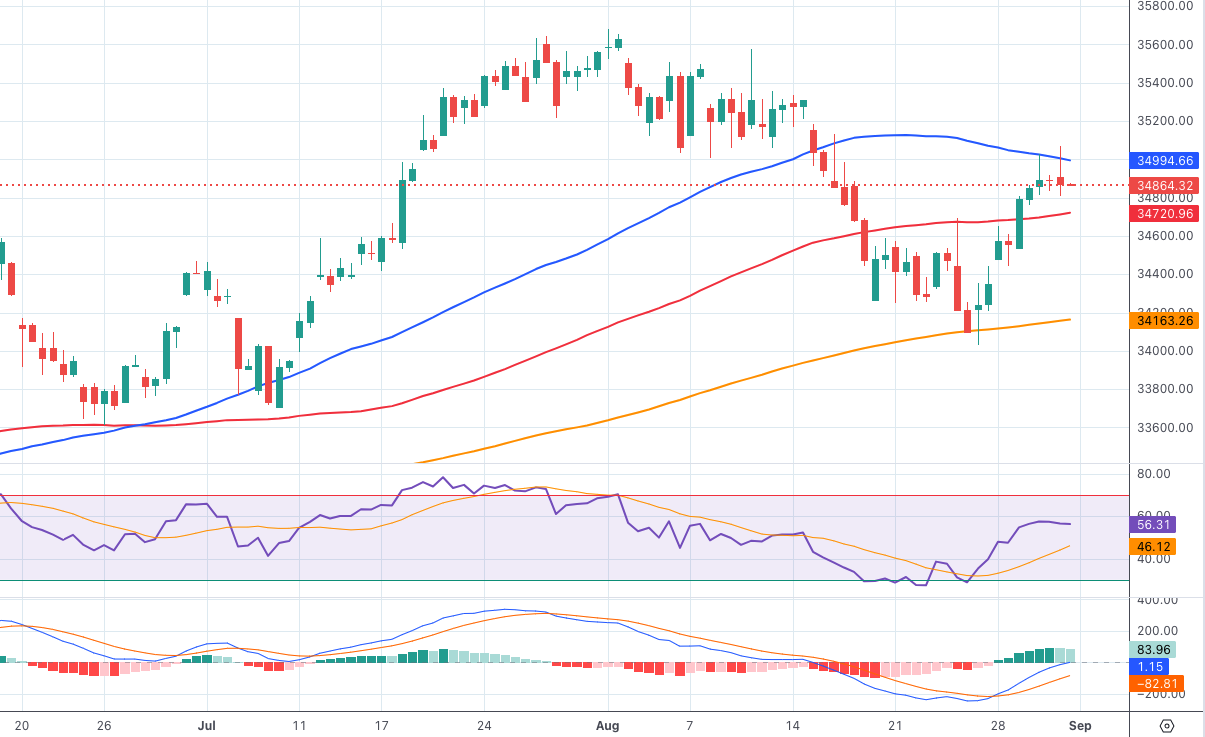
DOW JONES
Following a short trial of the territory just above the crucial 35000 level, US stocks represented by the benchmark index Dow Jones changed direction and moved back into negative territory, hovering around the 34800 range on Thursday.
Indeed, the index exhibited some volatility as investors persistently assessed another batch of disappointing data from China (this time related to NBS PMIs), along with the possibility that the Federal Reserve might opt not to increase interest rates in the coming months. This view was particularly exacerbated on Thursday following the release of US inflation figures tracked by the PCE for the month of July.
All in all, the Dow Jones dropped 0.13% to 34879, the S&P500 gained 0.16% to 4521, and the tech-reference Nasdaq Composite gained 0.36% to 14069.
The next uptrend for the Dow Jones appears to be the weekly high of 35070 (August 31). Breaking this level exposes the 2023 top at 35679 (August 1), seconded by the February 2022 top at 35824 (February 9) and the all-time peak at 36952 (January 5, 2022). Conversely, a break of the August low of 34029 (August 25) could put the index on track to revisit the critical 200-day SMA at 33765, ahead of the July low of 33705 (July 10). This will be followed by the May low of 32586 (May 25) before reaching the 2023 low of 31429 (March 15). On the daily chart, the RSI broke below the 52 level.
Top Performers: Salesforce Inc, 3M, Verizon
Worst Performers: Boeing, Walgreen Boots, UnitedHealth
Resistance levels: 35070 35578 35679 (4H chart)
Support levels: 34029 33705 32586 (4H chart)
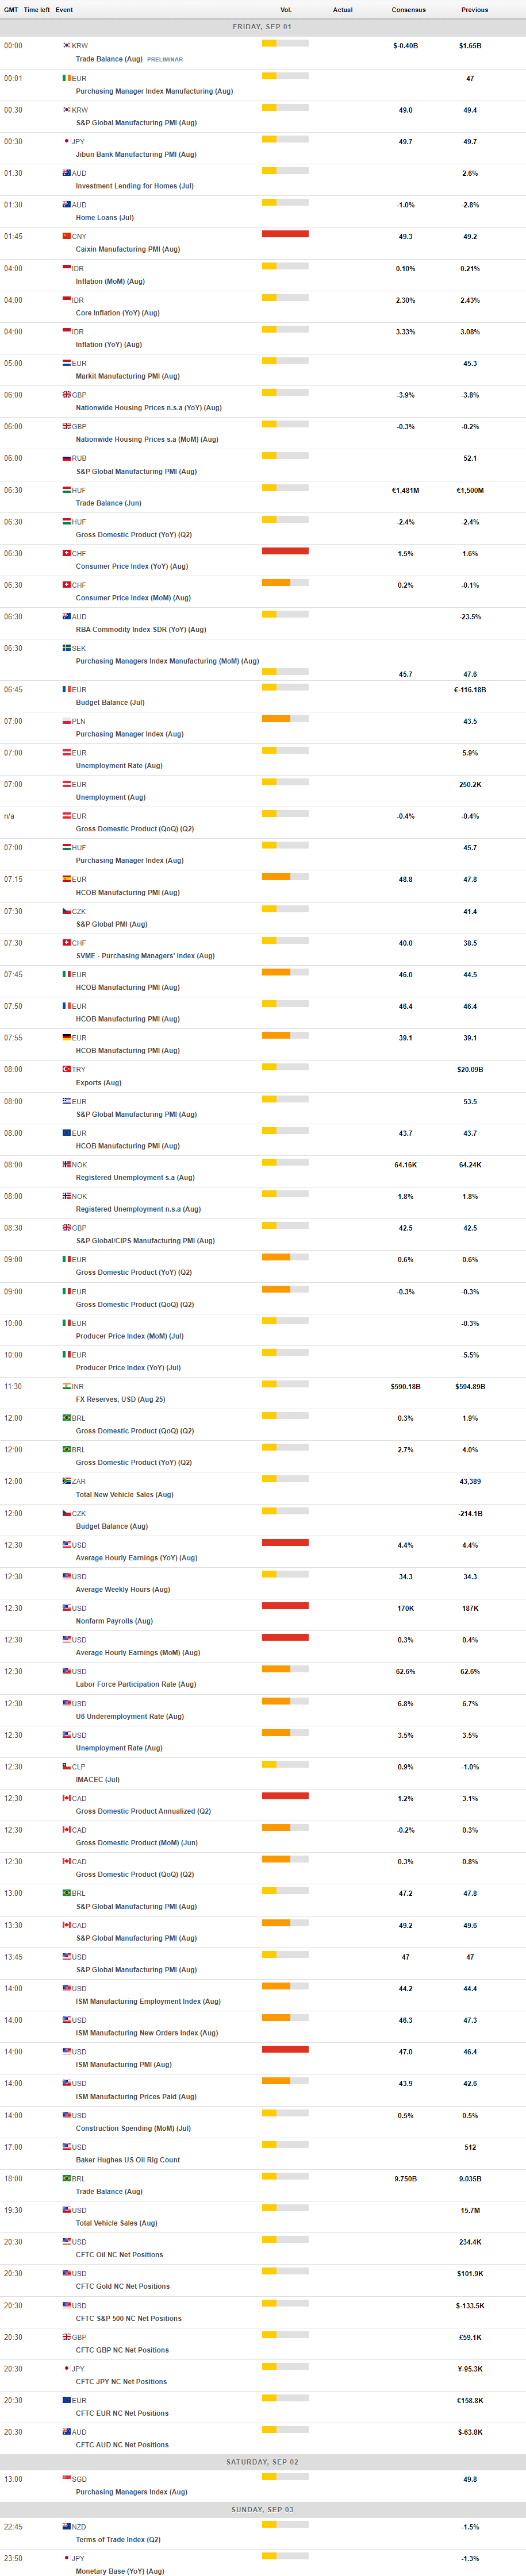
MACROECONOMIC EVENTS
All Information & Updates provided by:

All information relating to the financial markets available on this page has been prepared and issued by FXStreet (Forexstreet SL, Spain, Reg: B62498233) on the basis of publicly available information and all information believed to be reliable and does not conflict with Kuwaiti local laws, and all necessary care has been taken to before the company to ensure that the facts mentioned are correct from the source.
NCM Investment nor any of its directors or employees shall in any way be held responsible for the contents of this news, and the information contained on this page is intended only to provide clients with publicly available information and should not be construed as investment advice, report or analysis and/or constitute an offer or invitation to buy or sell financial instruments of any kind.
RISK WARNING: Forex and CFDs are highly risky leveraged products, as losses can exceed deposits. Please ensure you understand all the risks and take independent advice if necessary. NCM will segregate the clients based on the criteria of the regulator and its bylaws. NCM does not provide any advisory service; the material published does not constitute advice or a recommendation for a transaction in any financial instrument. NCM accepts no responsibility for any use of the content presented and any consequences of that use. Anyone acting on the information provided does so at their own risk.