
- Contact Us:
-

-

-

-


Daily Market Updates
04 Sep 2023
USDJPY
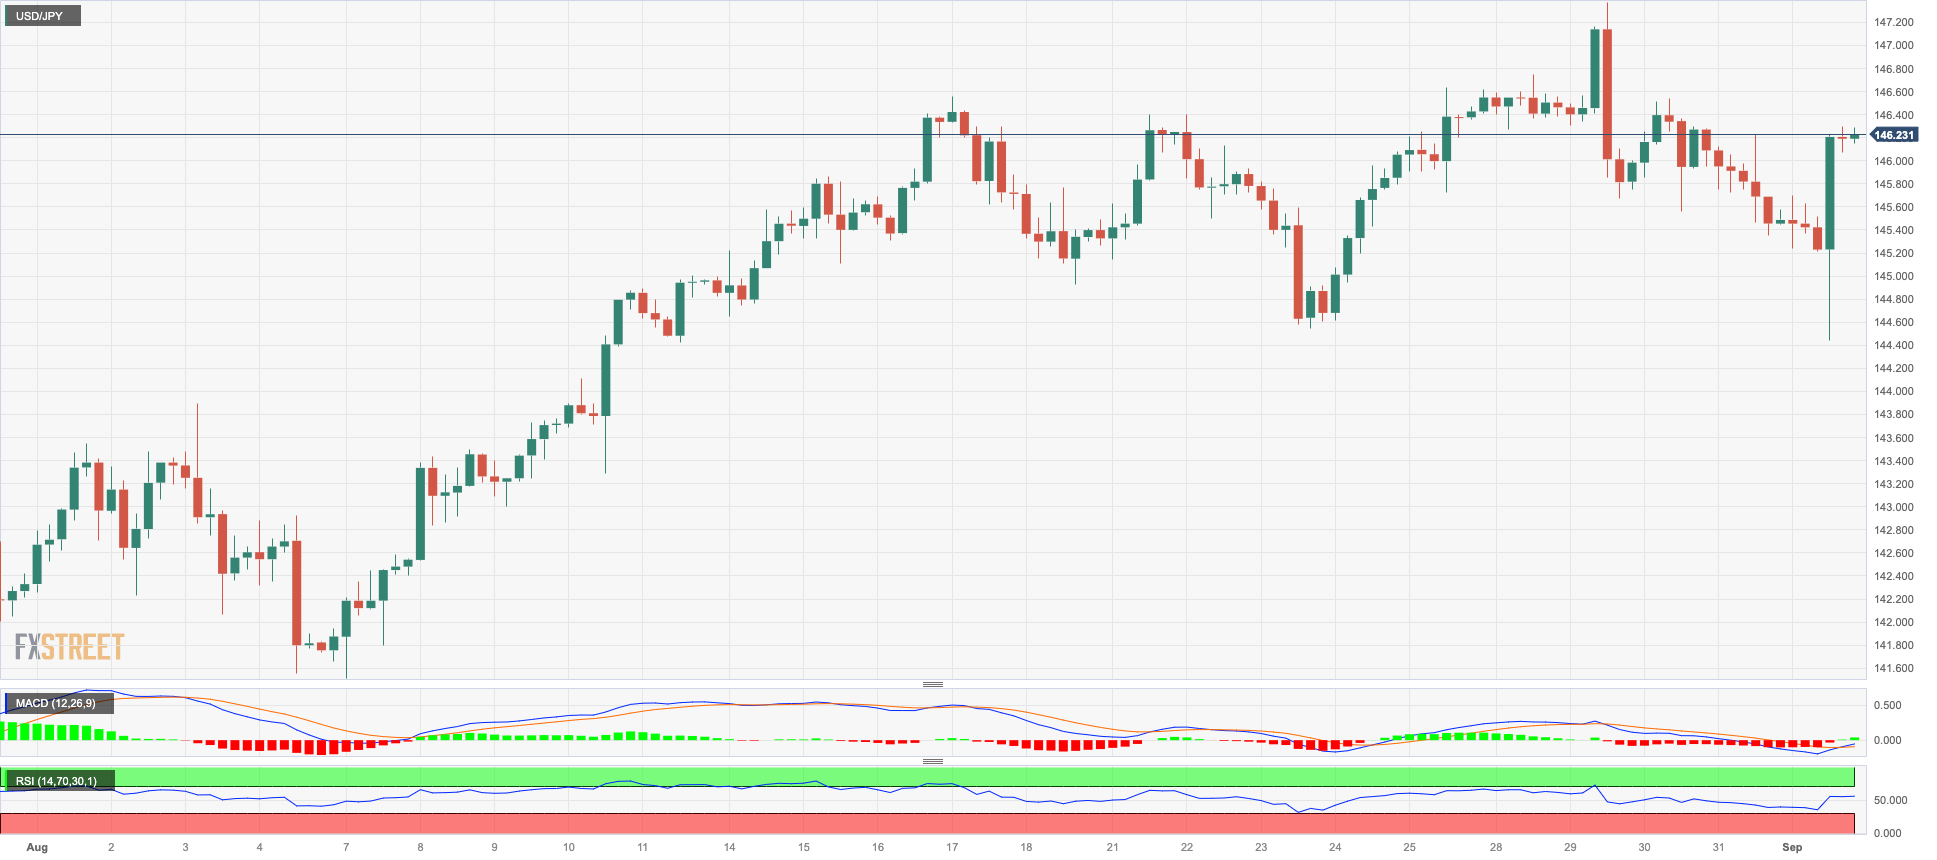
Following the post-NFP lows near 144.40, USD/JPY managed to rapidly reverse course and stage quite a robust comeback to the area past the 146.00 barrier at the end of the week, managing at the same time to maintain the range bound theme in the upper end of the range.
Indeed, the acute bounce in the dollar in combination with the equally strong rebound in US yields across the curve lent unexpected wings to the pair soon after the release of US Nonfarm Payrolls (+187K).
In the Japanese bond market, the key JGB 10-year yields edged marginally higher to the 0.64% area.
In the Japanese calendar, Capital Spending expanded at an annualized 4.5% in the April-June period, and the final Jibun Bank Manufacturing PMI held steady at 49.6 in August.
The breakout of the 2023 high of 147.37 (August 29) should prompt USD/JPY to test the 2022 top of 151.94 (October 21). Instead, the weekly low of 144.43 (September 1) takes precedence over the intermediate 55-day SMA of 143.13 and the August low of 141.50 (August 7). If this level is breached, the pair may target the weekly low of 138.05 (July 28), the July low of 137.23 (July 13), and, finally, the 200-day SMA of 136.81. A lower retracement might threaten the weekly low of 133.01 (April 26), as well as the minor level of 132.01 (April 13) and the April low of 130.62 (April 5). The daily RSI climbed to the vicinity of 60.
Resistance levels: 147.37 147.56 148.44 (4H chart)
Support levels: 144.44 143.60 141.50 (4H chart)
GBPUSD
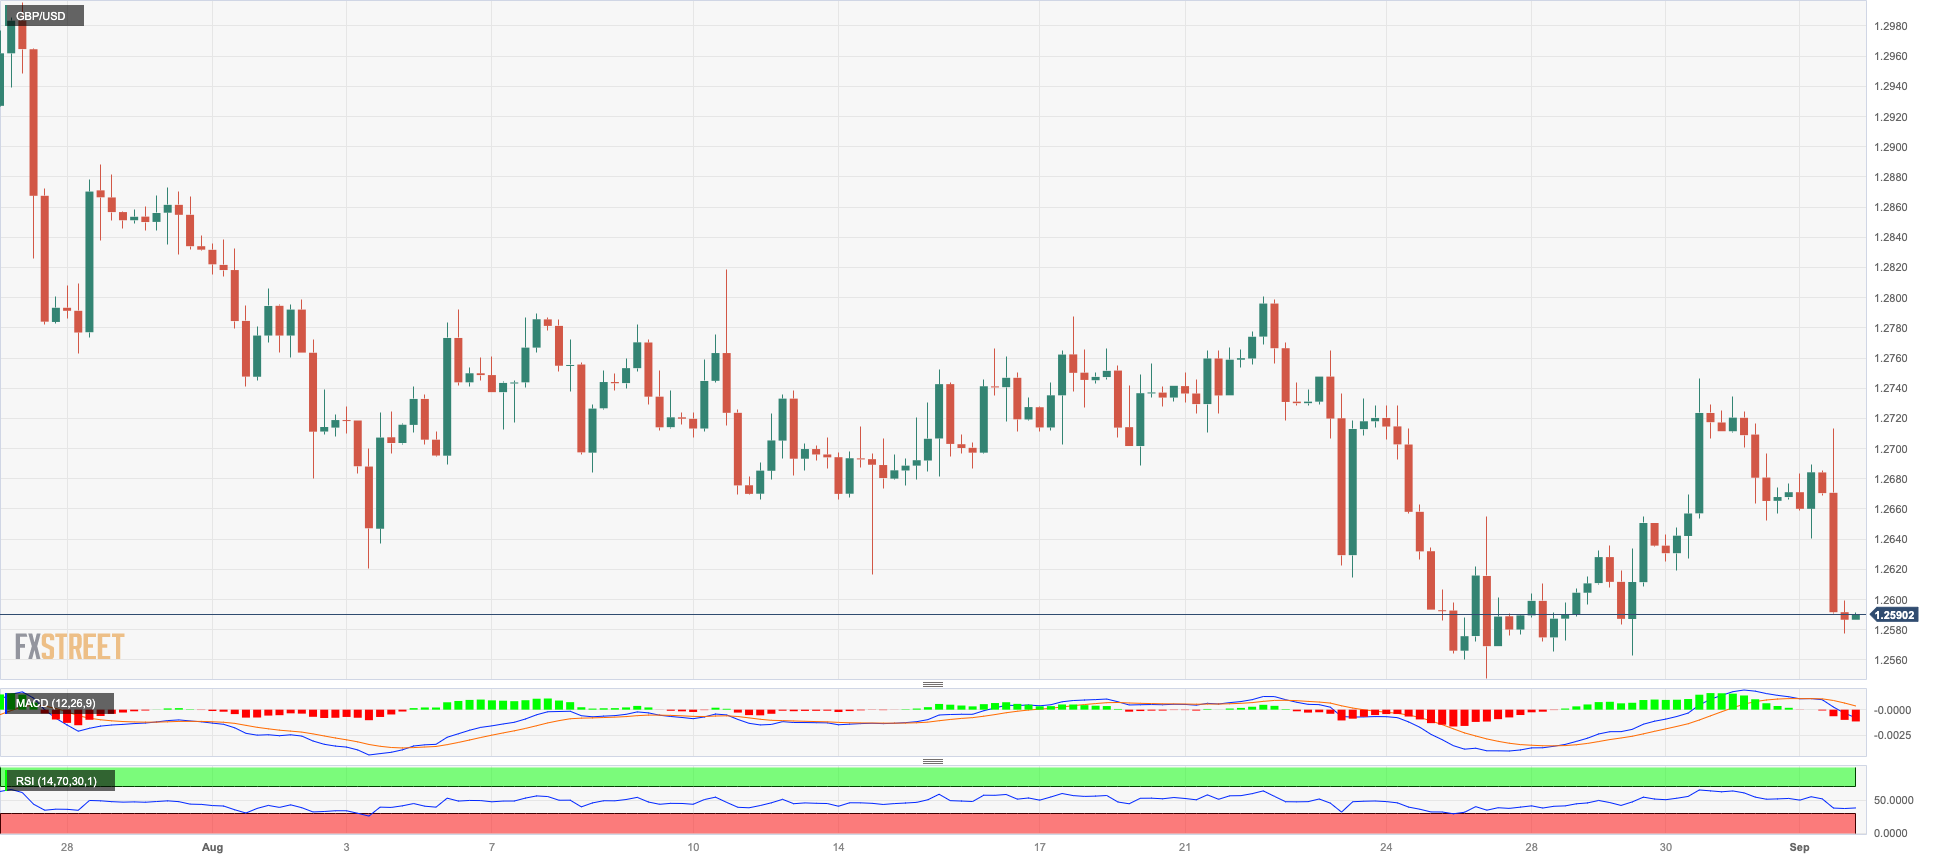
The rebound in the greenback gathered extra steam to the detriment of the risk-linked galaxy, forcing the British pound to surrender further ground and almost fully fade the advance seen in the first half of the week vs. the buck.
Against that, GBP/USD added to Thursday’s strong decline and breached the key support of 1.2600 to put the area of recent monthly lows to the test on Friday.
Looking at the daily data releases in the UK, house prices tracked by Nationwide dropped at a monthly 0.8% in August and 5.3% over the last twelve months, while the final S&P Global/CIPS Manufacturing PMI eased to 43 in August.
In case GBP/USD accelerate its losses, the next support of note emerges at the August low of 1.2547 (August 25) prior to the 2021-2023 trendline near 1.2430, an area also reinforced by the 200-day SMA at 1.2413. The breakdown of this region could open the door to the June low of 1.2368 (June 5) ahead of the May low of 1.2308 (May 25). On the other hand, Cable could recapture the preliminary 55-day SMA at 1.2773 before reaching the weekly high at 1.2818 (August 10) and another weekly top at 1.2995 (July 27), which appears closely followed by the crucial barrier of 1.3000. Once the pair clears the 2023 top at 1.3142 (July 14), the weekly peaks of 1.3146 (April 14, 2022) and 1.3298 (March 15, 2022) are likely to reappear. The RSI on the daily chart grinded lower below 40.
Resistance levels: 1.2712 1.2746 1.2800 (4H chart)
Support levels: 1.2577 1.2547 1.2486 1.2368 (4H chart)
AUDUSD
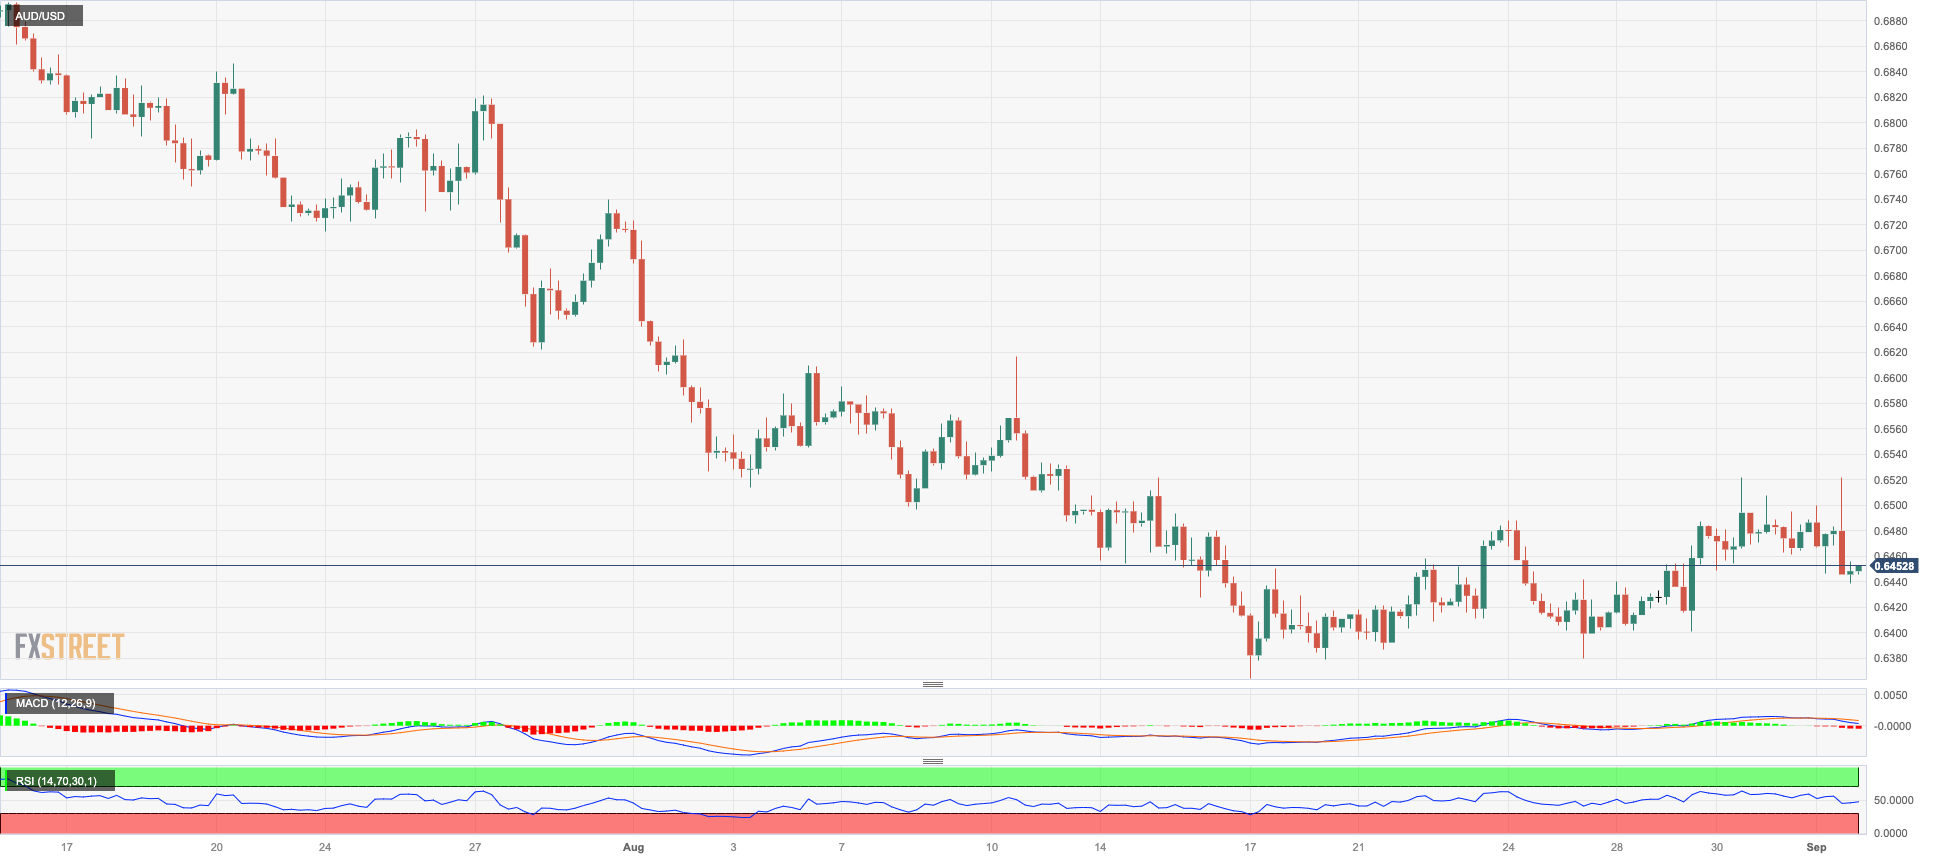
AUD/USD rapidly changed course after another failed attempt to break above the 0.6520 region at the end of the week.
Indeed, the pair came under heavy selling pressure in response to the sharp bounce in the greenback in the wake of the release of US data on Friday.
Furthermore, the Aussie dollar practically ignored another decent advance in copper prices and further gains in iron ore, as the better-than-expected Caixin Manufacturing PMI in China appears to have underpinned the broad-based upbeat mood in the commodity space.
In the Australian docket, final readings saw the Judo Bank Manufacturing PMI at 49.6 during the last month, Home Loans contracting 1.9% MoM in July, and Investment Lending for Homes shrinking 0.1% in the same period. In addition, Commodity Prices dropped 23.2% YoY in August.
A deeper retracement could now see AUD/USD revisiting the 2023 low of 0.6364 (August 17) prior to the November 2022 low of 0.6272 (November 7) and the 2022 low of 0.6179 (October 13). In contrast, the pair faces immediate resistance from the weekly high of 0.6522 (August 30), which is followed by another weekly top of 0.6616 (August 10). Above this level, the pair could challenge the 200-day SMA at 0.6720 before reaching the July peak of 0.6894 (July 14) and the June high of 0.6899 (June 16). The key 0.7000 level is the next point before the weekly top of 0.7029 (February 14) and the 2023 high of 0.7157 (February 2). The day-to-day RSI deflated to the area below 42.
Resistance levels: 0.6522 0.6582 0.6616 (4H chart)
Support levels: 06438 0.6401 0.6379 (4H chart)
GOLD
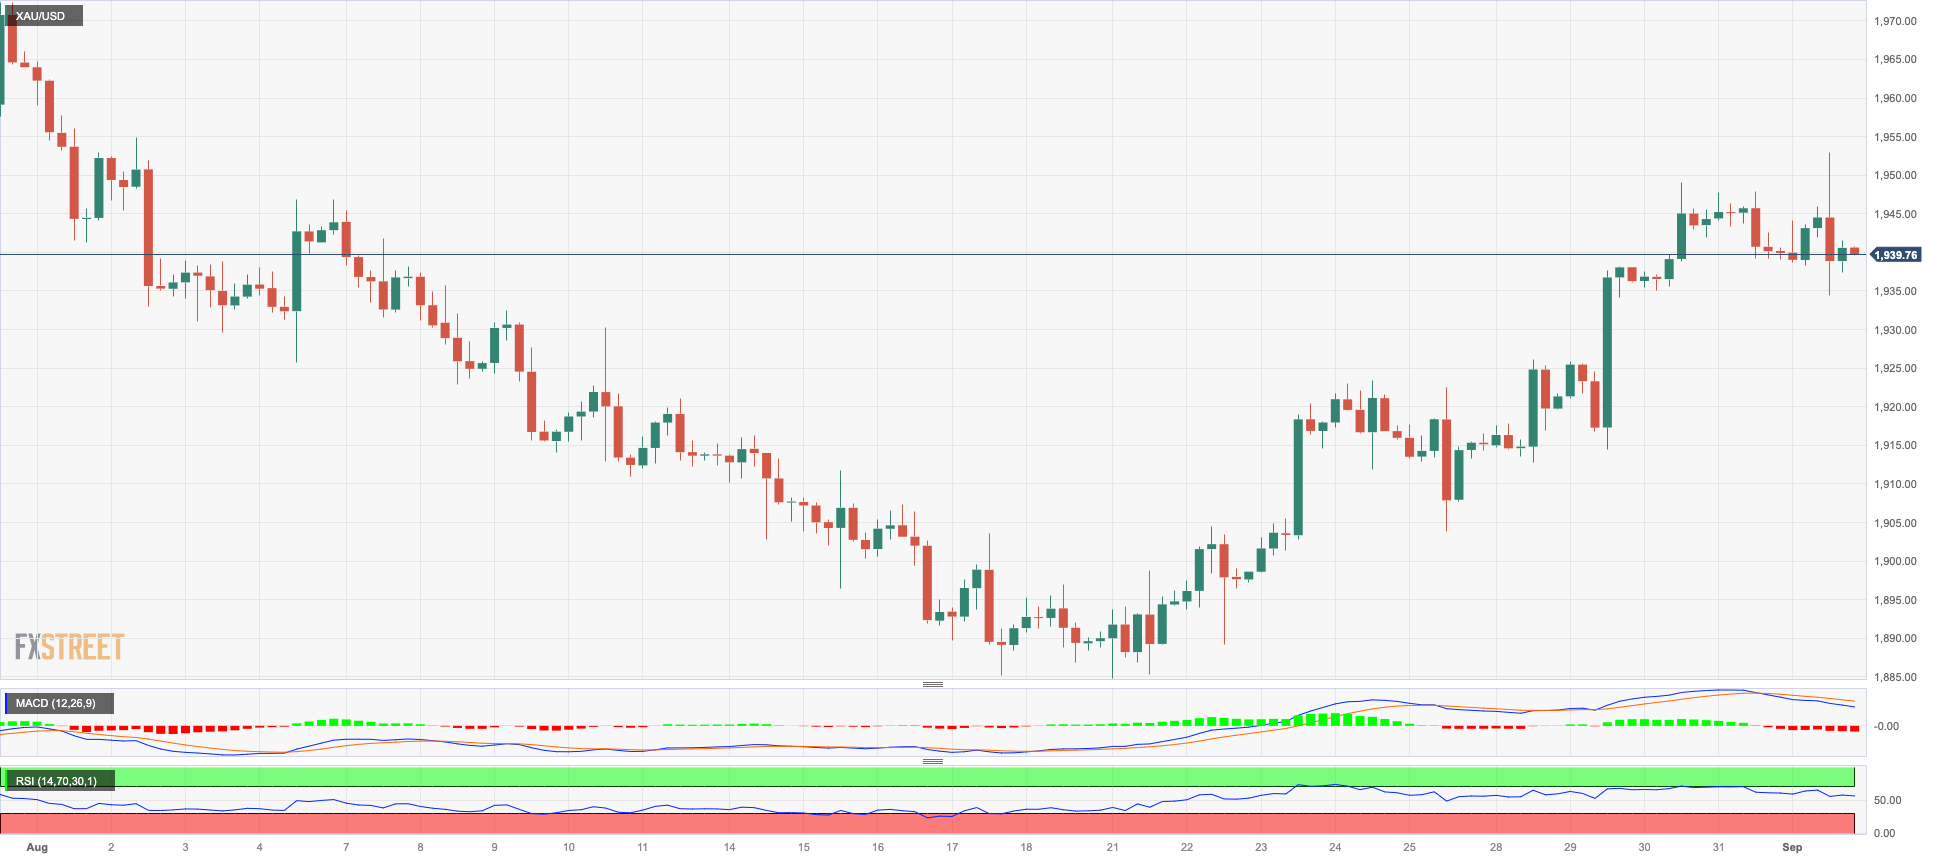
Gold prices briefly advanced to new four-week highs near $1955 per troy ounce, where the interim 100-day SMA also sits, before surrendering all those gains and ending the session around Thursday’s closing levels near $1940 amidst an inconclusive price action.
The post-Payrolls intense move higher in the greenback in combination with the marked advance in US yields across the board kept the price action around the yellow metal subdued and sponsored another daily drop.
As key US data releases are now in the rear-view mirror, the precious metal is expected to keep tracking developments around the potential next steps by the Federal Reserve regarding interest rates.
The continuation of the gold rise could be tested again around the transitory 100-day SMA of $1954. Furthermore, the July high of $1987 represents a significant hurdle to overcome before hitting the psychological threshold of $ 2000. The surpass of the latter level may pave the way for a challenge to the 2023 peak of $2067 (May 4), seconded by the 2022 top of $2070 (March 8), and the all-time high of $2075 (August 7, 2020). On the contrary, the significant 200-day SMA at $1914 is expected to resist the initial negative test ahead of the August low of $1884 and the 2023 bottom of $1804 (February 28), both of which are ahead of the important support zone of $1800.
Resistance levels: $1953 $1972 $1982 (4H chart)
Support levels: $1933 $1903 $1884 (4H chart)
CRUDE WTI
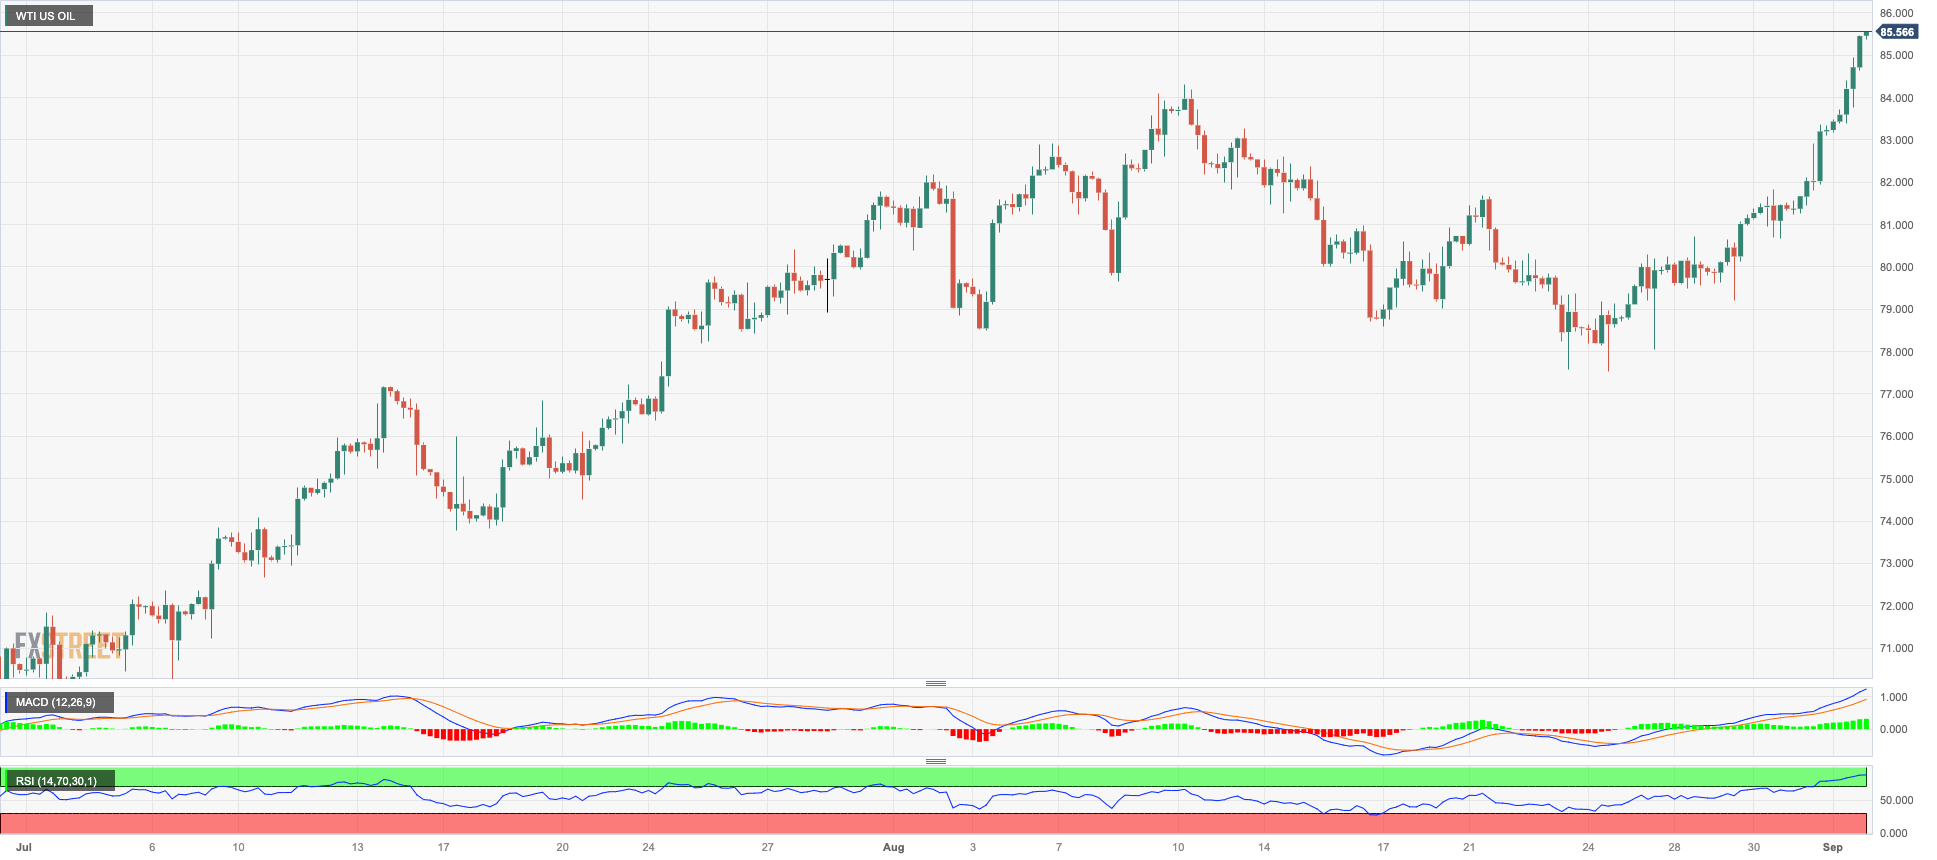
Prices of the American benchmark for sweet light crude oil rose to levels last seen in November 2022, just above the $86.00 mark per barrel, on Friday. WTI prices also closed their first week of gains after two consecutive pullbacks.
Once again, the tight supply narrative (bolstered by Saudi Arabia's oil production cuts, Russia’s reduction of its crude oil exports, and the persistent drop in US supplies) ruled the sentiment among traders at the end of the week.
Furthermore, the likelihood that the Fed might halt its tightening campaign and the resilience observed in the US economy continued to run in the background, contributing further to the upside bias in the commodity.
Closing the oil-related docket, driller Baker Hughes reported that the total US oil rigs remained at 512 in the week ended on September 1.
If the rally continues, the next upward obstacle for WTI appears to be the round level of $90.00 followed by the November 2022 high of $93.73 (November 7) and the weekly peak of $97.65 (August 30, 2022), all of which precede the psychological $100.00 mark per barrel. The initial reversal support is at the August low of $77.64 (August 24), ahead of the 200-day SMA at $76.01. After this zone is cleared, WTI may confront the weekly lows of $73.89 (July 17), $66.86 (June 12), and $63.61 (May 4) before testing the 2023 low of $63.61. A further drop might drive prices closer to the December 2021 low of $62.46 (December 2) before the key $60.00 level.
Resistance levels: $85.65 $88.65 $93.73 (4H chart)
Support levels: $80.38 $79.31 $78.11 (4H chart)
GER40
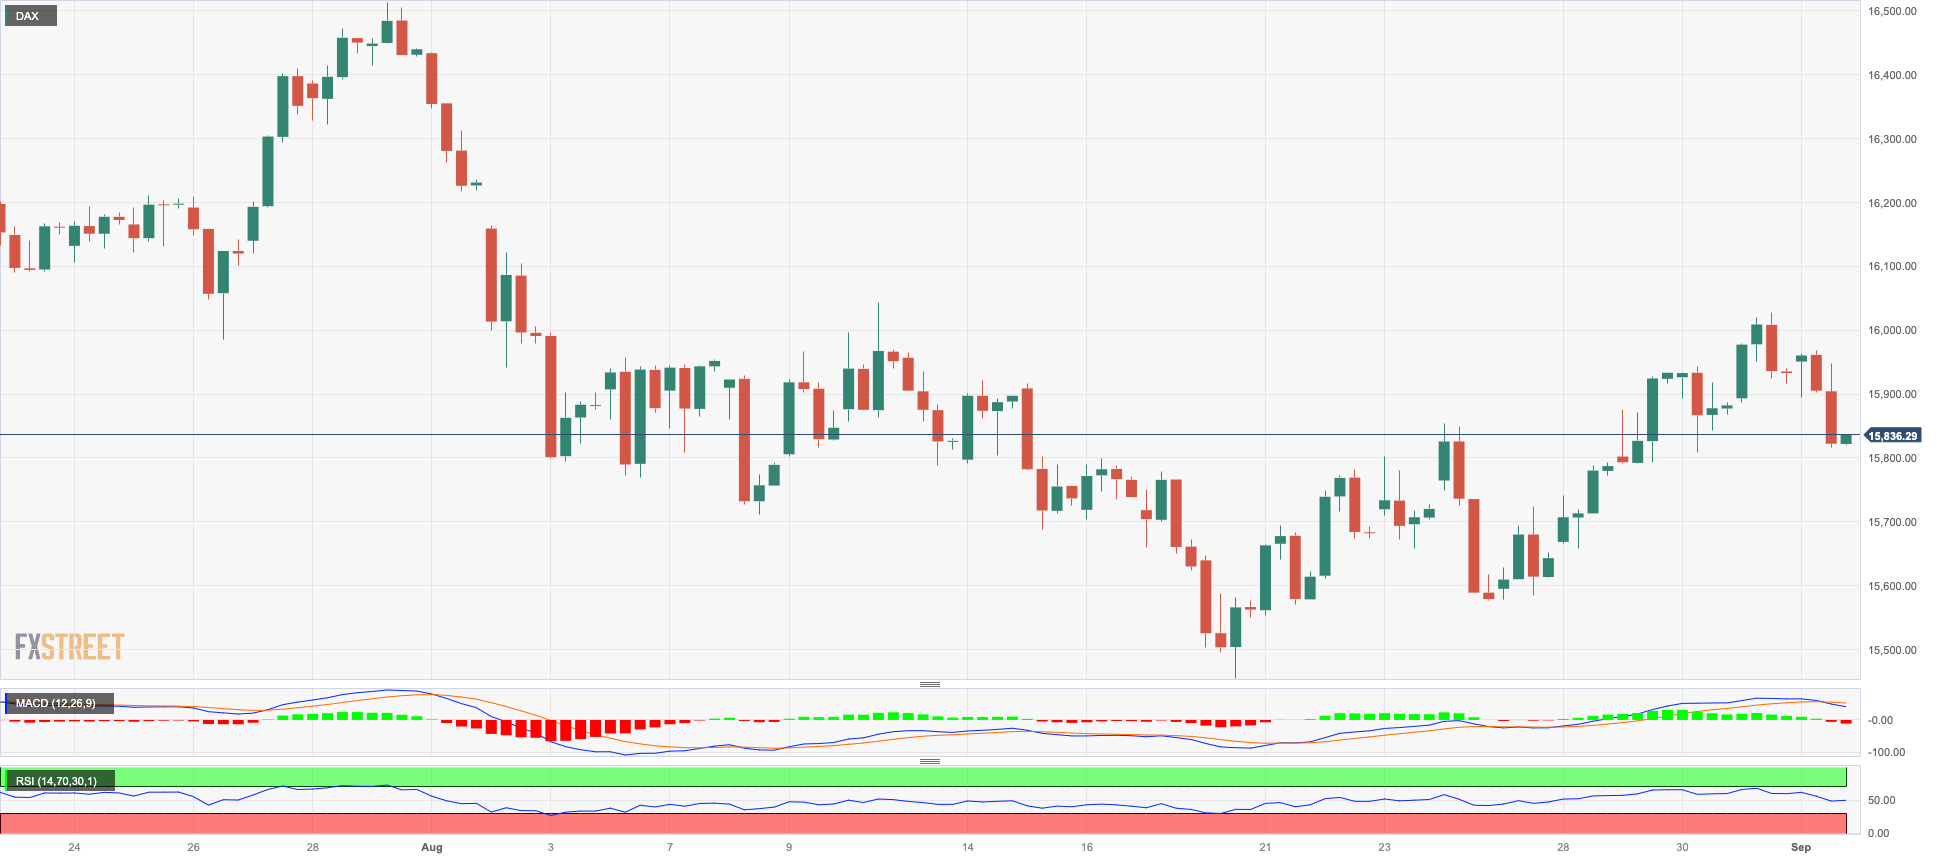
Germany’s benchmark index, the DAX40, continued its erratic performance so far this week and ended Friday’s session with marked losses around the 15800 zone.
Despite the daily pullback, the index managed to clinch the second week in a row of gains, although a close above the key 16000 threshold still appears elusive.
German equities traded on the defensive in a context dominated by rising uncertainty around the potential next steps by the European Central Bank (ECB) as well as rising bets on the Fed’s pause in its meeting later in the month.
In line with their US peers, the 10-year bund yields left behind part of the recent weakness and advanced to 2.55%.
Further DAX40 gains should target the weekly high of 16042 (August 31), which is supported by the proximity of the temporary 55-day SMA (15949) and is just ahead of another weekly high of 16060 (August 10). A break above this level might refocus investors' attention on a possible challenge to the all-time high of 16528 (July 31). Having said that, the August low of 15468 (August 18) indicates an urgent objective ahead of the July low of 15456 (July 7), which appears propped up by the important 200-day SMA of 15449. A drop below the latter may try the March bottom of 14458 (March 20) prior to the December 2022 low of 13791 (December 20) and the 2022 low of 11862 (September 28). On the daily graph, the RSI slipped back below the 50 threshold.
Best Performers: Beiersdorf AG, Bayer, Henkel VZO
Worst Performers: Volkswagen VZO, Dr Ing hc F Porsche Prf, BMW ST
Resistance levels: 16042 16060 16528 (4H chart)
Support levels: 15791 15568 15468 (4H chart)
NASDAQ
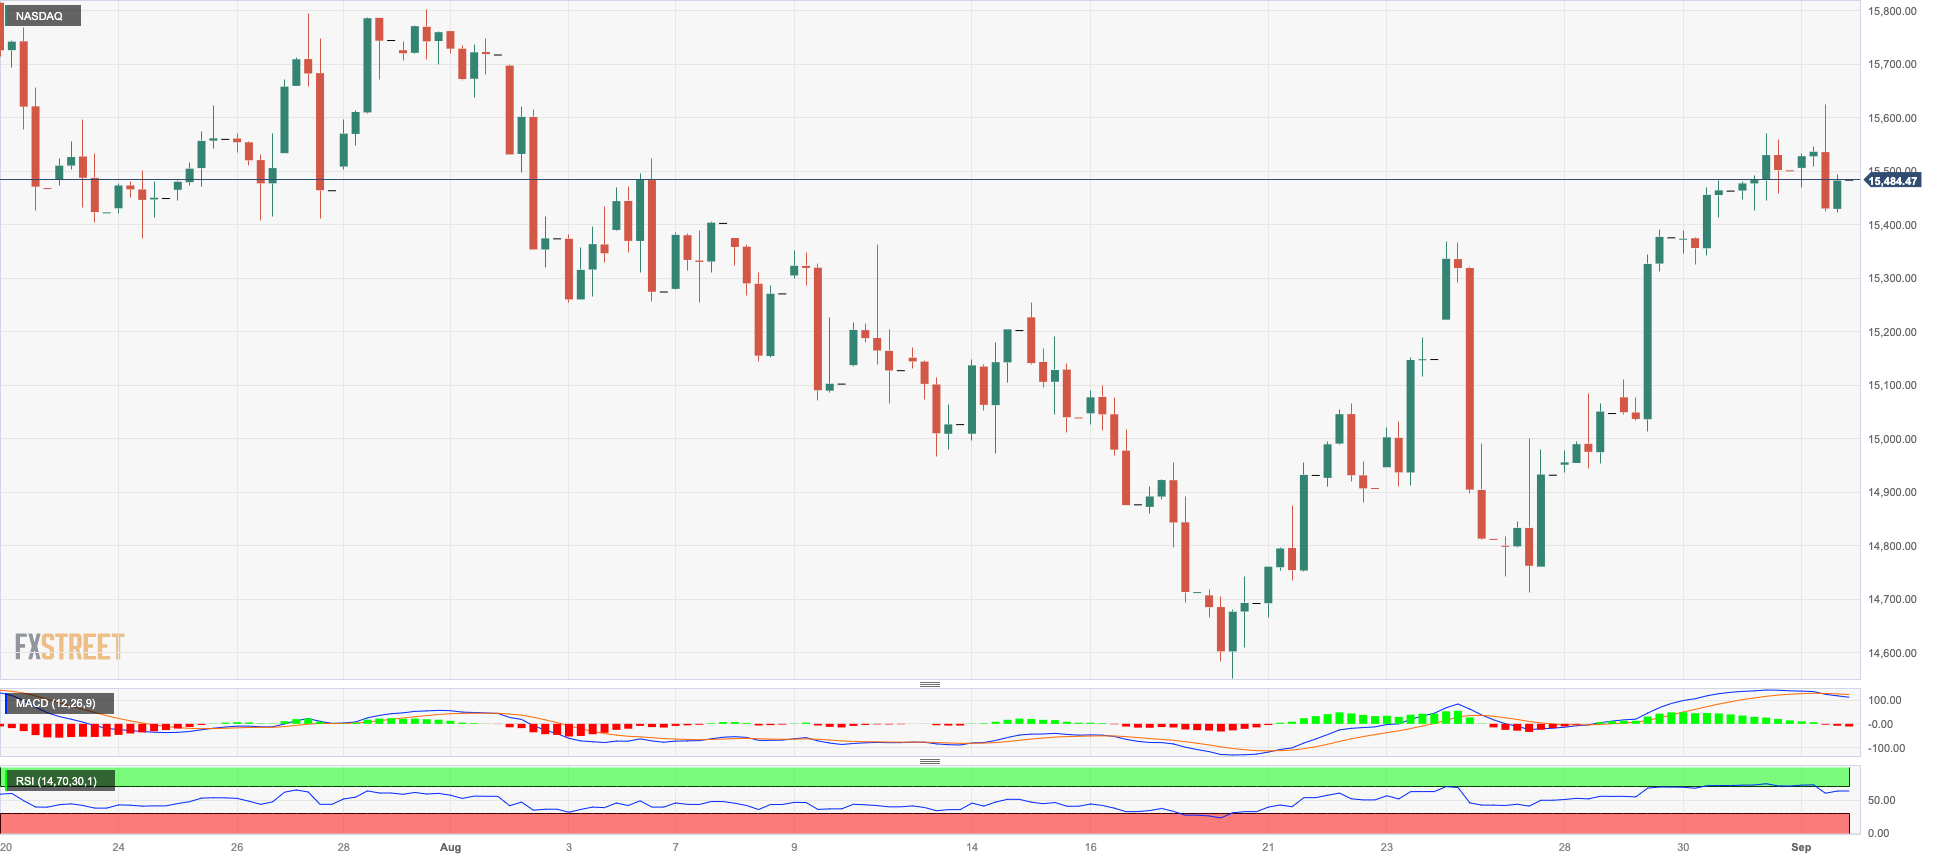
Following its climb to new four-week highs beyond the 15600 level, the tech benchmark Nasdaq 100, relinquished those gains and concluded Friday's session with a slight decline. This reversal occurred after a streak of five consecutive sessions of upward movement.
The index's abrupt correction was prompted by the significant recovery of the greenback during the latter portion of the week and the reversal of US bond yields across various maturity periods, all amidst growing confidence that the Federal Reserve may maintain interest rates unchanged for the remainder of the year, as well as the increasing likelihood of rate reductions in the first half of 2024.
Should the bulls prevail, the Nasdaq 100 is expected to initially target the weekly high of 15618 (September 1) prior to another weekly top at 15803 (July 31), followed by the 2023 peak of 15932 (July 19) and the round 16000 mark. Immediate support, on the other hand, lies at the August low of 14557 (August 18), ahead of the transitory 100-day SMA at 14511 and the weekly low of 14283 (June 7). If the latter is lost, the weekly low of 13520 (May 24), the 200-day SMA of 13239 and the April low of 12724 (April 25) are in danger. The RSI on a daily basis remained stable around 59.
Top Gainers: Lululemon Athletica, PDD Holdings DRC, Intel
Top Losers: Warner Bros Discovery, Walgreen Boots, Broadcom
Resistance levels: 15618 15795 15932 (4H chart)
Support levels: 15227 14715 14557 (4H chart)
DOW JONES
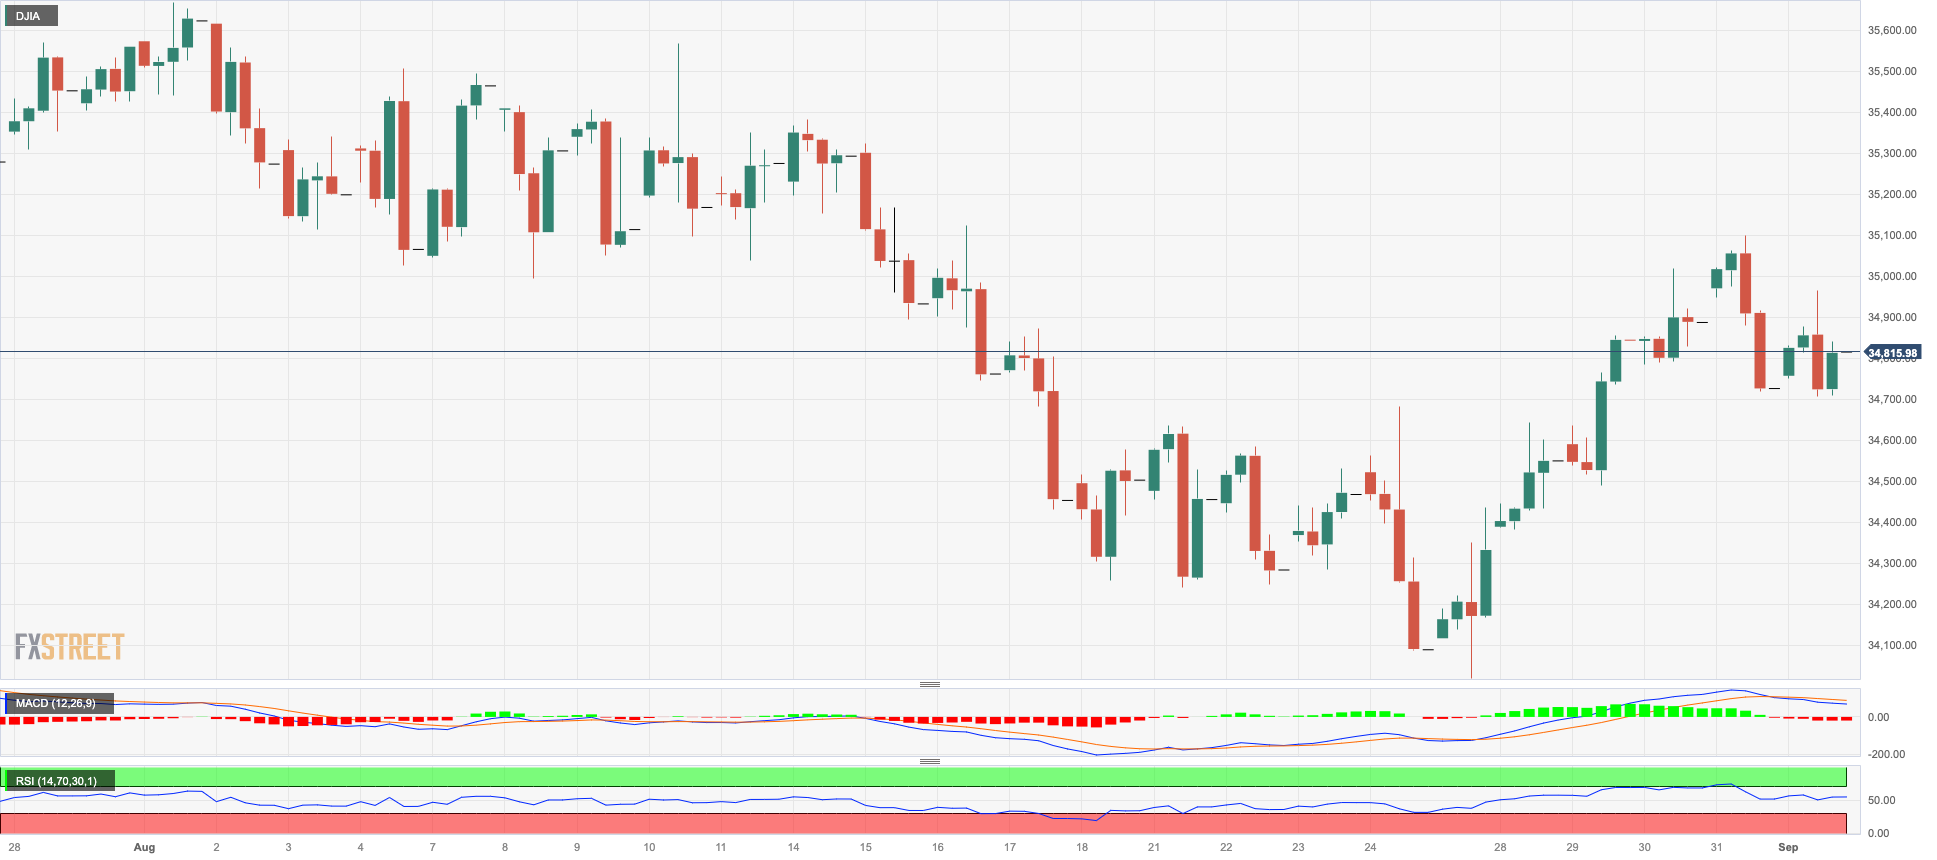
Equities measured by the Dow Jones managed to reverse the previous daily decline and advance once again to the vicinity of the 35000 threshold at the end of the week.
In addition, looking at the weekly chart, the index closed its first week of gains after two straight retracements.
The optimism among market participants returned on Friday after further cooling of the US labour market (as per the latest Nonfarm Payrolls figures) reinforced the perception that the Fed might keep the Fed Funds Target Range (FFTR) unchanged at its September meeting.
Back to the Fed, L. Mester (Cleveland) stated that despite recent improvements, inflation continues to be at an elevated level and the labour market maintains its strength. She foresaw that forthcoming policy choices would revolve around the careful management of the risks and intertemporal consequences associated with both tightening and loosening monetary policy.
At the end of the week, the Dow Jones gained 0.33% to 34837, the S&P500 advanced 0.18% to 4515, and the tech-benchmark Nasdaq Composite retreated 0.02% to 14031.
The next uptrend for the Dow Jones appears to be the weekly high of 35070 (August 31). A break above this level will reveal the 2023 top at 35679 (August 1), followed by the February 2022 peak at 35824 (February 9) and the all-time high at 36952 (January 5, 2022). On the opposite side, a breakdown of the August low of 34029 (August 25) could put the index on track to revisit the critical 200-day SMA at 33771, prior to the July low of 33705 (July 10). This will be followed by the May low of 32586 (May 25) before the 2023 low of 31429 (March 15). The everyday RSI rose to the proximity of 52.
Top Performers: Intel, Chevron, Caterpillar
Worst Performers: Walgreen Boots, Walt Disney, Coca-Cola
Resistance levels: 35070 35578 35679 (4H chart)
Support levels: 34719 34029 33705 (4H chart)
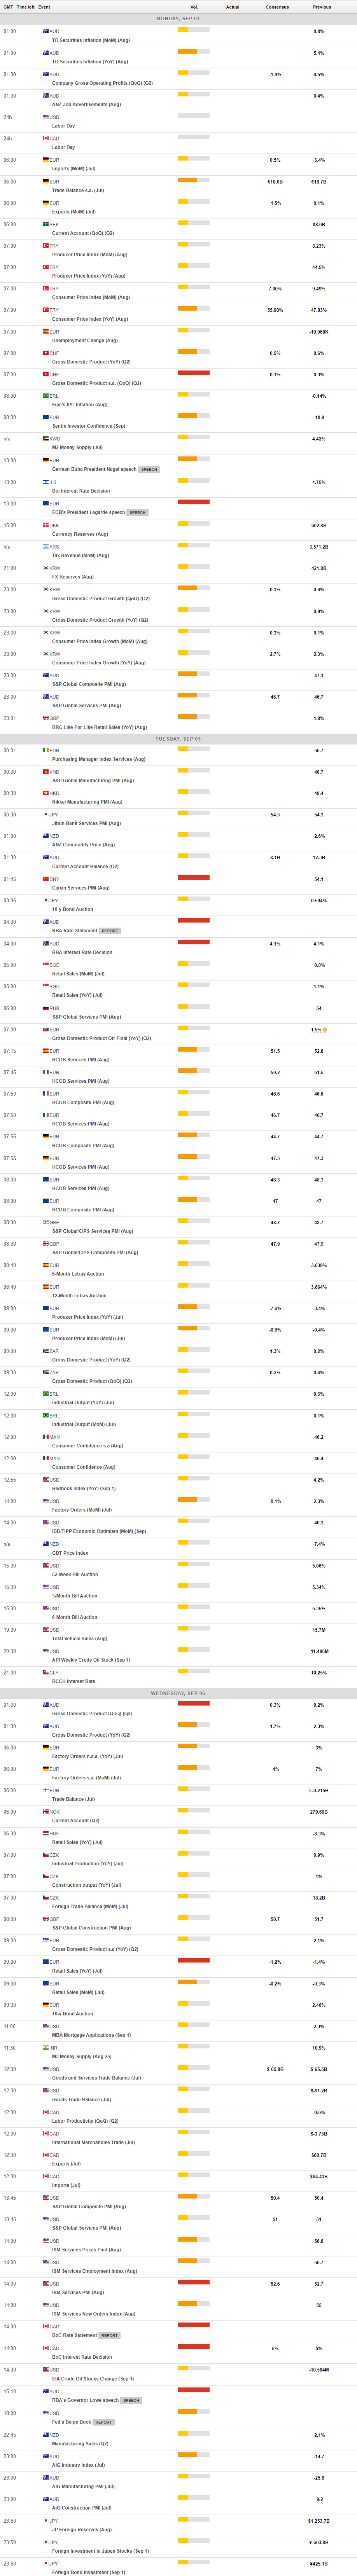
MACROECONOMIC EVENTS
All Information & Updates provided by:

All information relating to the financial markets available on this page has been prepared and issued by FXStreet (Forexstreet SL, Spain, Reg: B62498233) on the basis of publicly available information and all information believed to be reliable and does not conflict with Kuwaiti local laws, and all necessary care has been taken to before the company to ensure that the facts mentioned are correct from the source.
NCM Investment nor any of its directors or employees shall in any way be held responsible for the contents of this news, and the information contained on this page is intended only to provide clients with publicly available information and should not be construed as investment advice, report or analysis and/or constitute an offer or invitation to buy or sell financial instruments of any kind.
RISK WARNING: Forex and CFDs are highly risky leveraged products, as losses can exceed deposits. Please ensure you understand all the risks and take independent advice if necessary. NCM will segregate the clients based on the criteria of the regulator and its bylaws. NCM does not provide any advisory service; the material published does not constitute advice or a recommendation for a transaction in any financial instrument. NCM accepts no responsibility for any use of the content presented and any consequences of that use. Anyone acting on the information provided does so at their own risk.