
- Contact Us:
-

-

-

-


Daily Market Updates
05 Sep 2023
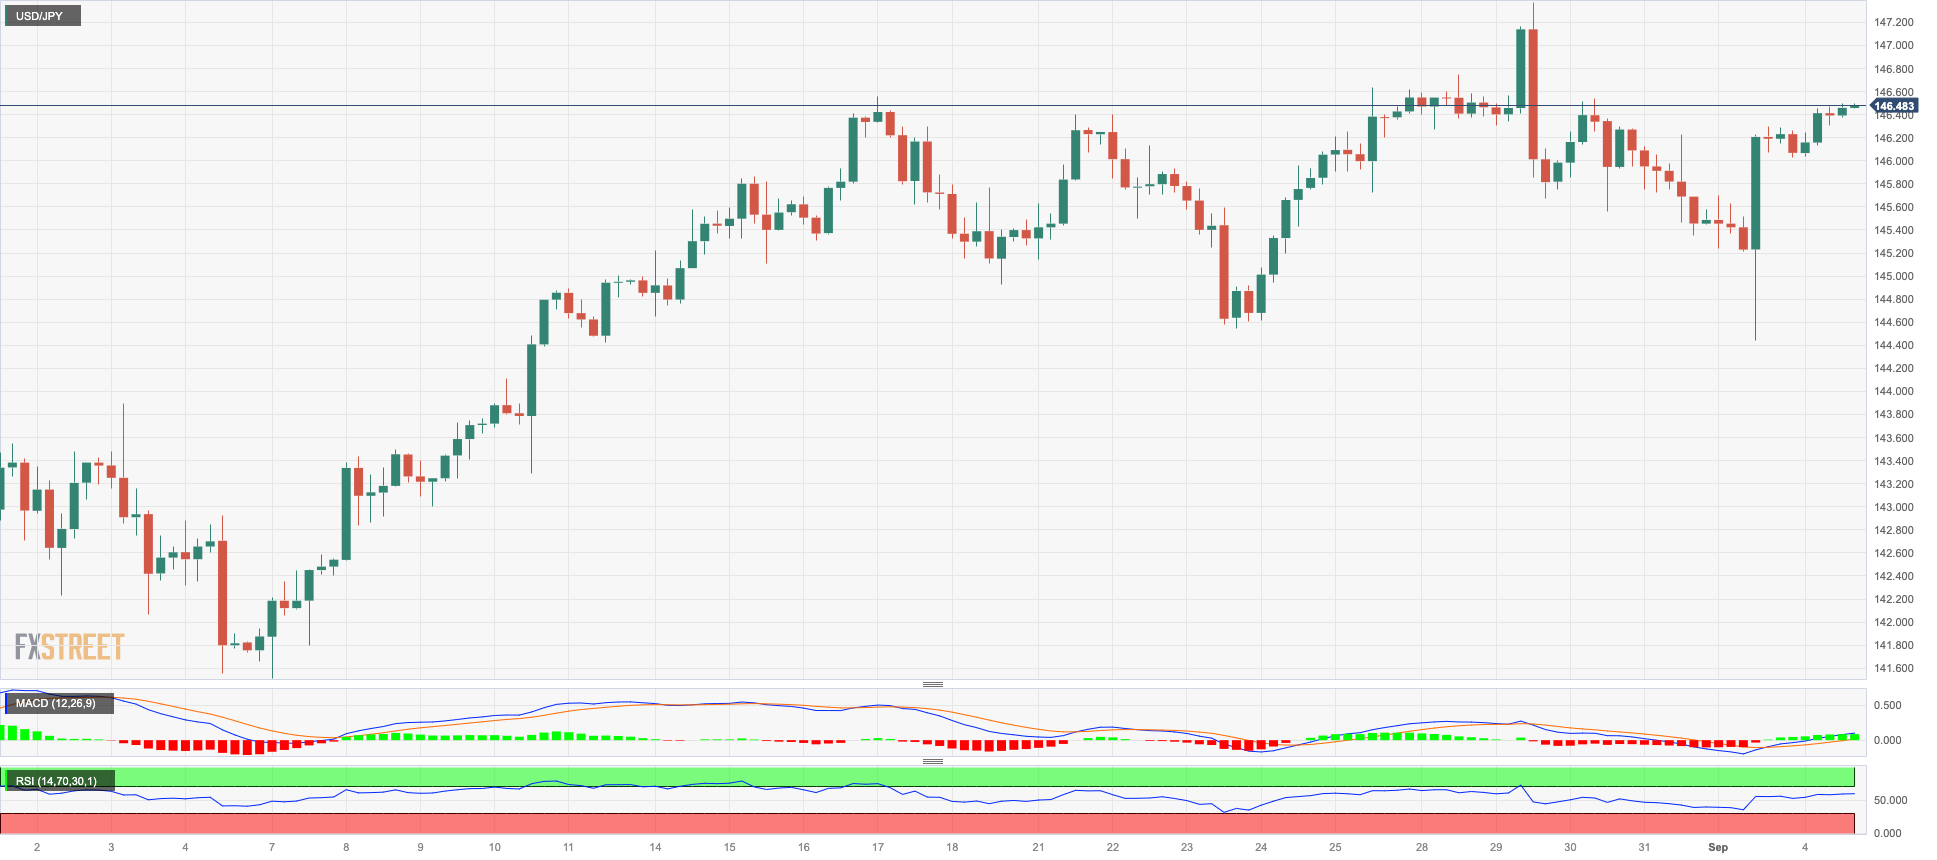
USDJPY
USD/JPY added to Friday’s uptick and briefly traded near multi-day peaks near 146.50 on Monday.
The prevailing risk-on environment seems to have been the exclusive driver of the selling pressure hitting the Japanese currency at the beginning of the week amidst the lack of activity in the US bond market and the apathetic trade in the JGB 10-year yields.
The Japanese docket was empty on Monday ahead of Tuesday’s releases of Household Spending, the final Services PMI, and a 10-year JGB Auction.
If USD/JPY breaks above the 2023 high of 147.37 (August 29), it will likely challenge the 2022 top of 151.94 (October 21). The weekly low of 144.43 (September 1), rather than the intermediate 55-day SMA of 143.22 and the August low of 141.50 (August 7), takes priority. If this level is broken, the pair might go for the weekly low of 138.05 (July 28), the July low of 137.23 (July 13), and, eventually, the 200-day SMA of 136.85. A lower retracement might put the weekly low of 133.01 (April 26) under threat, as well as the minor level of 132.01 (April 13) and the April low of 130.62 (April 5). The daily RSI advanced beyond 60.
Resistance levels: 146.49 147.37 147.56 (4H chart)
Support levels: 144.43 143.82 141.50 (4H chart)
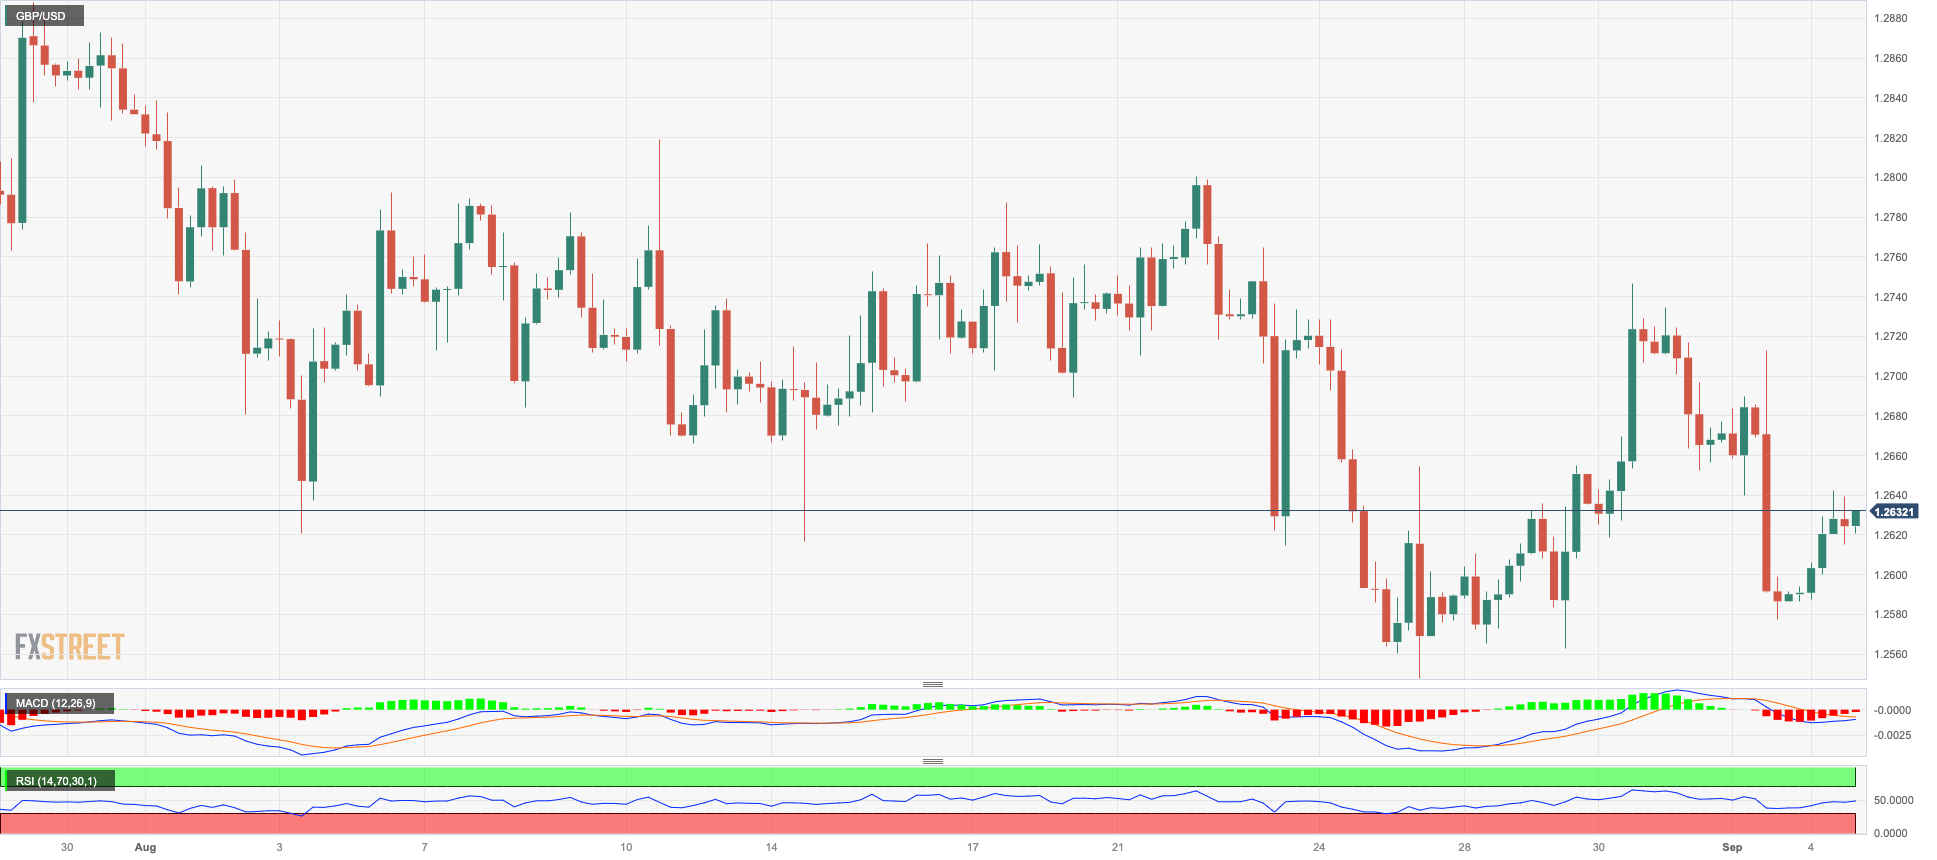
GBPUSD
GBP/USD reversed part of the bearishness seen in the second half of last week and regained the area above the 1.2600 hurdle at the beginning of the week.
In fact, the British pound gathered extra pace in response to the renewed selling pressure in the greenback and the broad-based upbeat mood in the risk-linked galaxy.
There were no data releases scheduled across the Channel on Monday, leaving all the attention to the always-relevant final print of the Services PMI on Tuesday.
Should GBP/USD accelerate its losses, the next notable support is at the August low of 1.2547 (August 25) prior to the 2021-2023 trendline near 1.2430, an area also reinforced by the 200-day SMA. Breaching this zone could open the door to the June low of 1.2368 (June 5) before reaching the May low of 1.2308 (May 25). On the other hand, Cable could recapture the interim 55-day SMA at 1.2770 before the weekly high at 1.2818 (August 10) and another weekly top at 1.2995 (July 27), which appears closely followed by the crucial barrier at 1.3000. Once the pair clears the 2023 top at 1.3142 (July 14), the weekly highs of 1.3146 (April 14, 2022) and 1.3298 (March 15, 2022) are likely to reappear. The RSI on the daily chart ticked higher to the boundaries of 43.
Resistance levels: 1.2712 1.2746 1.2800 (4H chart)
Support levels: 1.2577 1.2547 1.2486 (4H chart)
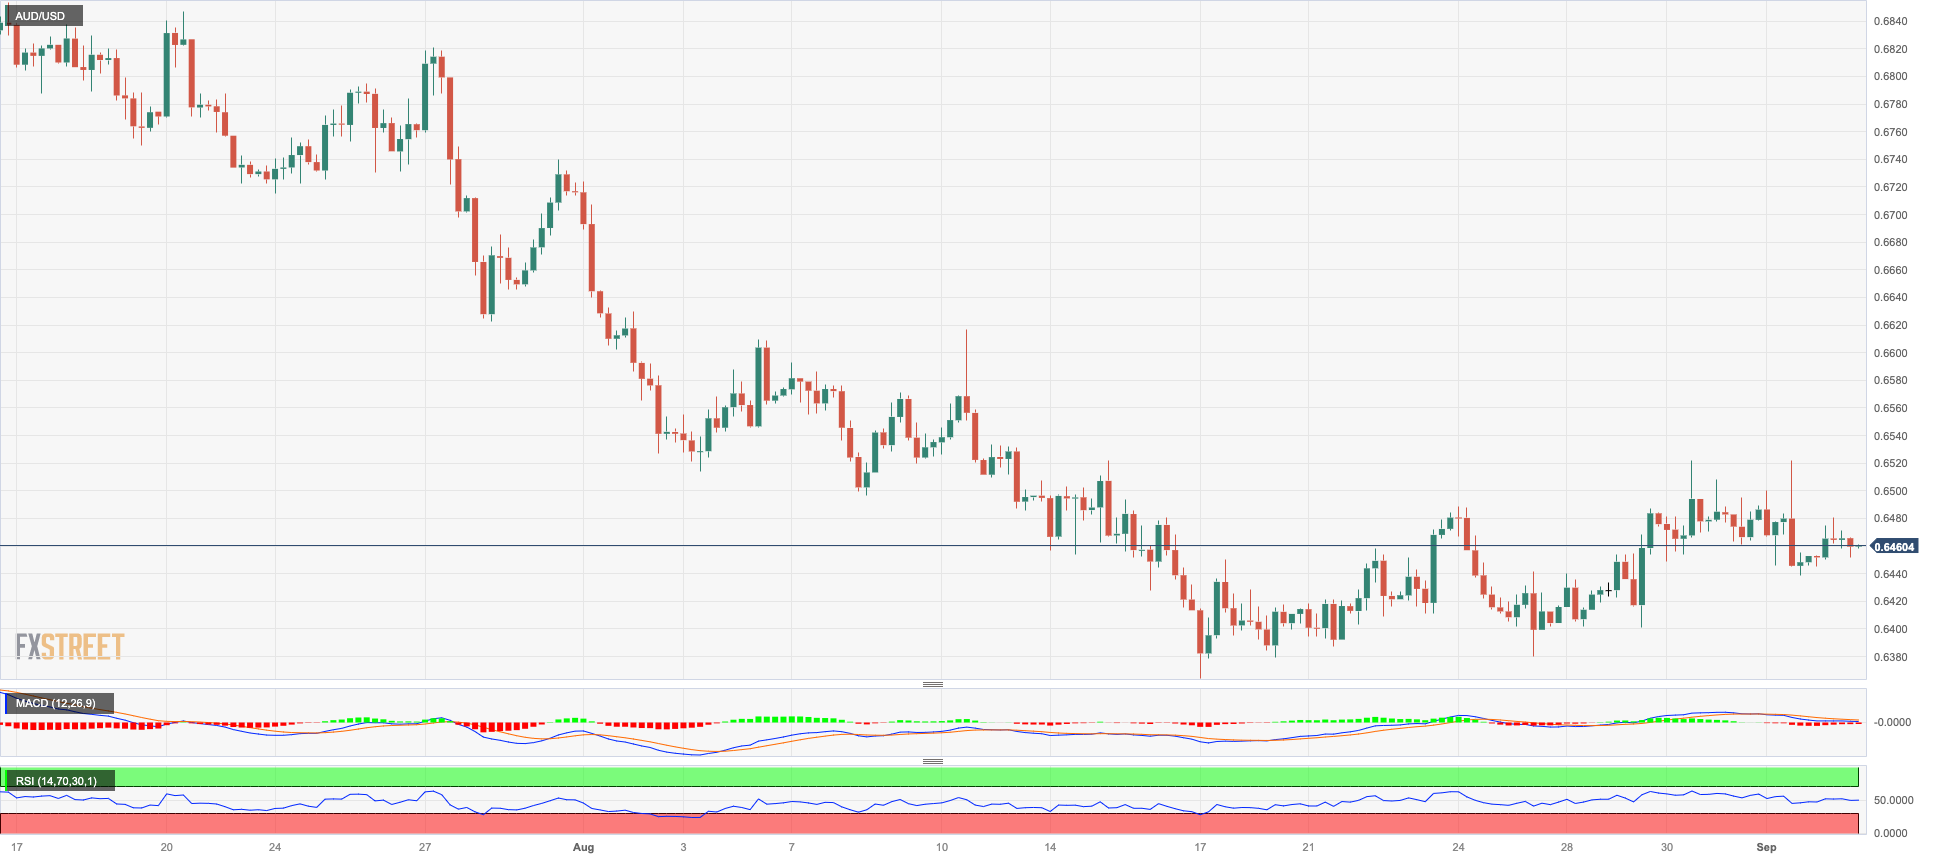
AUDUSD
AUD/USD printed a decent advance and partially left behind Friday’s marked decline at the beginning of the week.
Indeed, the Aussie dollar grabbed some fresh oxygen from the selling pressure hitting the greenback, although it remains under the microscope in response to the so far sluggish economic recovery in China.
Next of note in the Australian calendar will be the RBA interest rate decision on Tuesday, where the central bank is widely expected to leave the OCR unchanged at 4.10%.
On a lower retracement, AUD /USD could now retest the 2023 low of 0.6364 (August 17) prior to the November 2022 low of 0.6272 (November 7) and the 2022 low of 0.6179 (October 13). On the flip side, the pair is experiencing immediate resistance at the weekly high of 0.6522 (August 30), followed by another weekly top of 0.6616 (August 10). Above this level, the pair could challenge the 200-day SMA at 0.6719 ahead of the July peak of 0.6894 (July 14) and the June high of 0.6899 (June 16). The key 0.7000 level is the next point prior to the weekly top of 0.7029 (February 14) and the 2023 peak of 0.7157 (February 2). The day-to-day RSI advanced modestly past 43.
Resistance levels: 0.6522 0.6551 0.6616 (4H chart)
Support levels: 06438 0.6401 0.6379 (4H chart)
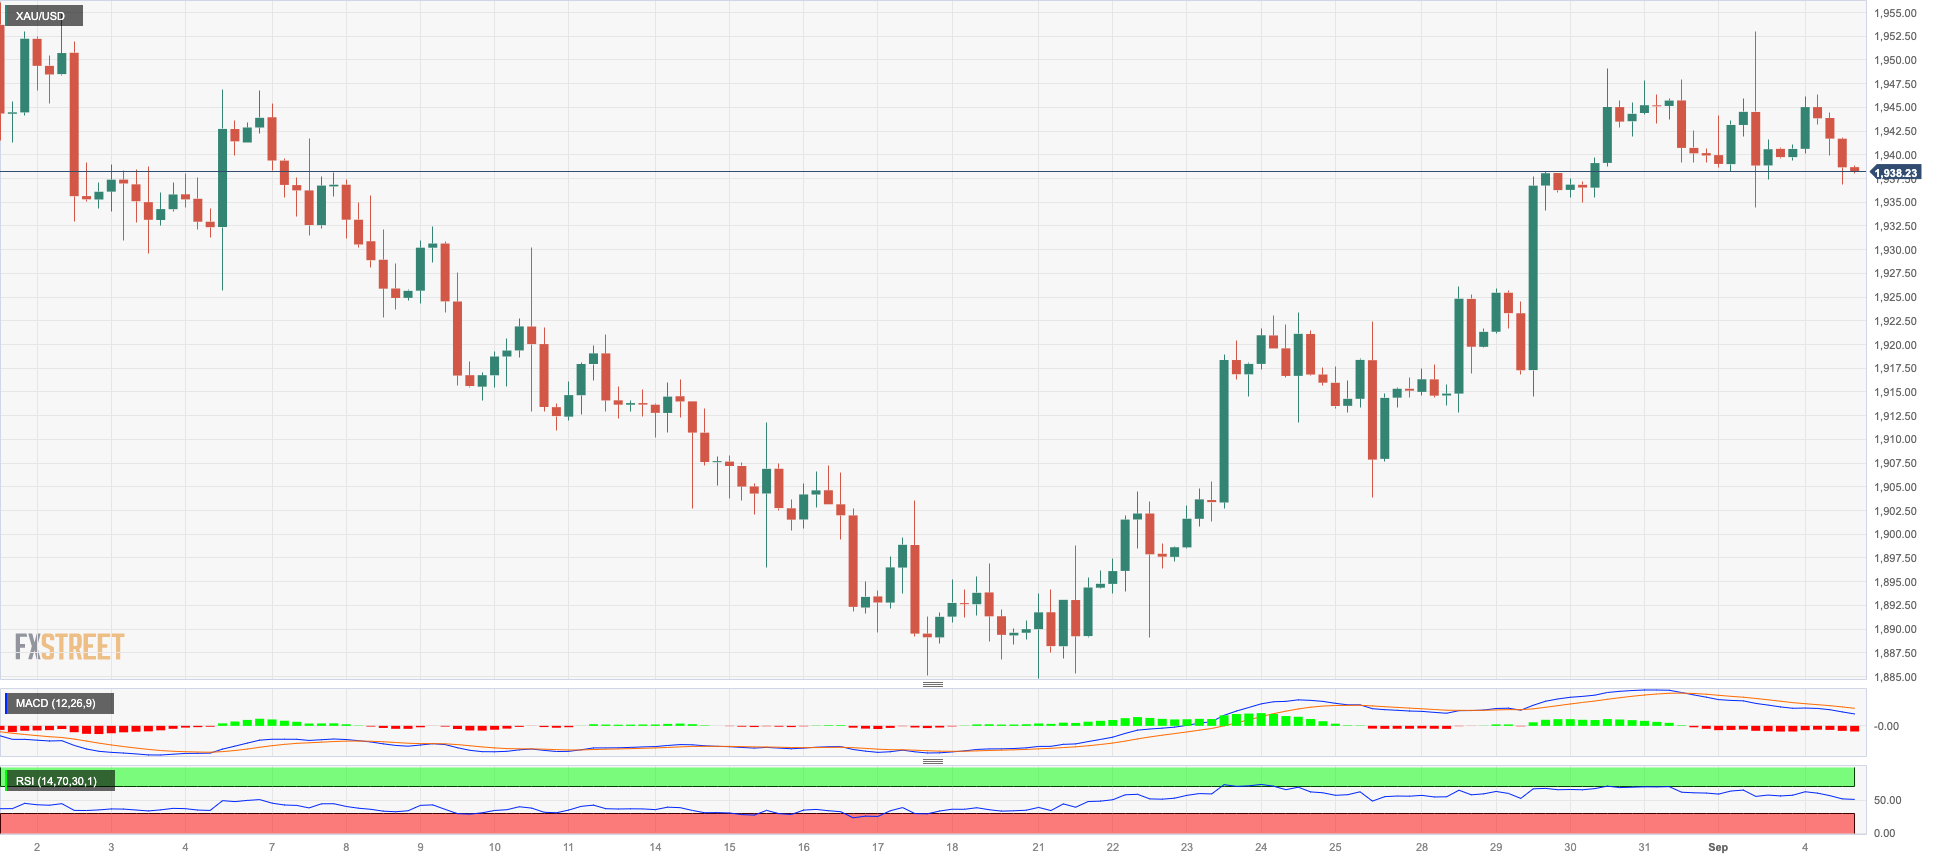
GOLD
The inactivity in the US markets as well as the lack of significant data releases on both sides of the Atlantic left gold’s price action depressed at the beginning of the week.
In fact, bullion navigated a tight range and ended the session around Friday’s closing levels in the $1940 region per troy ounce, practically mirroring Friday’s vacillating price action.
Moving forward, the precious metal is predicted to continue watching news about the Federal Reserve's probable future measures regarding interest rates, with investors continuing to favor interest rate decreases to begin around March 2024.
The gold price might be tested again around the weekly high of $1953 (September 1), which appears reinforced by the transitory 100-day SMA. Furthermore, the July high of $1987 indicates a considerable barrier to surmount before reaching the psychologically critical $ 2000 level. The breach of the latter level might open the way for a challenge to the 2023 top of $2067 (May 4), which will be followed by the 2022 peak of $2070 (March 8), and the all-time high of $2075 (August 7, 2020). On the contrary, the major 200-day SMA at $1915 is projected to withstand the initial negative test ahead of the August low of $1884 and the 2023 bottom of $1804 (February 28), both of which are ahead of the critical support zone of $1800.
Resistance levels: $1953 $1972 $1982 (4H chart)
Support levels: $1932 $1903 $1884 (4H chart)
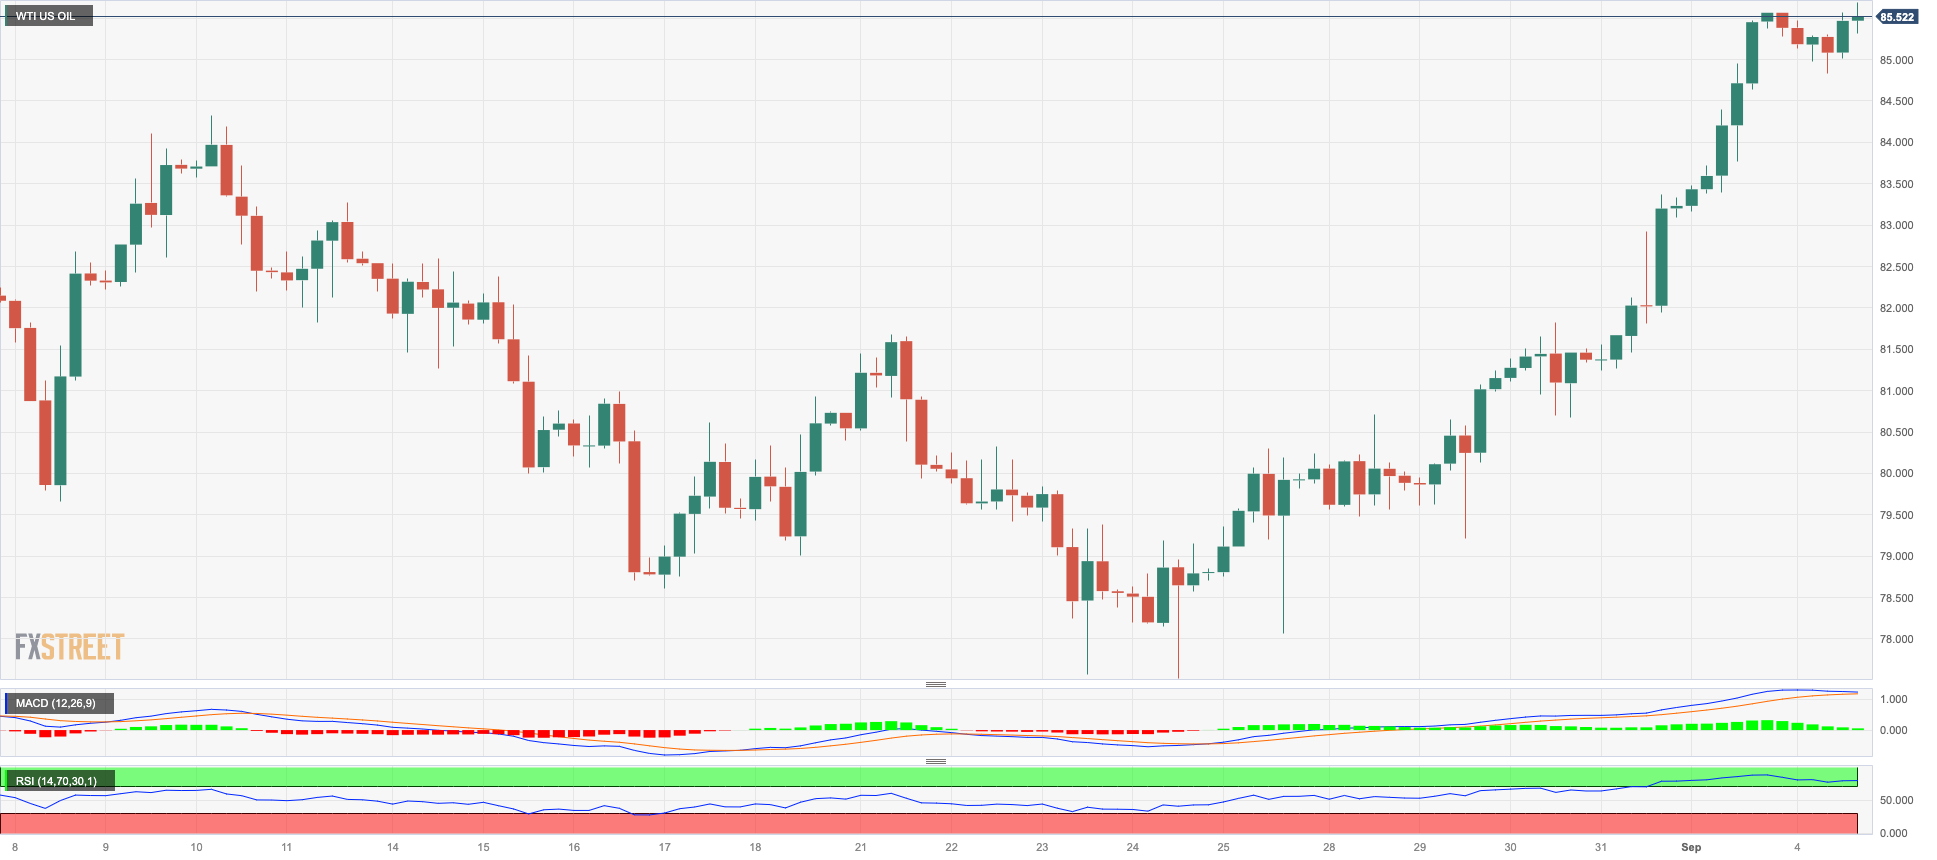
CRUDE WTI
WTI prices navigated a narrow trading range on Monday and seem to have met an important resistance zone around the $86.00 mark per barrel so far.
Crude oil prices alternated gains and losses as traders continued to assess further oil output cuts from Saudi Arabia as well as a reduction of Russian exports of crude oil.
In addition, the likelihood that the Fed might have ended its tightening campaign in July and the eventual economic recovery in China.
As usual in the docket, the API and the EIA will release their weekly reports on US crude oil inventories on Wednesday and Thursday, respectively.
If the rally continues, the round level of $90.00 seems to be the next upward barrier for WTI, followed by the November 2022 high of $93.73 (November 7) and the weekly top of $97.65 (August 30, 2022), both of which precede the crucial $100.00 per barrel mark. The initial reversal support is around the August low of $77.64 (August 24), which is above the 200-day SMA of $76.04. The loss of this region could put a potential test of weekly lows of $73.89 (July 17), $66.86 (June 12), and $63.61 (May 4) back on the radar ahead of the 2023 low of $63.61. A further dip might push prices closer to the December 2021 low of $62.46 (December 2) prior to the critical $60.00 level.
Resistance levels: $86.03 $88.65 $93.73 (4H chart)
Support levels: $80.85 $78.11 $77.56 (4H chart)
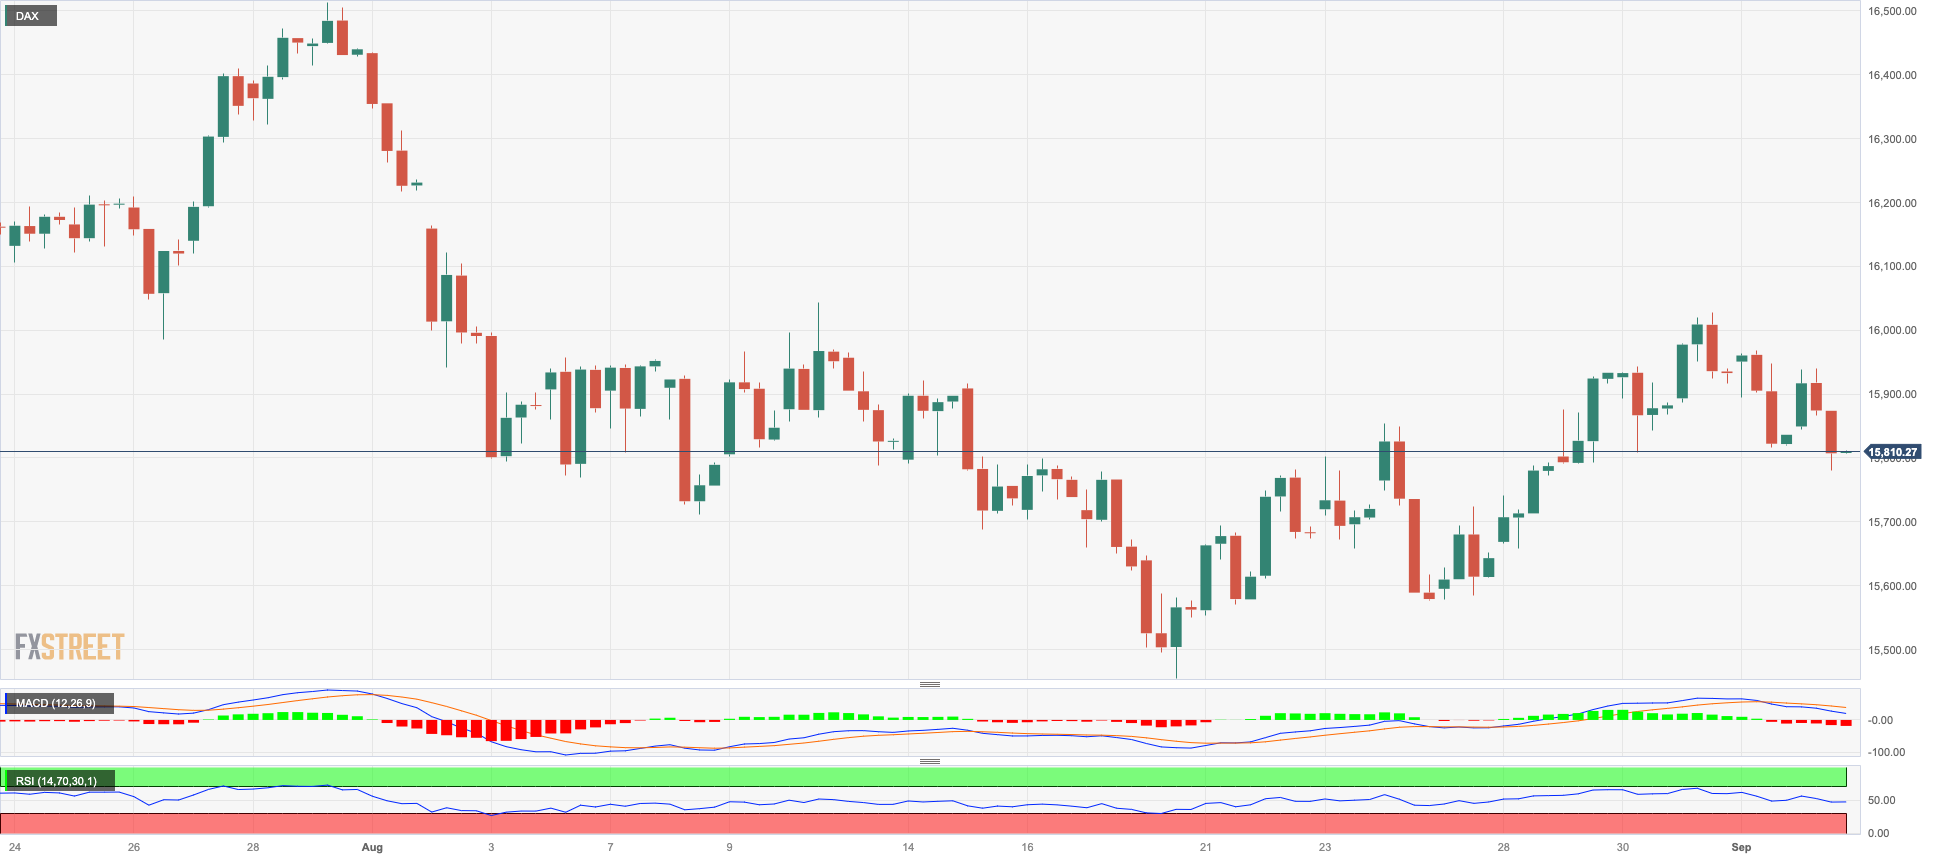
GER40
The DAX40 failed to maintain the earlier gains seen on Monday and concluded the trading session with a slight dip into negative territory, still remaining below the significant 16000 level.
The release of disappointing figures from the Sentix index only reinforced the growing concern that a potential recession could be looming in the region.
Furthermore, the absence of any significant updates from ECB President Lagarde during her speech added to the existing uncertainty surrounding the upcoming interest rate decision by the ECB.
Interestingly, despite the marginal decline in the index, the 10-year bund yields recorded another positive session, with rates approaching 2.60%.
Further DAX40 advances should aim for the weekly high of 16042 (August 31), which is supported by the nearness of the temporary 55-day SMA (15942) and is just ahead of another weekly high of 16060 (August 10). A breakout over this level might refocus investors' attention on a potential challenge to the all-time high of 16528 (July 31). By contrast, the August low of 15468 (August 18) suggests an urgent target ahead of the July low of 15456 (July 7), which coincides with the crucial 200-day SMA. A dip below the latter may challenge the March bottom of 14458 (March 20), previous to the December 2022 low of 13791 (December 20) and the 2022 low of 11862 (September 28). On the daily graph, the RSI slipped back below the 49 level.
Best Performers: Commerzbank, Merck, Mercedes Benz Group
Worst Performers: RWE AG ST, Deutsche Post, Qiagen
Resistance levels: 16042 16060 16528 (4H chart)
Support levels: 15795 15568 15468 (4H chart)
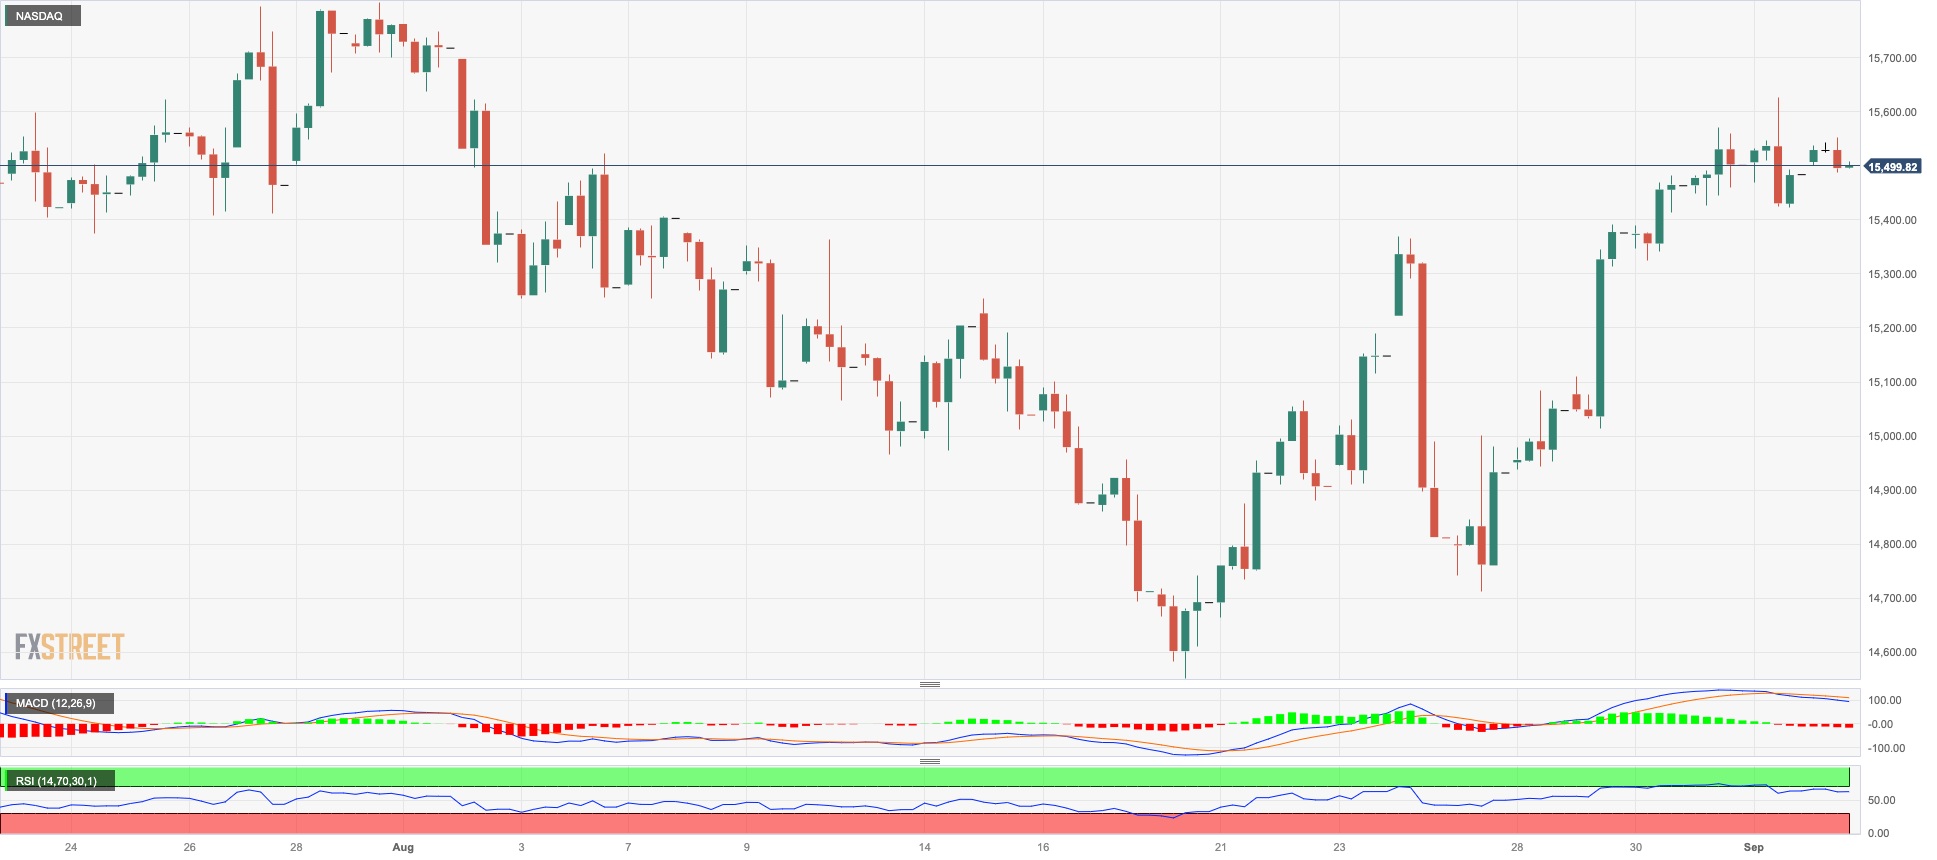
NASDAQ
The tech benchmark Nasdaq 100 gave up its gains after reaching fresh four-week highs above the 15600 level and concluded Friday's session with a little dip. This reversal happened after a five-day run of upward momentum.
The sudden correction in the index was triggered by a significant recovery in the value of the US dollar towards the end of the week, as well as the reversal of US bond yields across various maturity periods.
These market dynamics occurred amidst growing confidence that the Federal Reserve may maintain interest rates unchanged for the remainder of the year, and there is an increasing likelihood of rate reductions in the first half of 2024.
Should the bulls prevail, the Nasdaq 100 should first target the weekly high at 15618 (September 1) before heading for another weekly top at 15803 (July 31). North from here aligns the 2023 peak at 15932 (July 19) seconded by the round mark of 16000. Immediate support, on the other hand, lies at the August low of 14557 (August 18), ahead of the temporary 100-day SMA at 14511 and the weekly low of 14283 (June 7). If the latter is lost, the weekly low of 13520 (May 24), the 200-day SMA of 13239 and the April low of 12724 (April 25) are in danger. The daily RSI remained stable around 59.
Top Gainers: Lululemon Athletica, PDD Holdings DRC, Intel
Top Losers: Warner Bros Discovery, Walgreen Boots, Broadcom
Resistance levels: 15618 15795 15932 (4H chart)
Support levels: 15227 14715 14557 (4H chart)
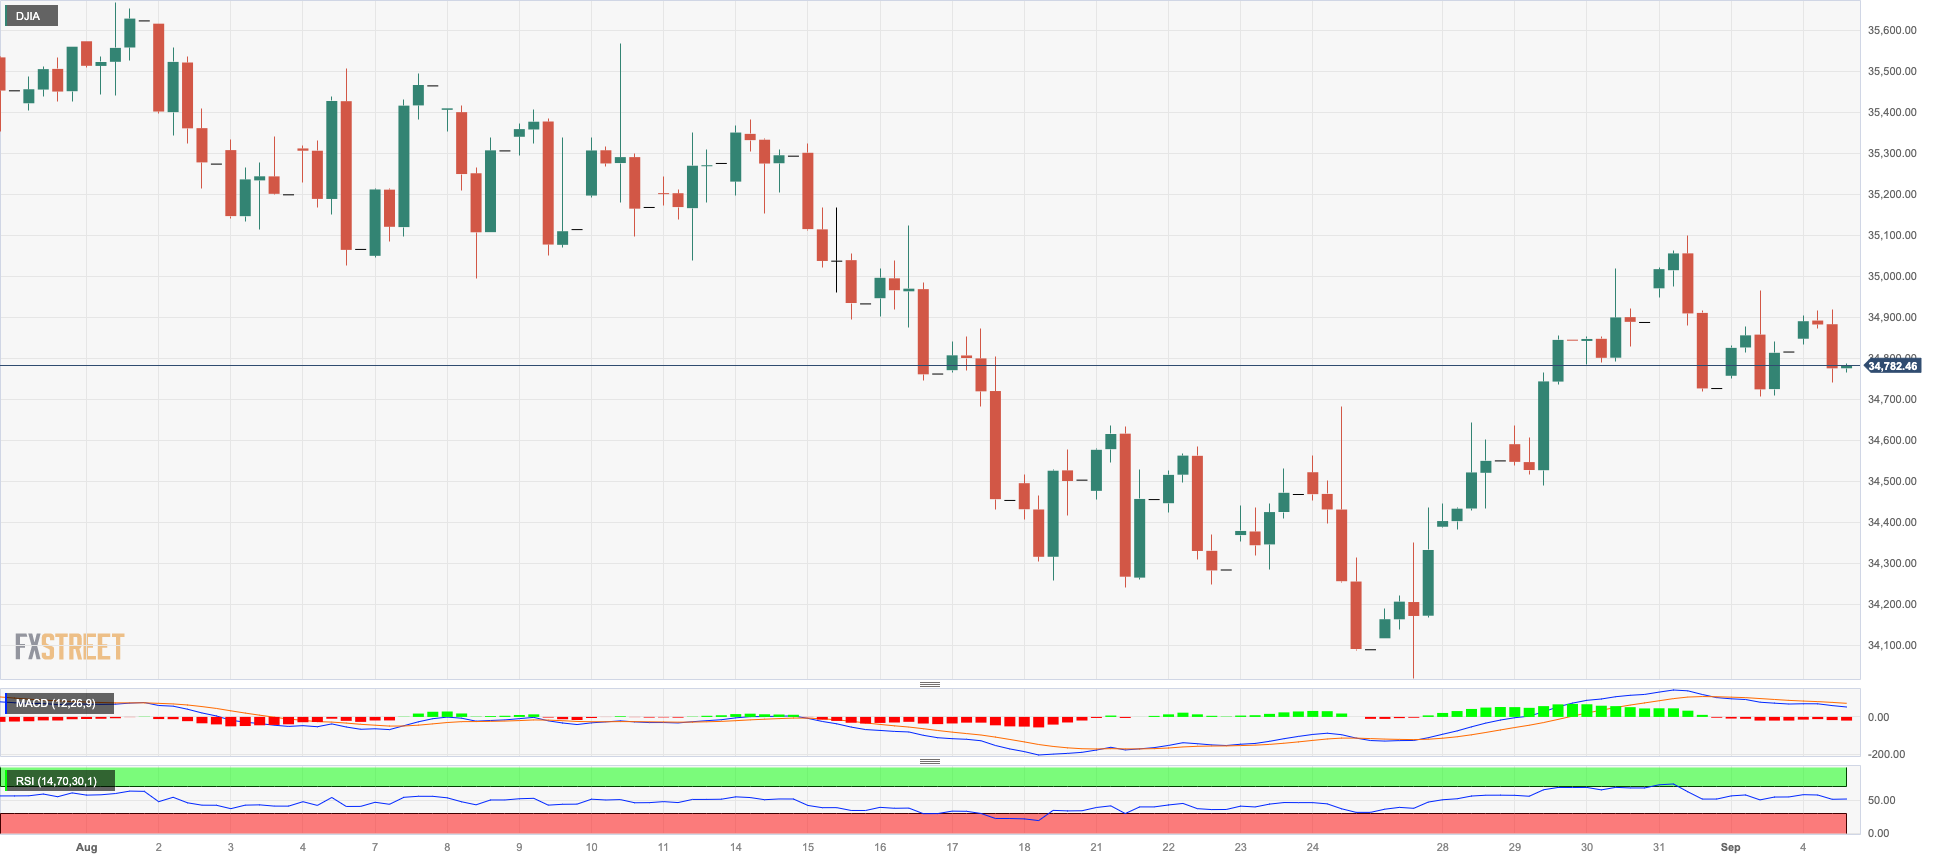
DOW JONES
The Dow Jones index successfully rebounded from its previous day's decline and surged once again toward the 35000 region at the end of last week.
Furthermore, when examining the weekly chart, it becomes apparent that the index concluded the week with its first period of gains following two consecutive retracements.
Market participants regained their optimism last Friday, particularly due to a slowdown in the US labor market, as evidenced by the latest Nonfarm Payrolls figures. This development has bolstered the belief that the Federal Reserve may opt to maintain its current interest rates at the September meeting, reigniting speculation about potential rate cuts as early as March 2024.
On Friday, the Dow Jones rose 0.33% to 34837, the S&P500 gained 0.18% to 4515, and the tech-focused Nasdaq Composite dropped 0.02% to 14031.
The next uptrend for the Dow Jones appears to be the weekly high of 35070 (August 31). A break above this level will reveal the 2023 top at 35679 (August 1), followed by the February 2022 high at 35824 (February 9) and the all-time peak at 36952 (January 5, 2022). Having said that, a break below the August low of 34029 (August 25) could put the index on track to revisit the critical 200-day SMA at 33771 before testing the July low of 33705 (July 10). This is followed by the May low of 32586 (May 25) and the 2023 low of 31429 (March 15). The RSI for the day rose to near 52.
Top Performers: Intel, Chevron, Caterpillar
Worst Performers: Walgreen Boots, Walt Disney, Coca-Cola
Resistance levels: 35070 35578 35679 (4H chart)
Support levels: 34719 34029 33705 (4H chart)
MACROECONOMIC EVENTS

All Information & Updates provided by:

All information relating to the financial markets available on this page has been prepared and issued by FXStreet (Forexstreet SL, Spain, Reg: B62498233) on the basis of publicly available information and all information believed to be reliable and does not conflict with Kuwaiti local laws, and all necessary care has been taken to before the company to ensure that the facts mentioned are correct from the source.
NCM Investment nor any of its directors or employees shall in any way be held responsible for the contents of this news, and the information contained on this page is intended only to provide clients with publicly available information and should not be construed as investment advice, report or analysis and/or constitute an offer or invitation to buy or sell financial instruments of any kind.
RISK WARNING: Forex and CFDs are highly risky leveraged products, as losses can exceed deposits. Please ensure you understand all the risks and take independent advice if necessary. NCM will segregate the clients based on the criteria of the regulator and its bylaws. NCM does not provide any advisory service; the material published does not constitute advice or a recommendation for a transaction in any financial instrument. NCM accepts no responsibility for any use of the content presented and any consequences of that use. Anyone acting on the information provided does so at their own risk.