
- Contact Us:
-

-

-

-


Daily Market Updates
06 Sep 2023
USDJPY
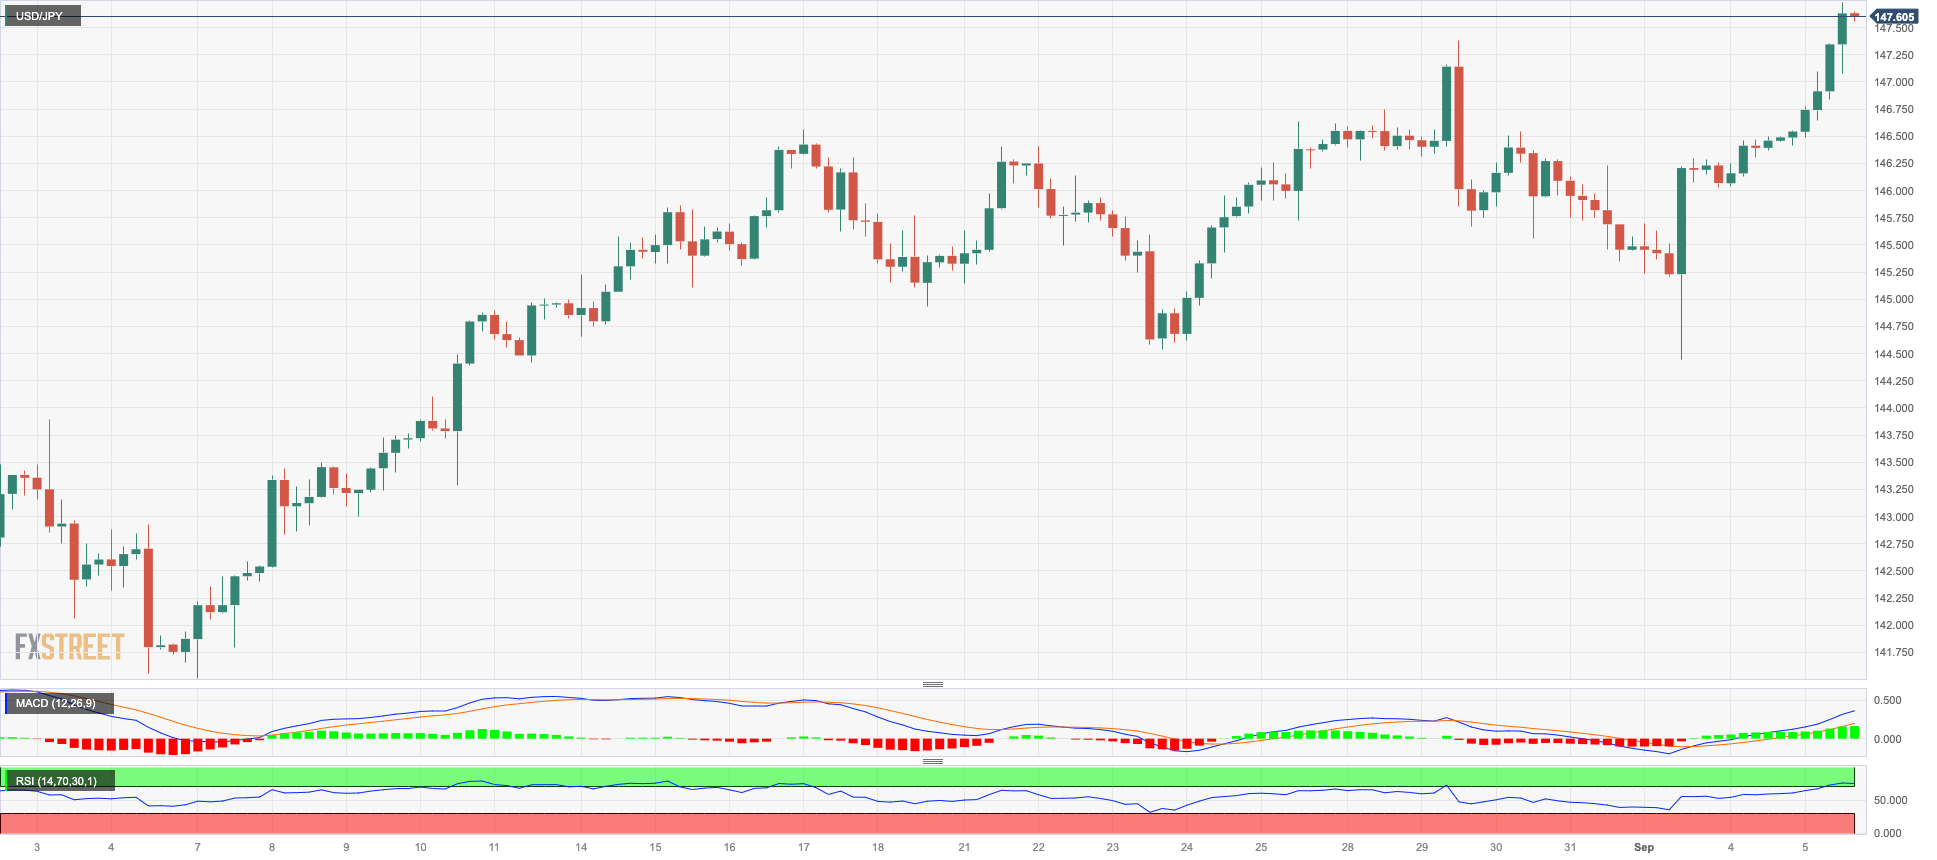
USD/JPY added to the ongoing uptrend and advanced to levels last seen in early November 2022, around 147.70 on turnaround Tuesday.
The third consecutive advance in the pair came in response to the intense move higher in the greenback, which in turn appeared underpinned by the positive session in US yields across different timeframes as US traders returned to their desks from the extended weekend.
In the Japanese docket, Household Spending contracted at an annualized 5.0% in July, while the final Jibun Bank Services PMI improved to 54.3 in August.
If USD/JPY breaks over the September high of 147.50 (September 5), it will most certainly confront the 2022 high of 151.95 (October 21). The weekly low of 144.43 (September 1) takes precedence over the temporary 55-day SMA of 143.33 and the August low of 141.50 (August 7). If this level is breached, the pair may target the weekly low of 138.05 (July 28), the July low of 137.23 (July 13), and, finally, the 200-day SMA of 136.89. A lower retracement might threaten the weekly low of 133.01 (April 26), as well as the minor level of 132.01 (April 13) and the April low of 130.62 (April 5). The daily RSI rose past the 65 level.
Resistance levels: 147.73 148.45 148.84 (4H chart)
Support levels: 146.08 144.43 144.4 (4H chart)
GBPUSD
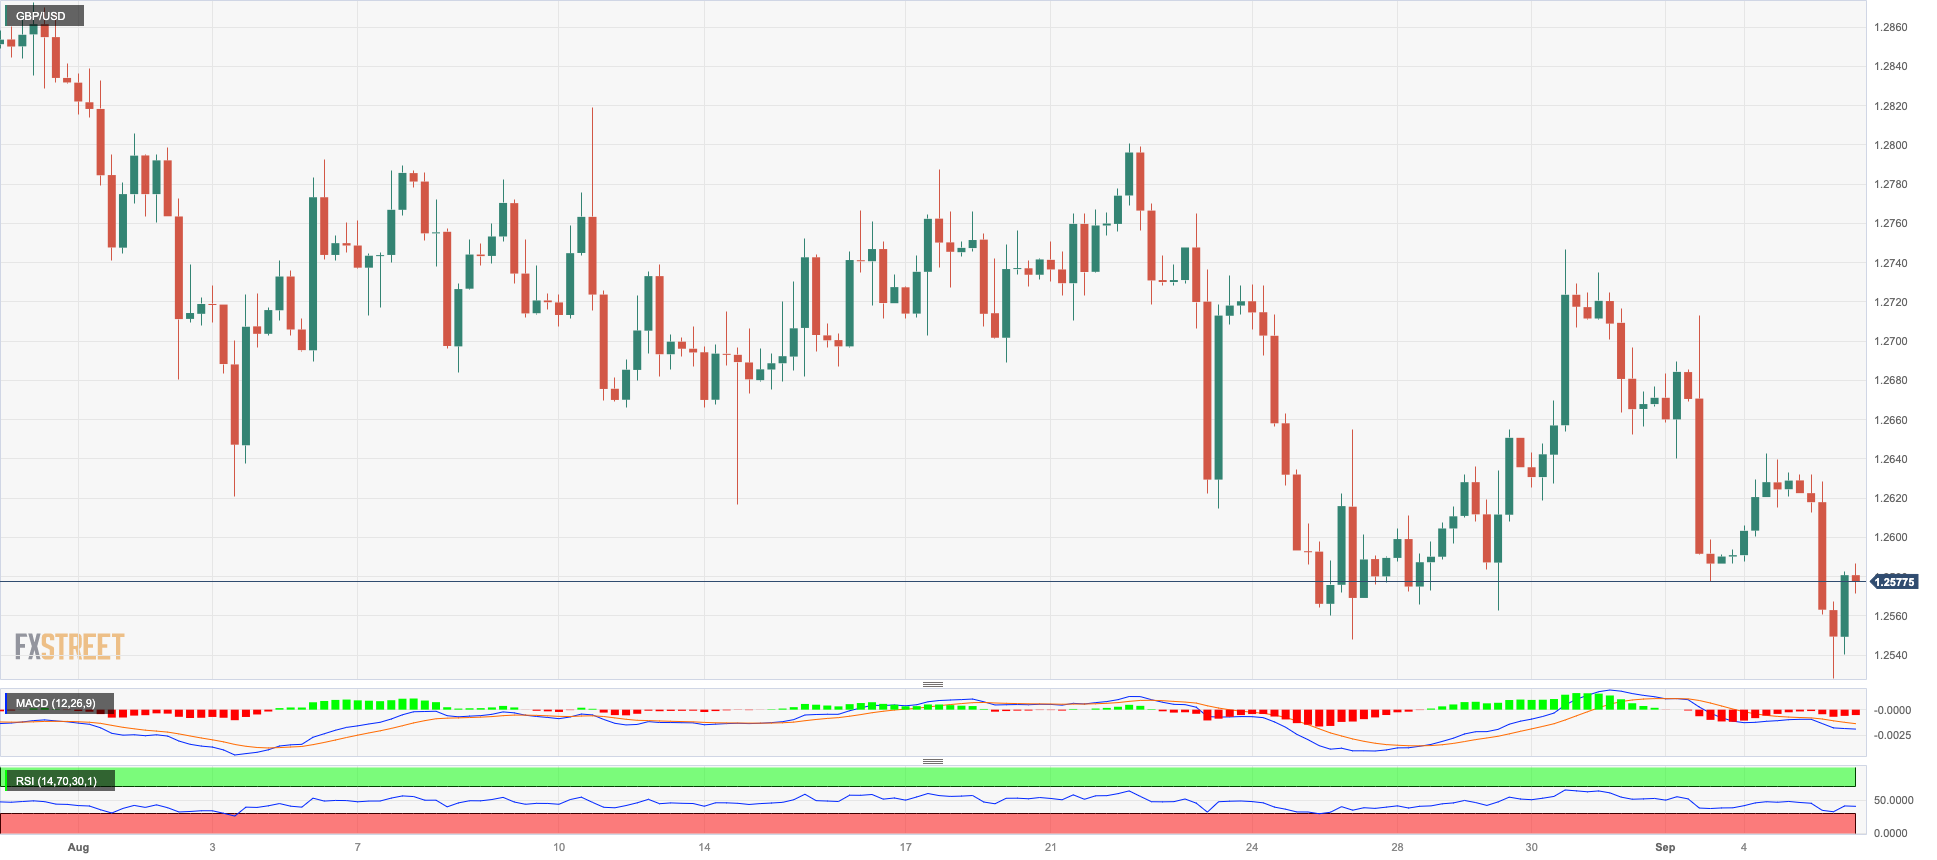
Extra selling pressure hurt sterling and the rest of its risk-linked peers on Tuesday, sending GBP/USD to new three-month lows in the 1.2530/25 band.
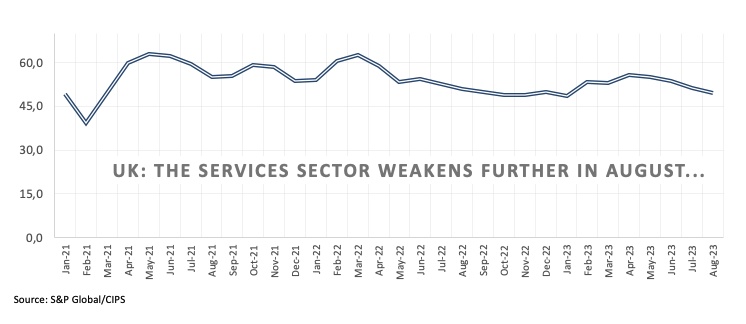
In addition, the British pound derived extra weakness after the key Services PMI slipped back into contraction territory in August, fanning the flames that the domestic economy could drift into a recession in the next few months.
In the UK, the BRC Retail Sales Monitor rose 4.3% YoY in August, and New Car Sales increased 24.4 YoY in the same month. In addition, the final S&P Global/CIPS Services PMI dropped to 49.5 last month (from 51.5).
If GBP/USD accelerates its losses, the next support is at the September low of 1.2527 (September 5) ahead of the 2021-2023 trendline around 1.2420, an area also coincident with the key 200-day SMA. A breach of this region could open the door to the June low of 1.2368 (June 5) before the May low of 1.2308 (May 25). On the flip side, Cable could reclaim the 55-day SMA at 1.2766 before the weekly high at 1.2818 (August 10) and another weekly top at 1.2995 (July 27), closely followed by the crucial barrier at 1.3000. Once the pair clears the 2023 top at 1.3142 (14 July), the weekly peaks of 1.3146 (April 14, 2022) and 1.3298 (March 15, 2022) should be regained. The RSI on the daily chart deflated below 40.
Resistance levels: 1.2642 1.2712 1.2746 (4H chart)
Support levels: 1.2527 1.2486 1.2368 (4H chart)
AUDUSD
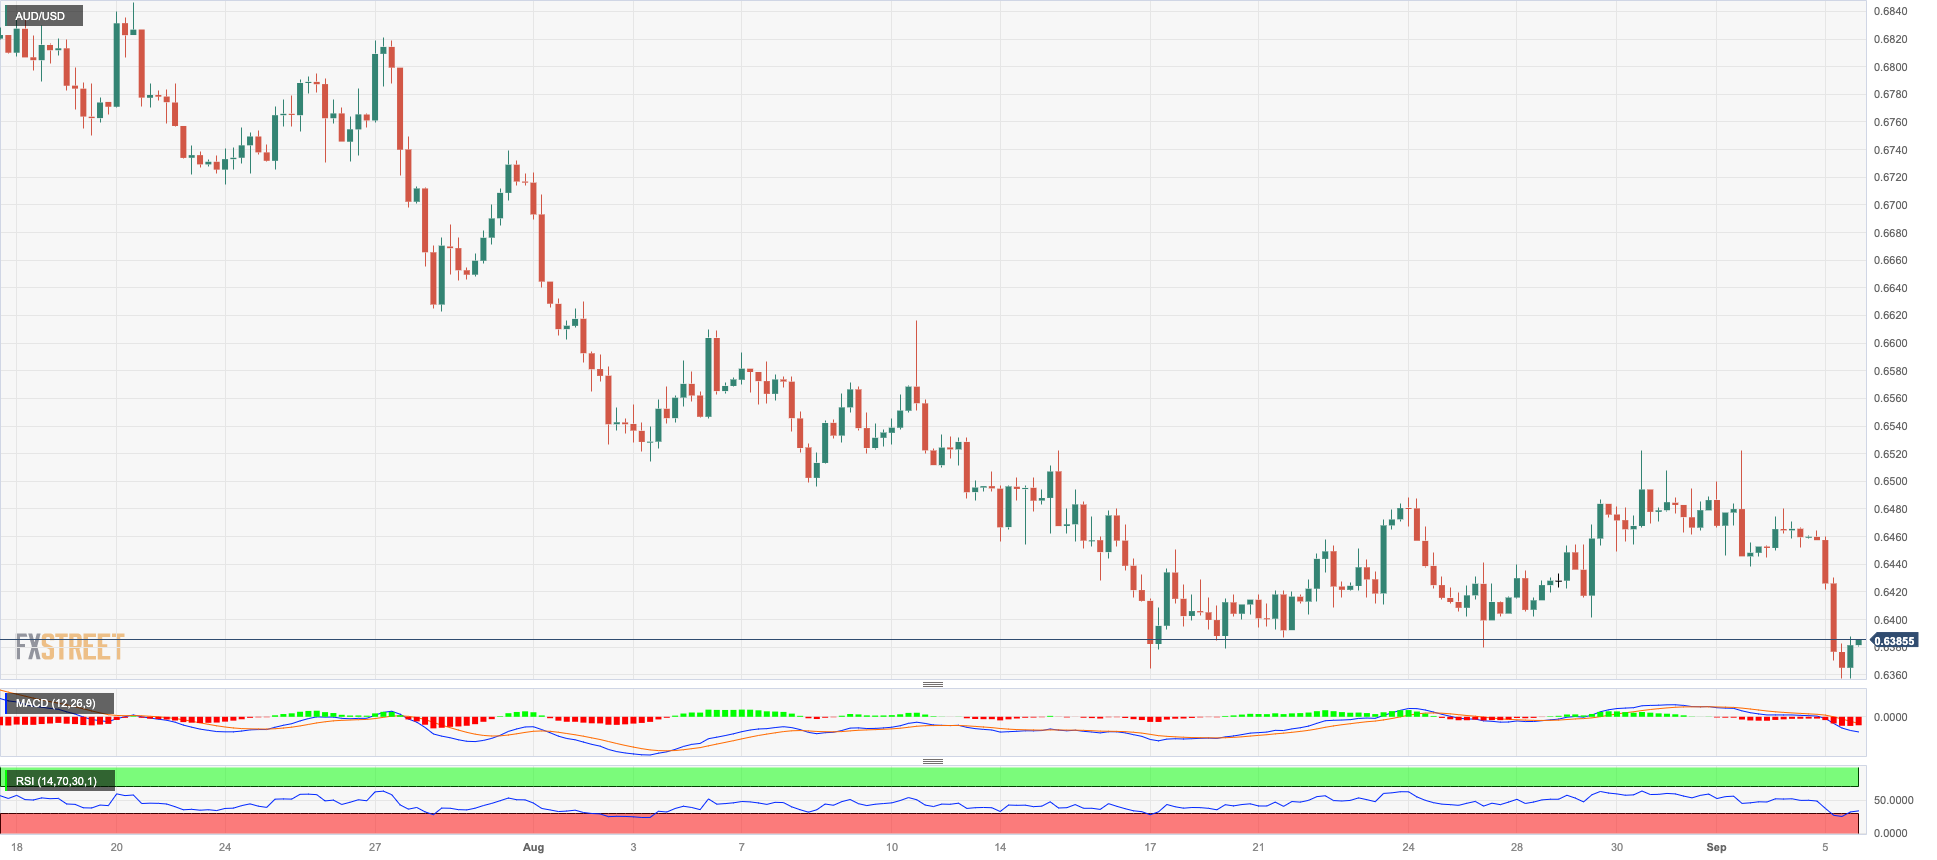
Monday’s optimism around the pair was indeed short-lived.
In fact, the resurgence of the strong demand for the greenback and the prevailing risk-off environment kept the price action around the Aussie dollar depressed and dragged AUD/USD to new yearly lows in the 0.6360/55 band on Tuesday.
Adding to the selling bias around AUD, the RBA left its OCR unchanged at 4.10% at its meeting earlier in the session. From the bank’s statement, a soft landing of the Aussie economy appears likely, while the RBA is still seen on an extended pause to assess the effects of its tightening campaign.
In Australia, the final Judo Bank Services PMI eased marginally to 47.8 in August (from 47.9) and the Current Account surplus narrowed to A$7.7B in the April-June period.
On a lower retracement, AUD /USD could now retest the 2023 low of 0.6357 (September 5) prior to the November 2022 low of 0.6272 (November 7) and the 2022 low of 0.6179 (October 13). On the contrary, the pair is experiencing immediate resistance at the weekly high of 0.6522 (August 30), followed by another weekly top of 0.6616 (August 10). Above this level, the pair could attack the 200-day SMA at 0.6717 ahead of the July peak of 0.6894 (July 14) and the June high of 0.6899 (June 16). The key 0.7000 level is the next point before the weekly top of 0.7029 (February 14) and the 2023 peak of 0.7157 (February 2). The everyday RSI deflated to the vicinity of 36.
Resistance levels: 0.6448 0.6480 0.6521 (4H chart)
Support levels: 0.6357 0.6272 0.6210 (4H chart)
GOLD
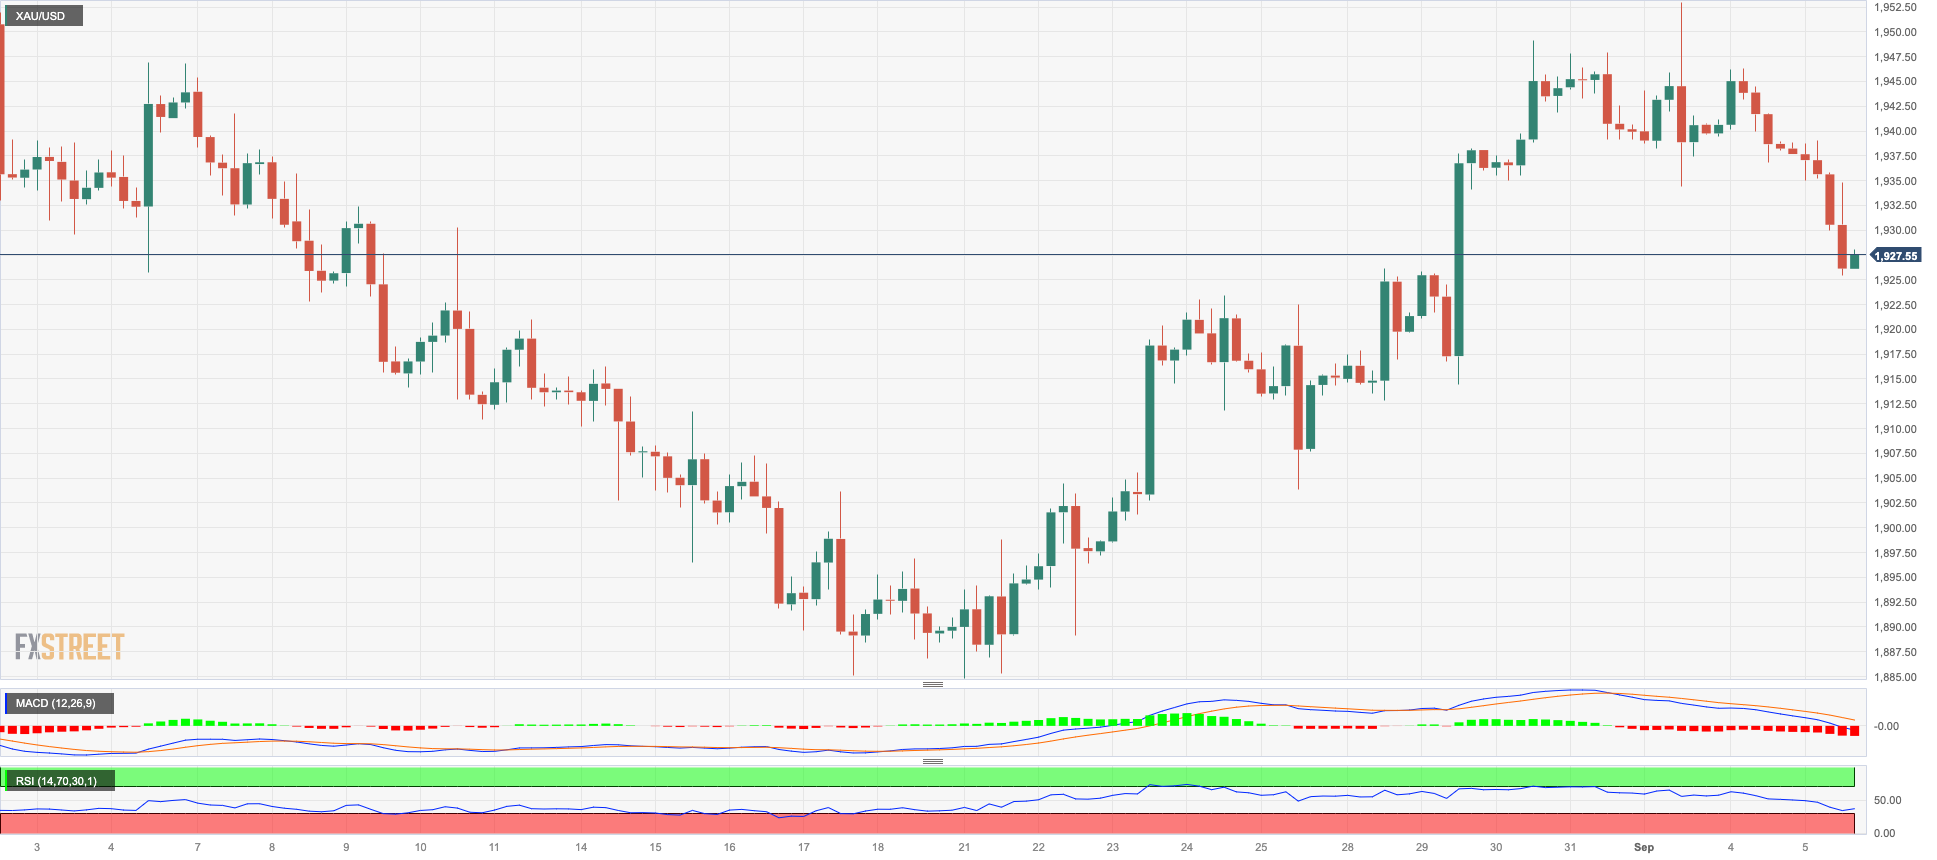
Prices of the troy ounce of the yellow metal corrected lower and tested the area of multi-day lows near $1925 on Tuesday.
In fact, bullion added to the tepid decline seen in the previous session against the backdrop of a pronounced move higher in the greenback and a decent rebound in US yields across the curve as US traders returned to their desks following Monday’s Labor Day holiday.
Looking ahead, the precious metal is anticipated to remain attentive to news regarding the Federal Reserve's potential future actions concerning interest rates. Investors persist in showing a preference for interest rate reductions, which are anticipated to commence in approximately March 2024.
Immediately to the upside for gold comes the weekly high of $1953 (September 1), which looks to be supported by the transitory 100-day SMA ($1952). The surpass of this level could put prompt a potential visit to the July top of $1987 to start shaping up ahead of the psychologically important $ 2000 threshold. The breakout of the latter level may pave the way for a challenge to the 2023 peak of $2067 (May 4), seconded by the 2022 high of $2070 (March 8), and the all-time top of $2075 (August 7, 2020). Having said that, the key 200-day SMA at $1916 is expected to resist the initial negative test ahead of the August low of $1884 and the 2023 bottom of $1804 (February 28), both of which are ahead of the important support level of $1800.
Resistance levels: $1953 $1972 $1982 (4H chart)
Support levels: $1925 $1914 $1903 (4H chart)
CRUDE WTI
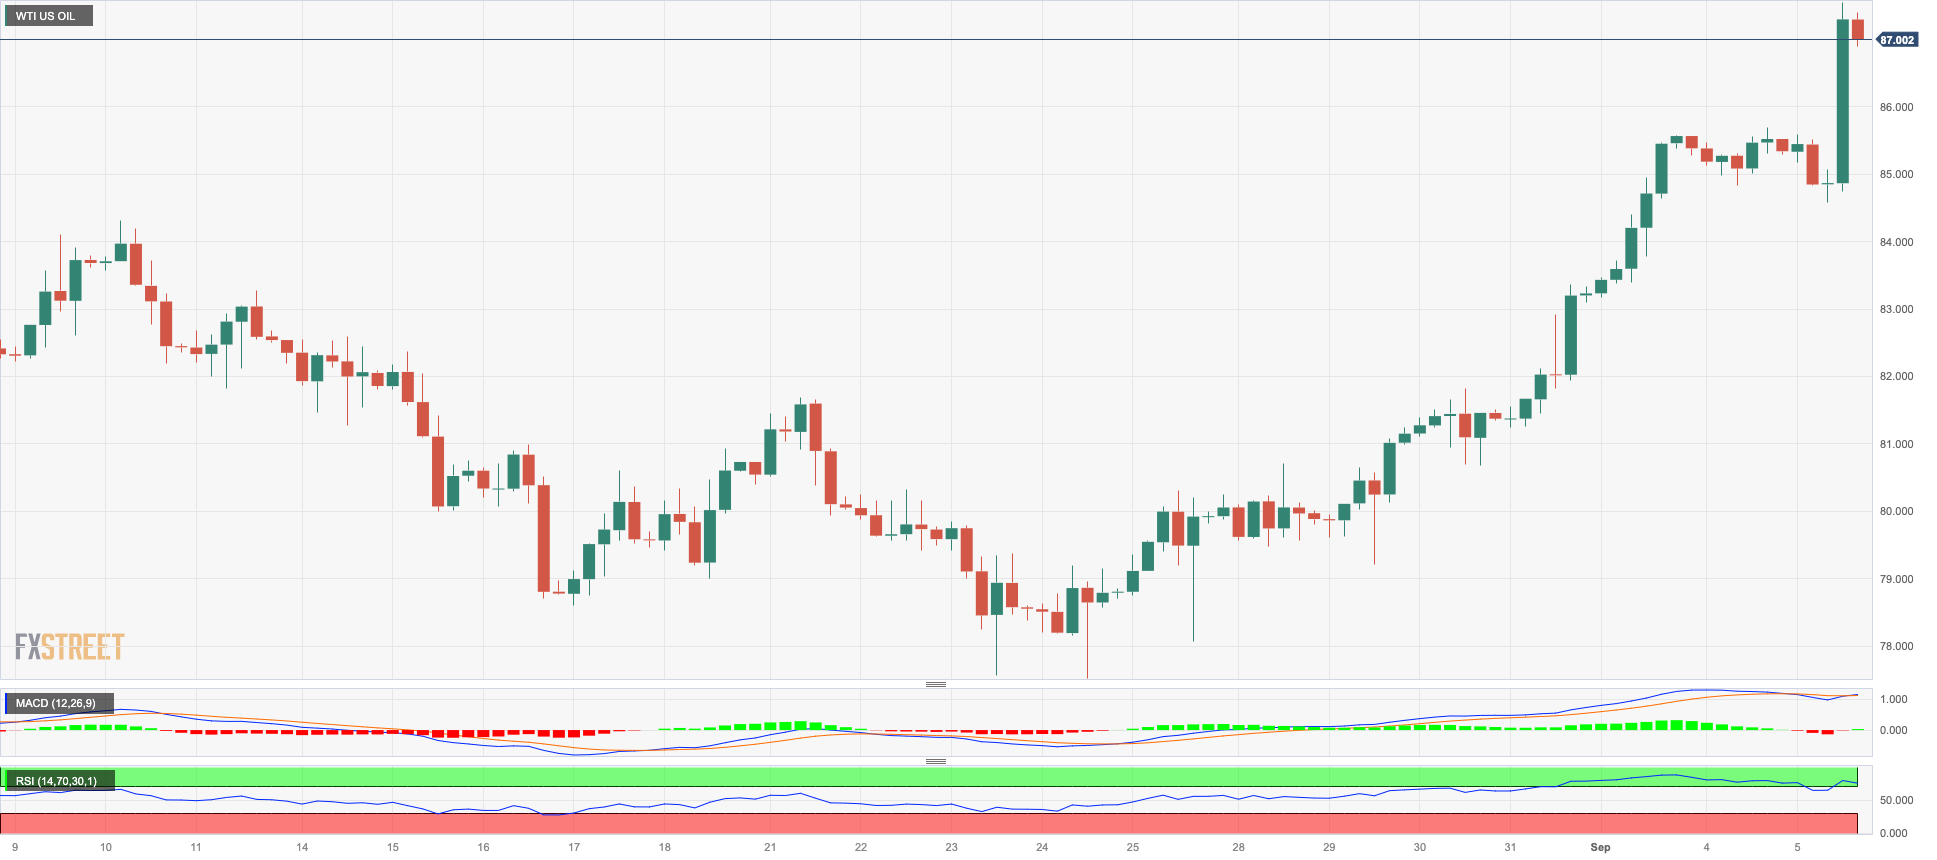
The sweet light crude oil, a benchmark for the United States, continued its upward trajectory, reaching the $88.00 per barrel on Tuesday for the first time since early November 2022.
The ongoing ascent in crude oil prices received renewed support from Saudi Arabia and Russia, as both nations announced their commitment to extending voluntary cuts in oil production and exports. These measures are set to remain in effect until the end of the year.
Looking ahead, the API and the EIA are scheduled to release their weekly reports on US crude oil inventories on Wednesday and Thursday, respectively, ahead of Friday’s weekly report on US oil rig count by driller Baker Hughes.
If the rally continues, the $90.00 round level appears to be the next upward hurdle for WTI, followed by the November 2022 high of $93.73 (November 7) and the weekly top of $97.65 (August 30, 2022), all of which precede the critical $100.00 mark per barrel. The initial support for a reversal is at the August low of $77.64 (August 24), which is above the 200-day SMA of $76.09. The loss of this area might reintroduce a test of the weekly lows of $73.89 (July 17), $66.86 (June 12), and $63.61 (May 4) ahead of the 2023 low of $63.61. A further decline might take prices closer to the December 2021 low of $62.46 (December 2), just below the key $60.00 barrier.
Resistance levels: $88.00 $88.65 $93.73 (4H chart)
Support levels: $84.99 $81.00 $77.56 (4H chart)
GER40
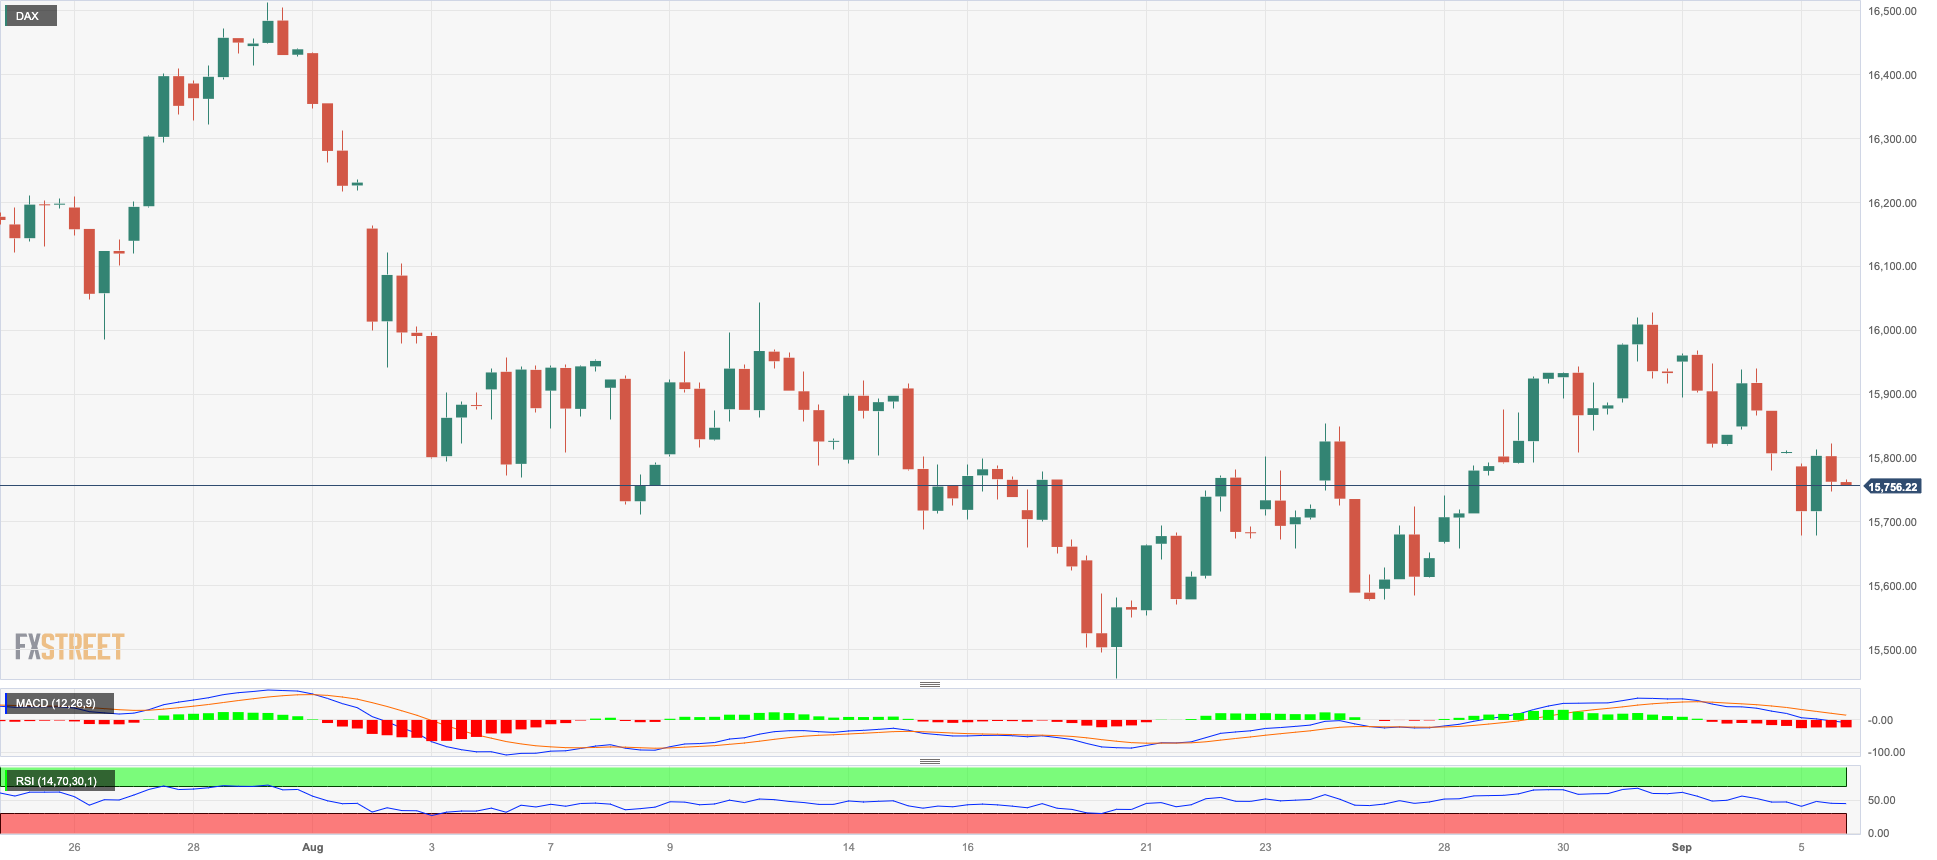
The prevailing pessimism among investors persisted during the first half of the week, leading Germany's stock benchmark, the DAX40, to register its third consecutive daily decline on Tuesday. This time, the index retreated to multi-day lows, hovering around the 15700 range.
The downtrend in investor sentiment can be attributed to discouraging data from China and equally disheartening readings from the services sector in Europe. These factors have dampened buyer enthusiasm, favouring the continuation of the downward trend.
Tuesday's figures compounded the already negative data releases in the region observed in previous sessions, further reinforcing the notion that a scenario of stagflation may be emerging in the region.
In the German money market, the yields on 10-year bunds climbed to multi-day highs, surpassing the 2.60% mark.
Further DAX40 gains should target the weekly high of 16042 (August 31) and is just ahead of another weekly top of 16060 (August 10). A break above this level might refocus investors' attention on a possible challenge to the all-time high of 16528 (July 31). Just the opposite, the August low of 15468 (August 18) indicates an impending objective ahead of the July low of 15456 (July 7), which appears propped up by the critical 200-day SMA (15463). A drop below the latter may test the March bottom of 14458 (March 20), ahead of the December 2022 low of 13791 (December 20) and the 2022 low of 11862 (September 28). The RSI grinded lower to the vicinity of 46.
Best Performers: BMW ST, Dr Ing hc F Porsche Prf, Continental AG
Worst Performers: Commerzbank, Siemens Energy AG, Zalando SE
Resistance levels: 15969 16042 16060 (4H chart)
Support levels: 15691 15578 15468 (4H chart)
NASDAQ
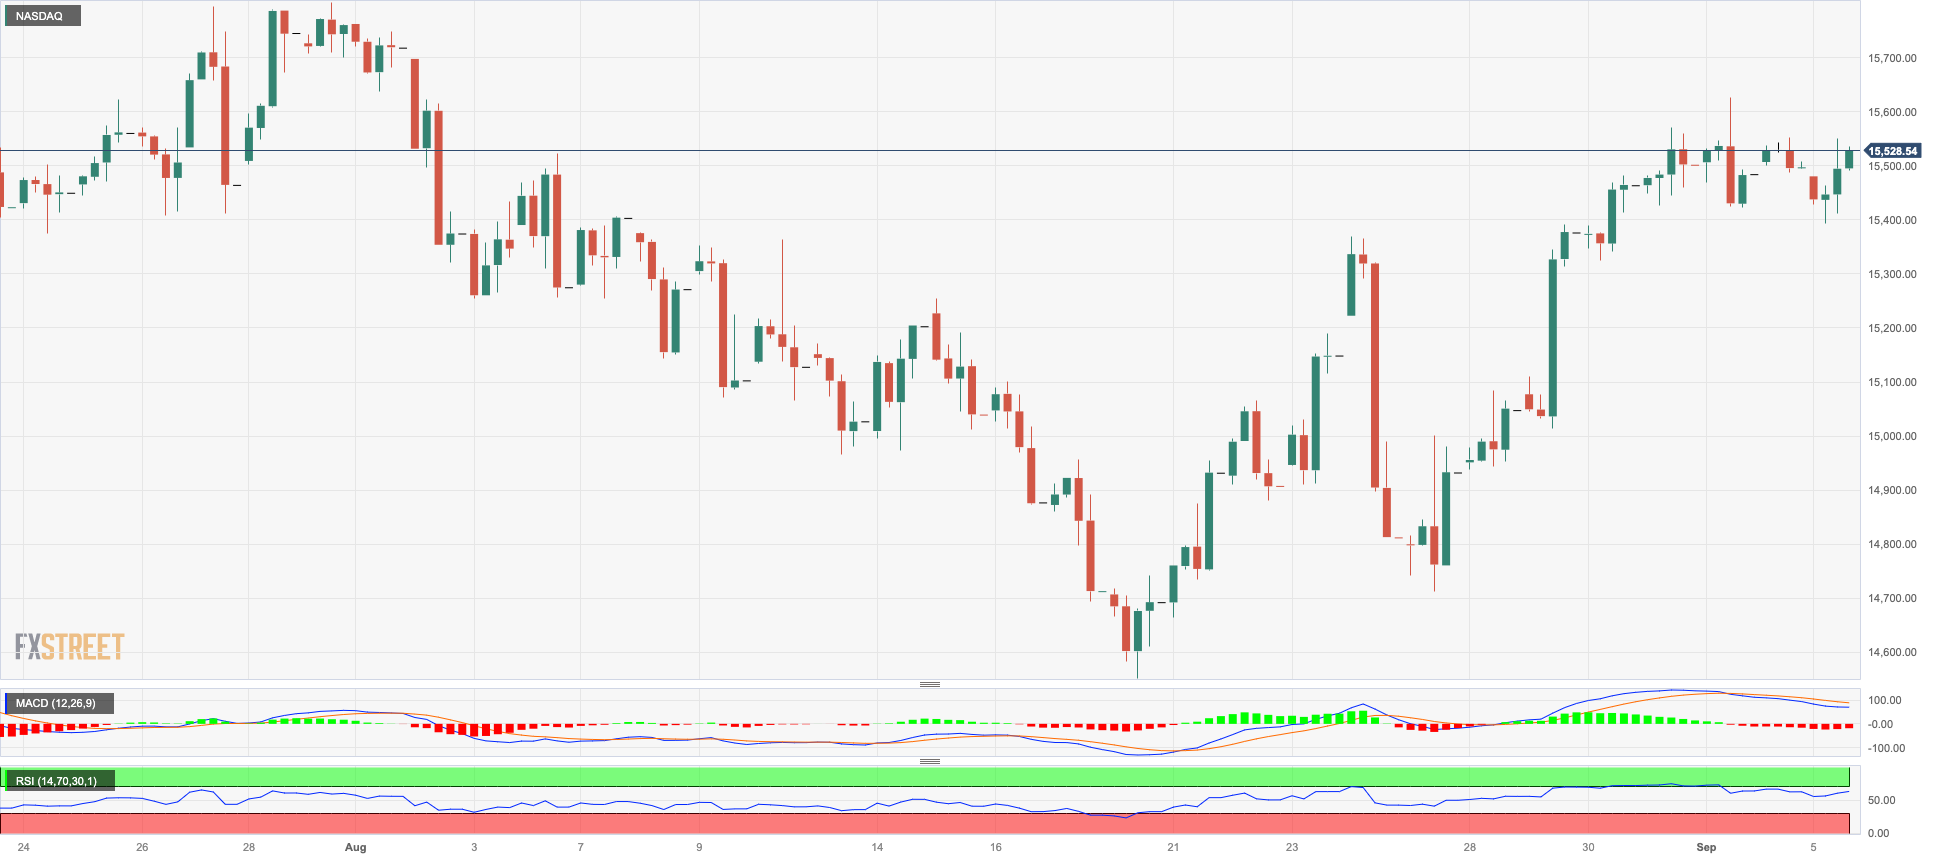
On Tuesday, a renewed sense of optimism permeated the US tech sector, prompting the key benchmark Nasdaq 100 to overcome the setback experienced on Friday and resume its multi-session recovery.
Interestingly, this positive shift in the index occurred in spite of the slight rebound in US yields and the strong resurgence of buying interest in the US dollar.
Taking a broader view, investors anticipate that the Fed will abstain from raising interest rates for the rest of the year. Speculation is already underway, suggesting that around March 2024, the central bank may begin implementing rate cuts.
If the bulls prevail, the Nasdaq 100 should first target the so far September high at 15618 (September 1) prior to another weekly top at 15803 (July 31). North of here is the 2023 peak at 15932 (July 19), followed by the round mark of 16000. Immediate support, on the other hand, is at the August low of 14557 (August 18), just before the interim 100-day SMA at 14537 and seconded by the weekly low of 14283 (June 7). If the latter is lost, the weekly low of 13520 (May 24), the 200-day SMA of 13257 and the April low of 12724 (April 25) are expected to come next. The daily RSI settled around 60.
Top Gainers: Airbnb, Tesla, Zoom Video
Top Losers: Illumina, Sirius XM, Old Dominion Freight Line
Resistance levels: 15618 15795 15932 (4H chart)
Support levels: 15227 14715 14557 (4H chart)
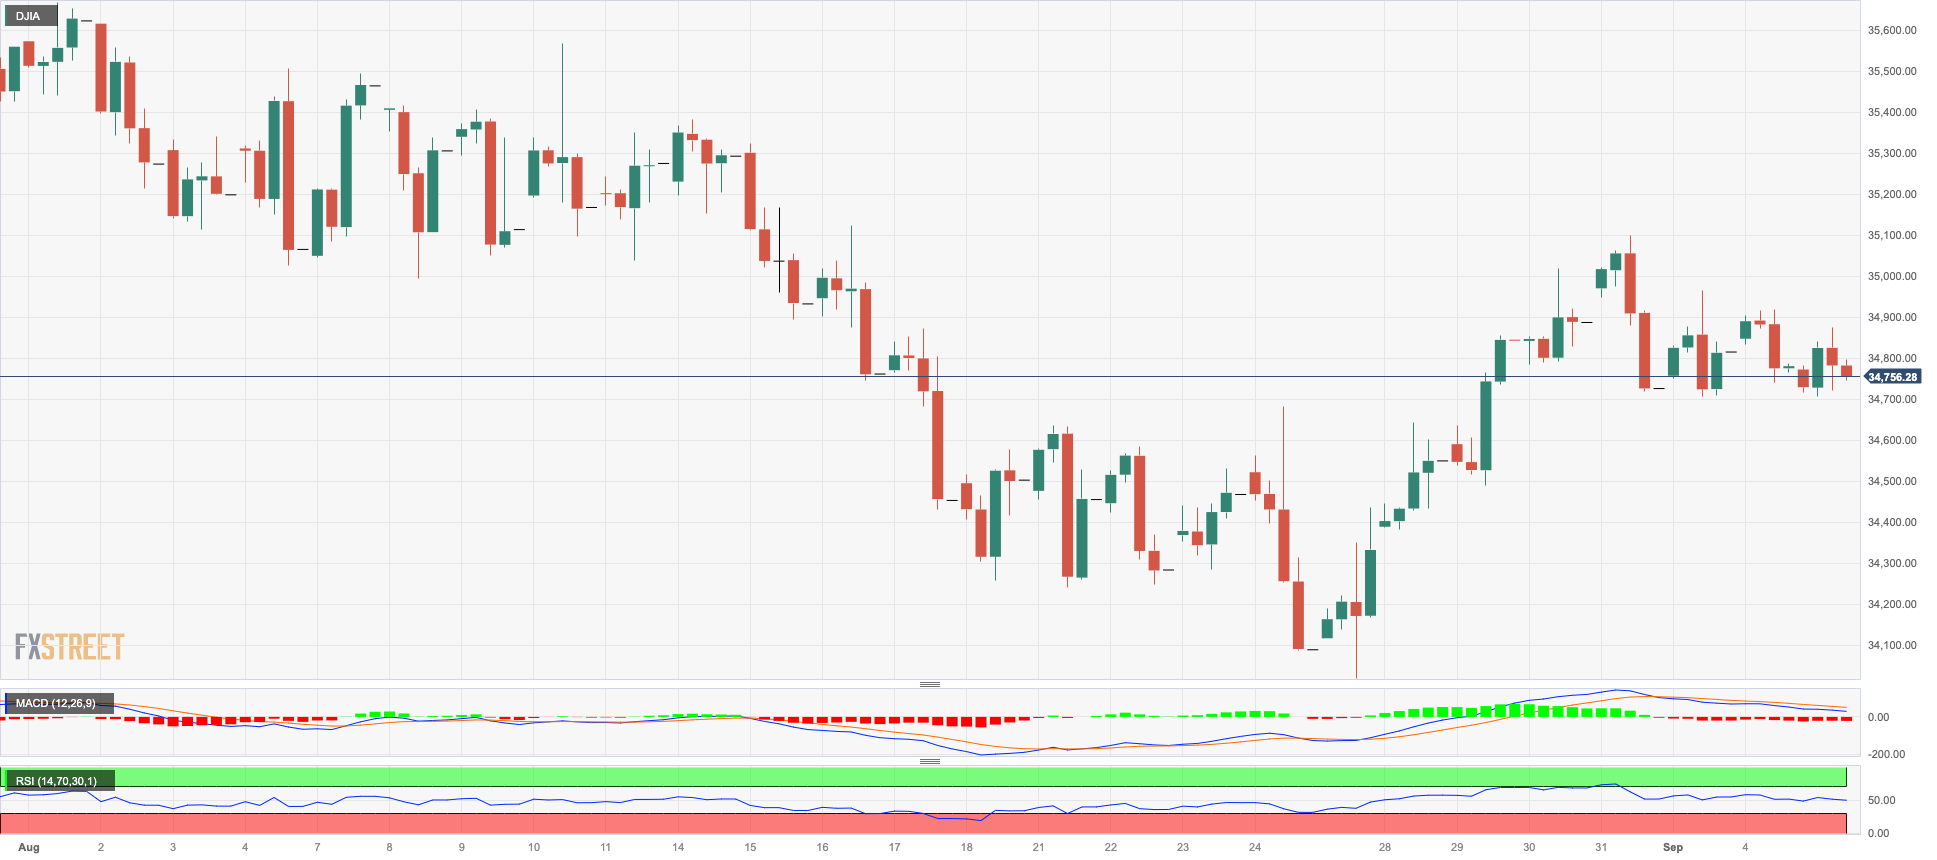
DOW JONES
Disappointing prints from the Chinese services sector reignited concerns over the health of the country’s economy, while the robust bounce in the greenback along with rising US yields across the curve also weighed on traders’ sentiment on Tuesday.
Against that gloomy backdrop, US equities gauged by the Dow Jones edged modestly lower, fading Friday’s humble advance at the same time.
All in all, the Dow Jones dropped 0.12% to 34795, the S&P500 retreated 0.14% to 4509, and the tech-heavy Nasdaq Composite rose 0.03% to 14035.
The next up-barrier for the Dow Jones appears to be the weekly high of 35070 (August 31). A break above this level will reveal the 2023 top at 35679 (August 1), followed by the February 2022 peak at 35824 (February 9) and the all-time high at 36952 (January 5, 2022). Instead, a breakdown of the August low of 34029 (August 25) could see the index fall back to the critical 200-day SMA at 33777 before testing the July low of 33705 (July 10). This is followed by the May low of 32586 (May 25) and the 2023 low of 31429 (March 15). The RSI eased below the 51 level.
Top Performers: Chevron, UnitedHealth, Microsoft
Worst Performers: Nike, Dow, Home Depot
Resistance levels: 35070 35578 35679 (4H chart)
Support levels: 34719 34029 33705 (4H chart)
MACROECONOMIC EVENTS

All Information & Updates provided by:

All information relating to the financial markets available on this page has been prepared and issued by FXStreet (Forexstreet SL, Spain, Reg: B62498233) on the basis of publicly available information and all information believed to be reliable and does not conflict with Kuwaiti local laws, and all necessary care has been taken to before the company to ensure that the facts mentioned are correct from the source.
NCM Investment nor any of its directors or employees shall in any way be held responsible for the contents of this news, and the information contained on this page is intended only to provide clients with publicly available information and should not be construed as investment advice, report or analysis and/or constitute an offer or invitation to buy or sell financial instruments of any kind.
RISK WARNING: Forex and CFDs are highly risky leveraged products, as losses can exceed deposits. Please ensure you understand all the risks and take independent advice if necessary. NCM will segregate the clients based on the criteria of the regulator and its bylaws. NCM does not provide any advisory service; the material published does not constitute advice or a recommendation for a transaction in any financial instrument. NCM accepts no responsibility for any use of the content presented and any consequences of that use. Anyone acting on the information provided does so at their own risk.