
- Contact Us:
-

-

-

-


Daily Market Updates
07 Sep 2023
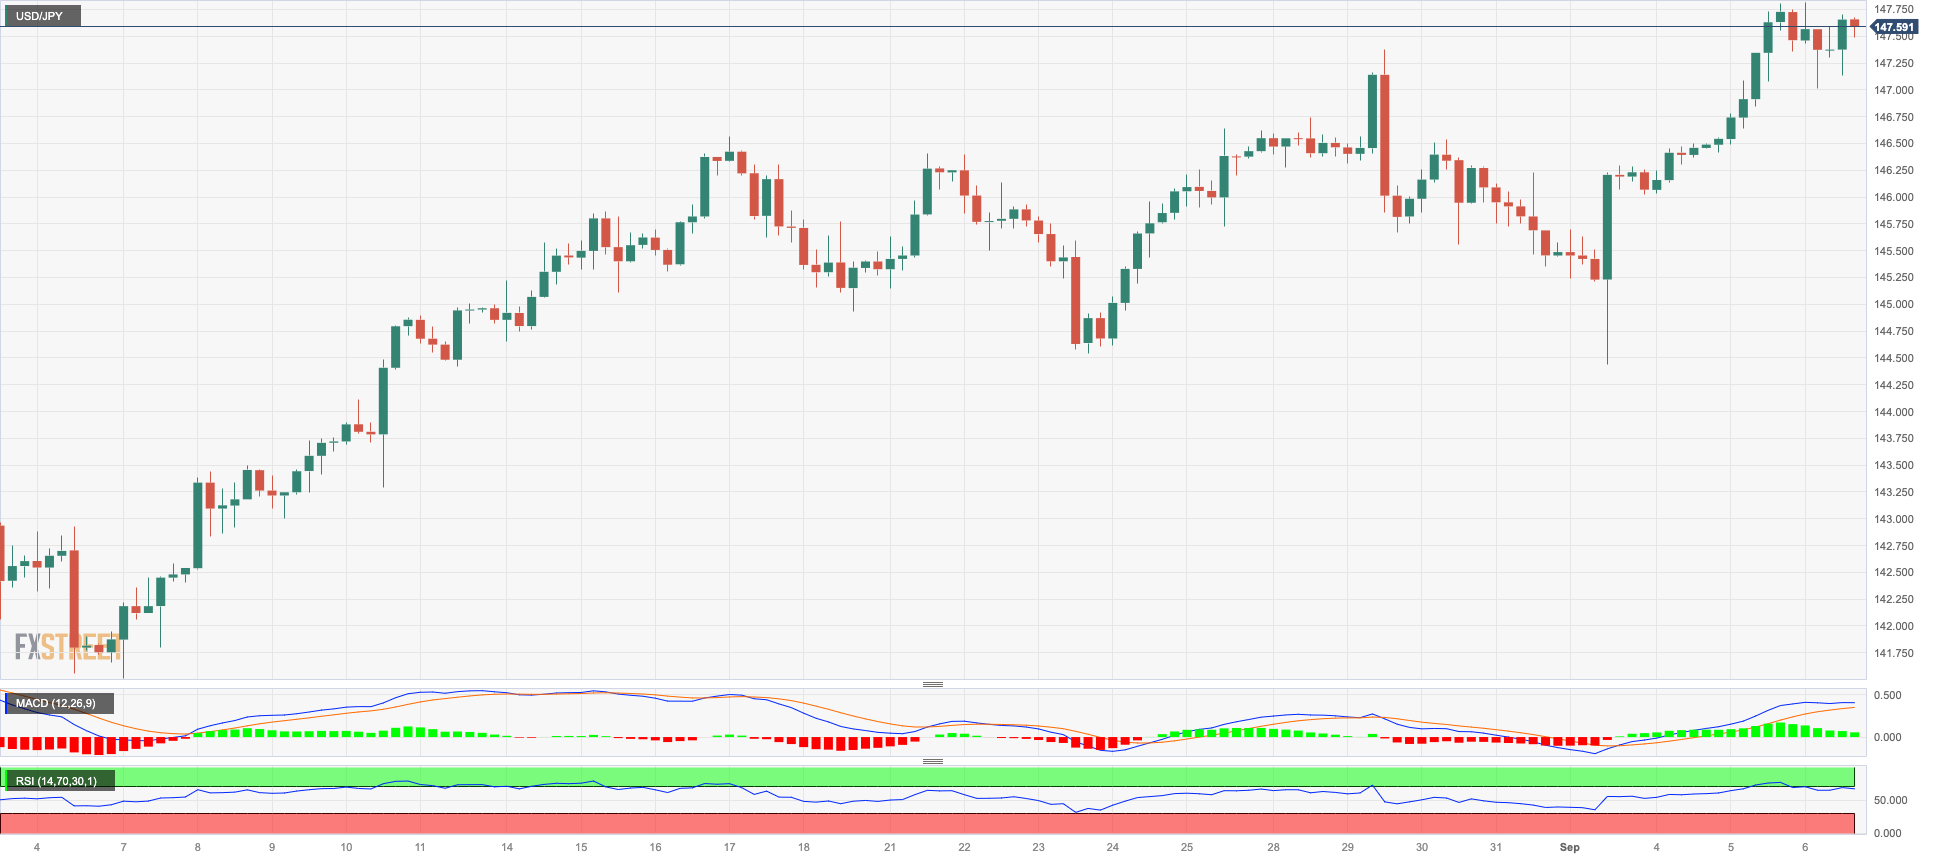
USDJPY
USD/JPY saw its weekly upside trim after hitting new yearly peaks in the 147.80/85 band on Wednesday.
In fact, the pari partially surrendered the recent advance in response to the vacillating mood around the greenback, while the uptick in US yields across the curve did nothing to alleviate the daily weakness.
Also adding to the downside in spot via Japanese strength came comments from Top Currency Diplomat Kanda, who did not rule out any options in response to (unwelcome) FX moves.
There were no data releases scheduled in Japan on Wednesday.
If USD/JPY breaks above the September high of 147.81 (September 6), it will certainly face the 2022 top of 151.95 (October 21). Having said that, the weekly low of 144.43 (September 1) takes precedence over the interim 55-day SMA of 143.43 and the August low of 141.50 (August 7). If this level is breached, the pair could target the weekly low of 138.05 (July 28) seconded by the July low of 137.23 (July 13) and finally the 200-day SMA of 136.94. A lower retracement could threaten the weekly low of 133.01 (April 26) as well as the minor level of 132.01 (April 13) and the April low of 130.62 (April 5). The everyday RSI grinded lower to the proximity of 63.
Resistance levels: 147.81 148.45 148.84 (4H chart)
Support levels: 147.01 146.32 144.43 (4H chart)
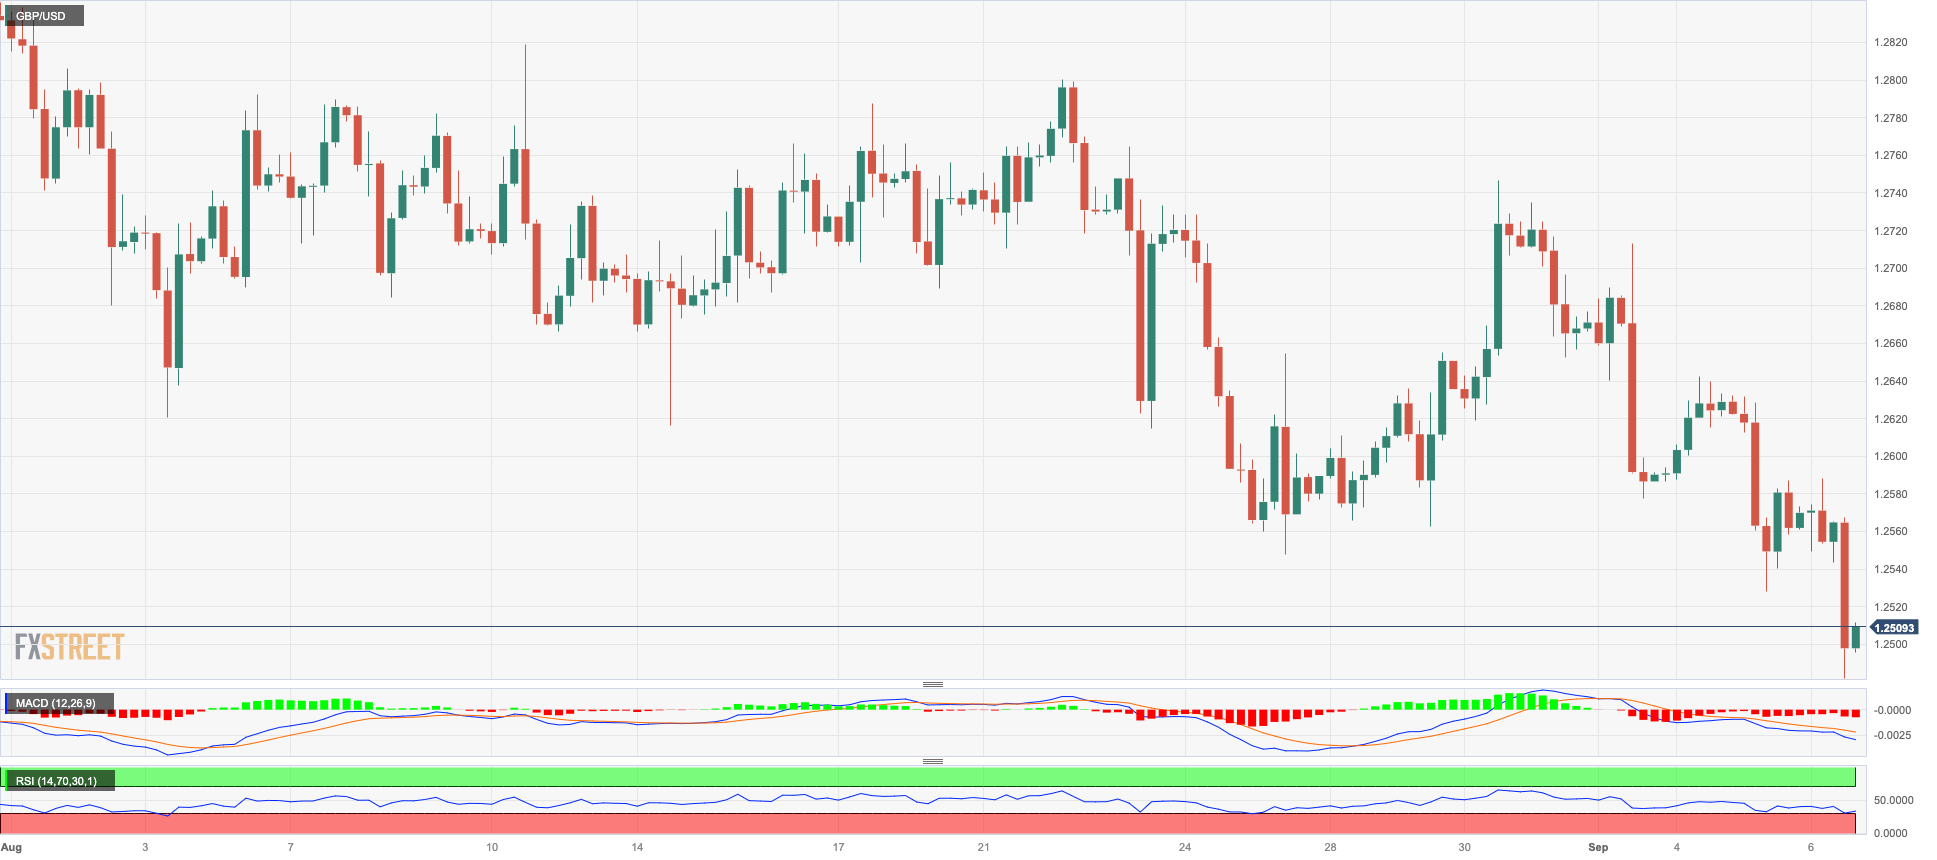
GBPUSD
Despite the marginal advance in the greenback, GBP/USD traded well on the defensive, keeping its price action subdued and briefly piercing the 1.2500 support for the first time since mid-June on Wednesday.
Furthermore, Cable clinched the second consecutive session of losses amidst the broader bearish move sparked soon after its yearly peaks near 1.3140 were recorded in early July.
Since then, the British pound has managed to close only two weeks in positive territory, as expectations of further tightening by the BoE continued to contrast with the current elevated inflation scenario and prospects for further deceleration of the UK economy.
Back to the BoE, the MPC Treasury Committee Hearings yielded mixed views: while (dove member) Dhingra stressed that the current policy is sufficiently restrictive, Governor Bailey did not rule out an uptick in the next inflation readings at the time when he emphasized the data-dependent stance of the decision making process and member Cunliffe suggested some cooling of the labour market. The overall view of the meeting pointed to a sticky inflation, while members reiterated the readiness to hike again.
In the UK docket, the Construction PMI eased to 50.8 in August (from 51.7) in what was the sole release across the Channel.
If the GBP/USD continues to fall, the next level of support is at the September low of 1.2527 (September 5), followed by the 2021-2023 trendline near 1.2420, which is also home of the crucial 200-day SMA. If this zone is breached, the June low of 1.2368 (June 5) might be reached before the May low of 1.2308 (May 25). Cable, on the other hand, may retake the 55-day SMA at 1.2762 before the weekly high at 1.2818 (August 10) and another weekly top at 1.2995 (July 27), which will be quickly followed by the psychological barrier at 1.3000. Once the pair clears the 2023 high of 1.3142 (July 14), the weekly peaks of 1.3146 (April 14, 2022) and 1.3298 (March 15, 2022) should be reclaimed. The day-to-day RSI receded to the 36 region.
Resistance levels: 1.2642 1.2712 1.2746 (4H chart)
Support levels: 1.2481 1.2368 1.2308 (4H chart)
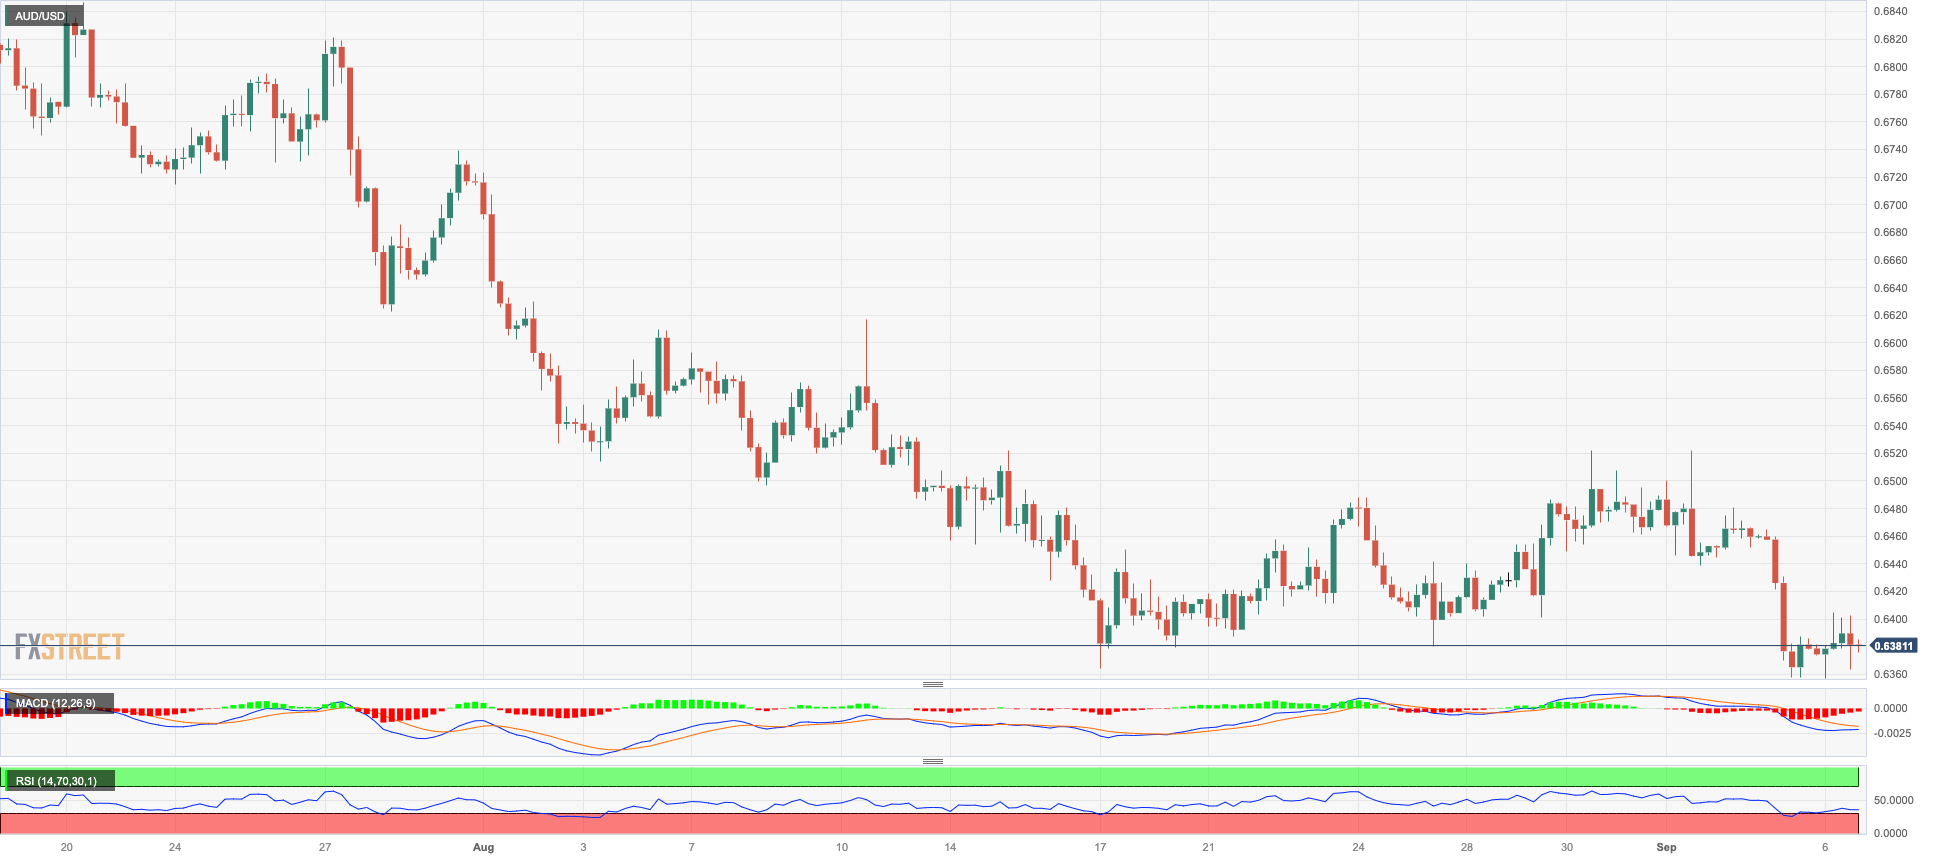
AUDUSD
AUD/USD finally managed to regain some upside traction and briefly pierced the key 0.6400 hurdle on Wednesday.
In fact, the Aussie dollar reversed part of Tuesday’s pronounced sell-off on the back of renewed selling pressure around the greenback, although the generalized negative session in the commodity complex appears to have limited the upside potential in spot.
Bolstering the strength in AUD also emerged the better-than-expected results from the Australian calendar, where the Ai Group Industry Index improved to -11.6 in August and the GDP Growth Rate showed the economy expanded 2.1% YoY in Q2 and 0.4% QoQ.
On a lower retracement, the AUD/USD may now retest the 2023 low of 0.6357 (September 5) before the November 2022 lows of 0.6272 (November 7) and 0.6179 (October 13). The pair, on the other hand, is facing immediate resistance at the weekly high of 0.6522 (August 30), followed by another weekly high of 0.6616 (August 10). Above this level, the pair may target the 200-day simple moving average at 0.6717, ahead of the July top of 0.6894 (July 14) and the June high of 0.6899 (June 16). The crucial 0.7000 level comes before the weekly high of 0.7029 (February 14) and the 2023 peak of 0.7157 (February 2). The daily RSI has dropped to around 36.
Resistance levels: 0.6439 0.6480 0.6521 (4H chart)
Support levels: 0.6357 0.6272 0.6210 (4H chart)
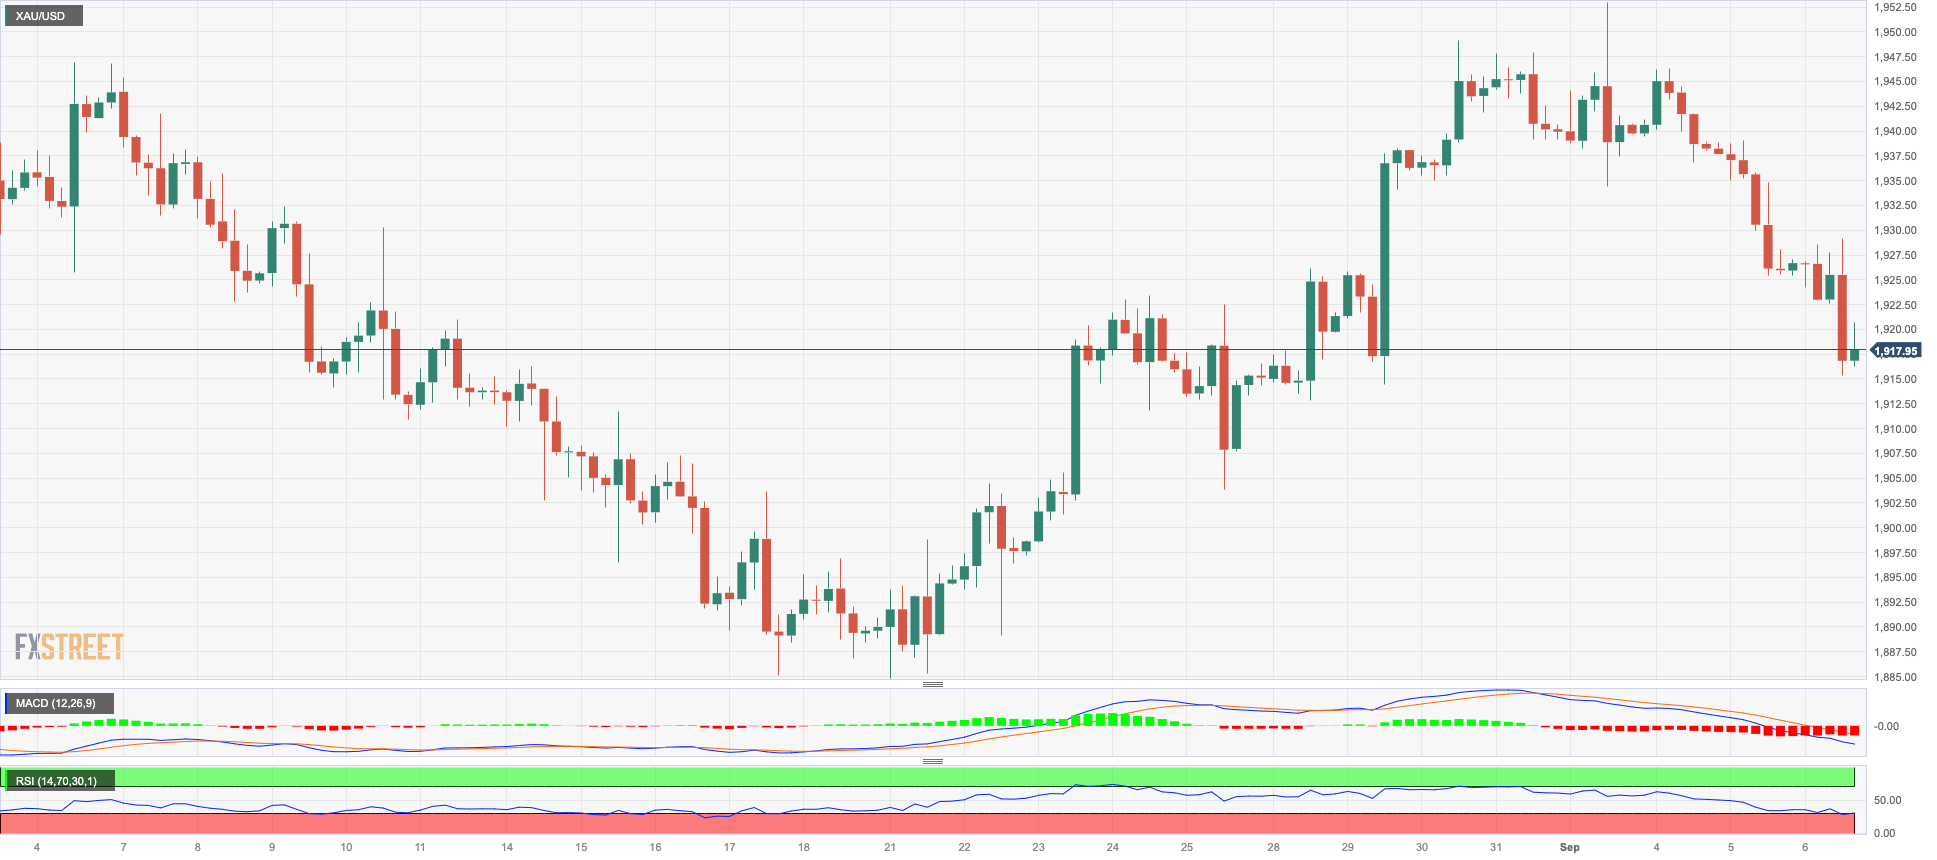
GOLD
Gold prices faced intensified downward pressure, leading them to test the crucial 200-day SMA around the $1915 level per troy ounce on Wednesday.
Once again, the resurgence of the greenback, driven by data-led factors, exerted a negative influence on USD-denominated assets. This, in turn, contributed to the third consecutive daily decline in the value of the precious metal.
Moreover, US bond yields swiftly reversed course following the unexpected positive surprise in the US ISM Services PMI for August, which ended up adding to the selling pressure on gold, exacerbating the decline in its value.
Further weakness could motivate gold prices to revisit the key contention area around $1900 prior to the August low of $1884 and the 2023 low of $1804 (28 February), all preceding the key support level of $1800. Instead, there is an immediate up barrier at the weekly high of $1953 (September 1), which appears to be supported by the 100-day SMA ($1952). Crossing this level could trigger a potential visit to the July top at $1987 (July 20) ahead of the psychologically important $2000 threshold. The surpass of this region could pave the way for an assault on the 2023 high of $2067 (May 4), followed by the 2022 top of $2070 (March 8) and the all-time peak of $2075 (August 7, 2020).
Resistance levels: $1929 $1953 $1972 (4H chart)
Support levels: $1915 $1903 $1884 (4H chart)
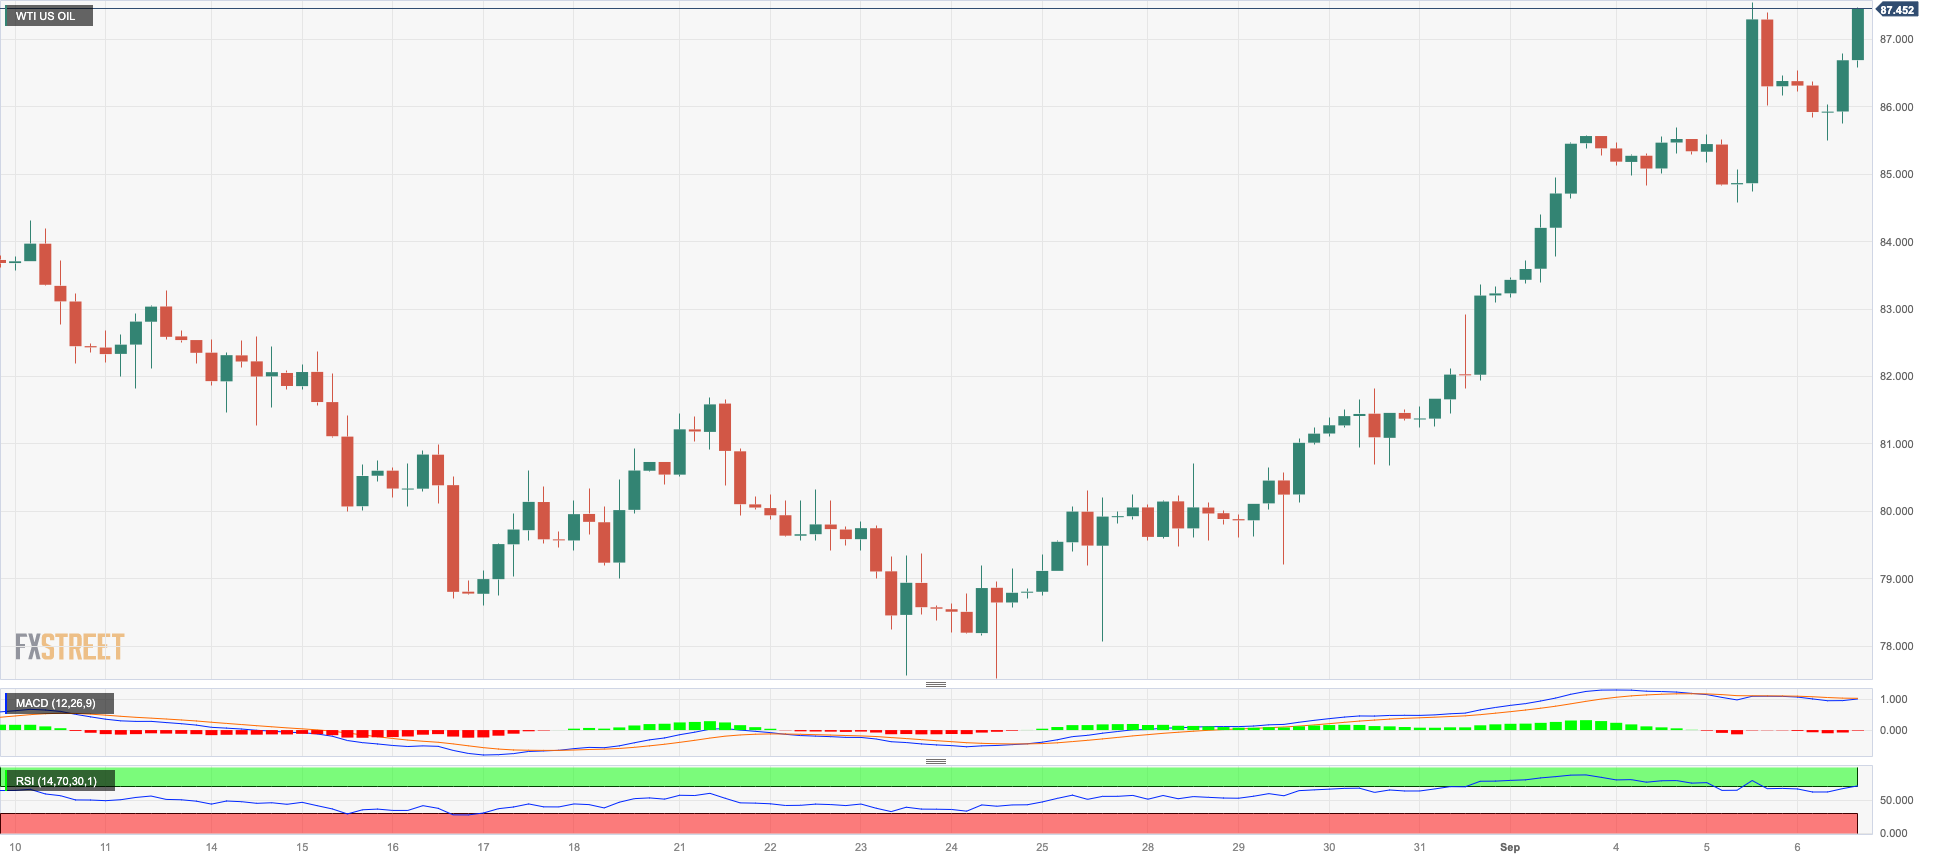
CRUDE WTI
WTI prices clinched the second consecutive advance on Wednesday despite the late bounce in the greenback and the generalized selling pressure in the commodity galaxy.
However, prices and traders’ sentiment in general remained bolstered by recent news of the continuation of the voluntary oil output cuts by Saudi Arabia as well as Russia’s plans to extend the reduction of its crude oil exports, both measures expected to extend into year-end.
Later in the NA session, the API will release its report on US crude oil stockpiles in the week leading up to September 1.
If the rally continues and WTI trespasses the 2023 high of $88.00 (September 5), the round level of $90.00 appears to be the next upside hurdle, followed by the November 2022 top at $93.73 (November 7) and the weekly high at $97.65 (August 30, 2022), all ahead of the critical $100.00 mark per barrel. The first support for a reversal is at the August low of $77.64 (August 24), which is above the 200-day SMA of $76.13. The breakdown of this area could lead to a retest of the weekly lows of $73.89 (July 17) seconded by $66.86 (June 12) and $63.61 (May 4) before reaching the 2023 low of $63.61. A deeper pullback could take prices closer to the December 2021 low of $62.46 (December 2), which is just above the key $60.00 level.
Resistance levels: $88.00 $88.65 $93.73 (4H chart)
Support levels: $84.99 $81.32 $77.56 (4H chart)
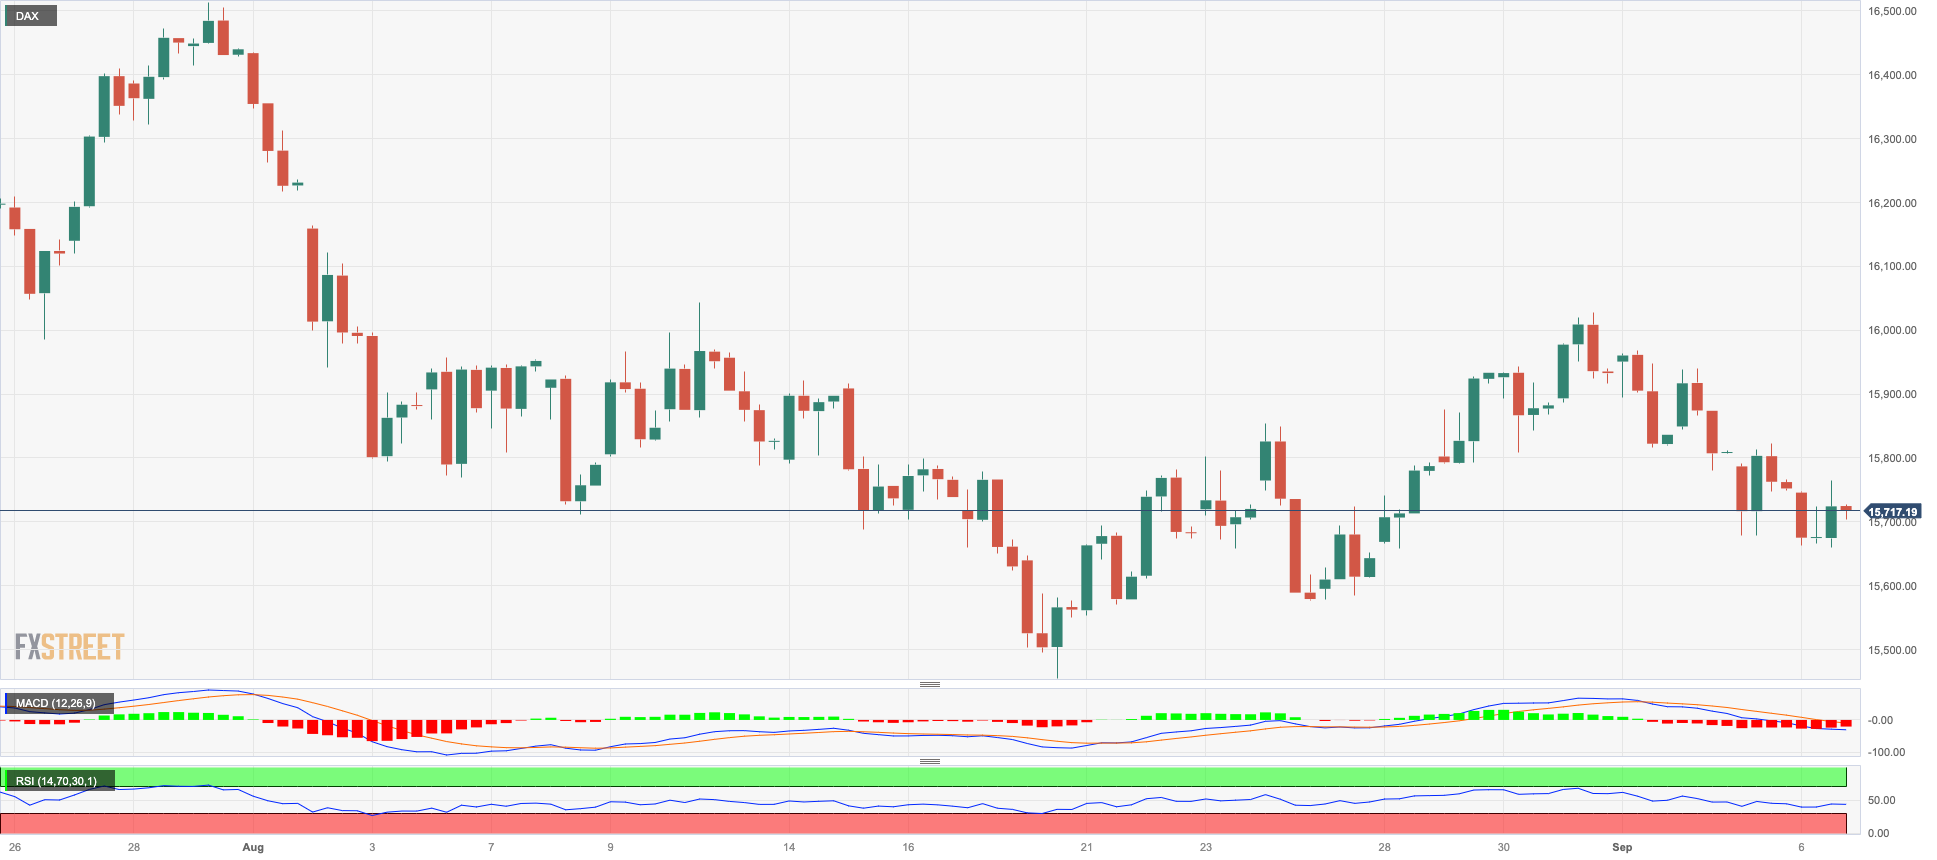
GER40
The combination of the ongoing rally in crude oil prices with disheartening fundamentals in Europe seems to have reinforced investors’ perception that stagflation could be in the offing in the region.
Against that, the key German benchmark DAX40 dropped for the fourth straight session on Wednesday, reaching new multi-session lows around the 15700 zone. The daily retracement in the index fell in line with the negative performance seen in other key European reference indices.
Contrasting with the weakness seen in stocks, the yields on 10-year bunds rose to new two-week highs past 2.65%.
Further DAX40 losses now target the August low of 15468 (August 18), which appears reinforced by the critical 200-day SMA (15469) and comes just ahead of the July low of 15456 (July 7). A decline below the latter could prompt the index to test the March low of 14458 (March 20) before the December 2022 low of 13791 (December 20) and the 2022 low of 11862 (28 September). By contrast, initial hurdle emerges at the weekly high at 16042 (August 31), which is just ahead of another weekly top at 16060 (August 10). A breakout above this level could refocus investors' attention on a possible challenge of the all-time peak of 16528 (July 31). The day-to-day RSI eased to the 45 region.
Best Performers: Vonovia, RWE AG ST, Heidelbergcement
Worst Performers: Zalando SE, Commerzbank, Fresenius SE
Resistance levels: 15966 16042 16060 (4H chart)
Support levels: 15676 15578 15468 (4H chart)
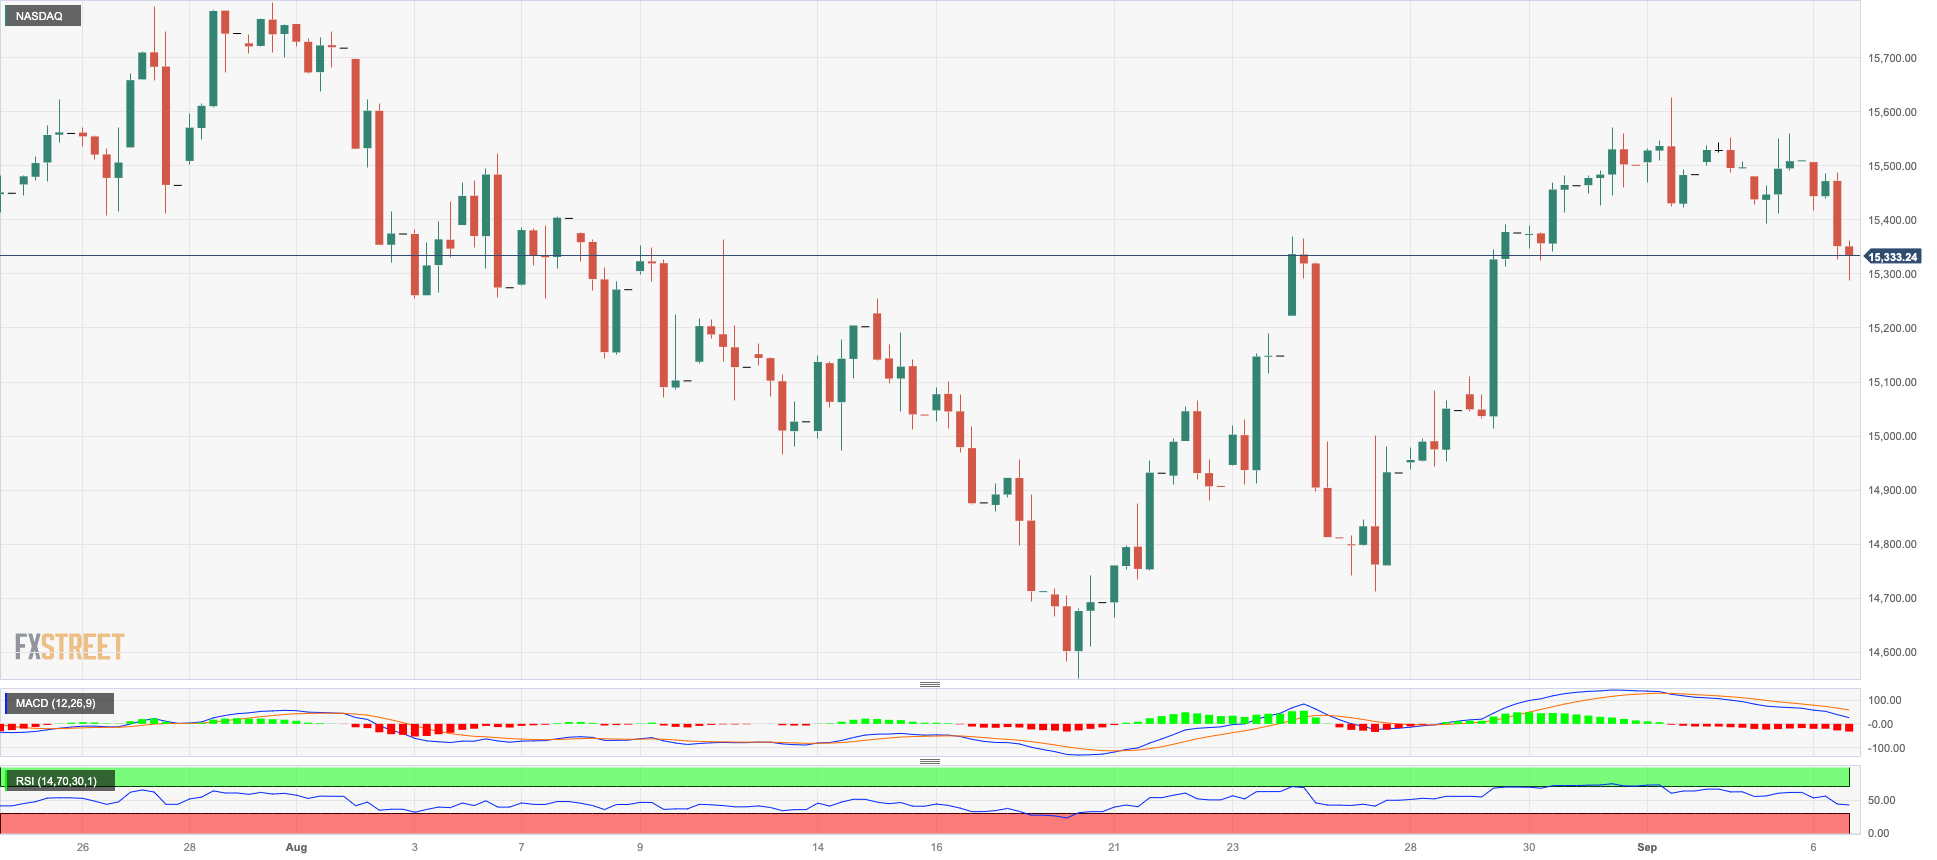
NASDAQ
The key tech index Nasdaq 100 resumed the weekly leg lower and quickly left behind Tuesday’s decent rebound to print new multi-session lows on Wednesday.
The poor performances from megacaps Apple, Tesla and Amazon among others, coupled with higher US yields across the curve and reignited concerns over the likelihood that the Federal Reserve might keep the restrictive stance for longer (or even go for another rate hike), all weighed on the tech sector and investors’ sentiment alike midweek.
In case the selling bias gathers extra impulse, the Nasdaq 100 should meet an interim hurdle at the 55-day SMA at 15238 prior to the minor weekly low at 14715 (August 25) and the August low of 14557 (August 18), which appears underpinned by the intermediate 100-day SMA. South from here comes the weekly lows of 14283 (June 7) seconded by 13520 (May 24), the 200-day SMA of 13275, and the April low of 12724 (April 25). On the opposite direction, the so-far September high of 15618 (September 1) comes first ahead of the weekly top of 15803 (July 31). The 2023 peak at 15932 (July 19) lies north of here, followed by the round mark of 16000. The daily RSI deflated to the sub-53 area.
Top Gainers: DexCom, Charter Communications, Comcast
Top Losers: Enphase, Lucid Group, Apple
Resistance levels: 15618 15795 15932 (4H chart)
Support levels: 15304 14715 14557 (4H chart)
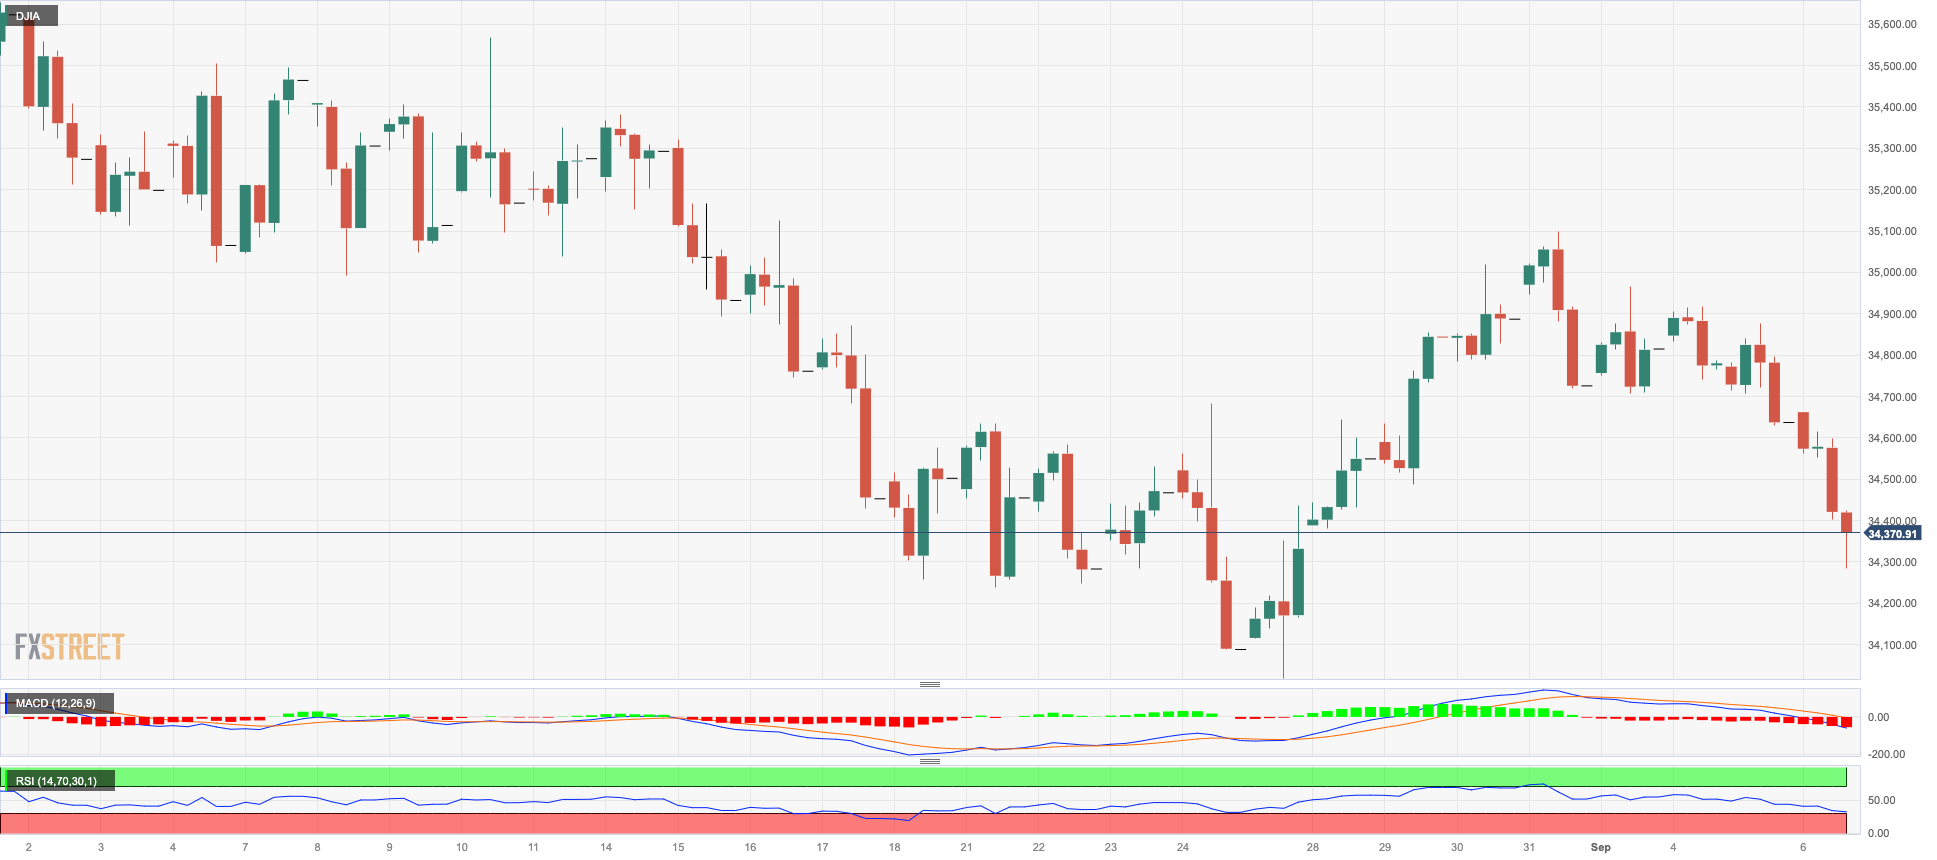
DOW JONES
US equities tracked by the Dow Jones added to Tuesday’s decline and dropped to multi-day lows near the 34300 zone on Wednesday.
In fact, stocks suffered another strong print from the US calendar, this time from the services sector, which reignited the Fed’s tighter-for-longer narrative and motivated bets on a November rate hike to gather some traction.
Overall, the Dow Jones retreated 0.89% to 34332, the S&P500 dropped 1.15% to 4443, and the tech-focused Nasdaq Composite deflated 1.50% to 13810.
The Dow Jones seems to be approaching the weekly high of 35070 (August 31). A break above this level reveals the 2023 peak at 35679 (August 1), the February 2022 peak at 35824 (February 9) and the all-time high at 36952 (January 5, 2022). Instead, a break below the August low of 34029 (August 25) might send the index down to the 200-day SMA at 33777 before hitting the July bottom of 33705 (July 10). The May low of 32586 (May 25) is followed by the 2023 low of 31429 (March 15). The RSI has dropped below 51.
Top Performers: Walmart, Salesforce Inc, Travelers
Worst Performers: Apple, Boeing, Amgen
Resistance levels: 35070 35578 35679 (4H chart)
Support levels: 34319 34029 33705 (4H chart)
MACROECONOMIC EVENTS
All Information & Updates provided by:

All information relating to the financial markets available on this page has been prepared and issued by FXStreet (Forexstreet SL, Spain, Reg: B62498233) on the basis of publicly available information and all information believed to be reliable and does not conflict with Kuwaiti local laws, and all necessary care has been taken to before the company to ensure that the facts mentioned are correct from the source.
NCM Investment nor any of its directors or employees shall in any way be held responsible for the contents of this news, and the information contained on this page is intended only to provide clients with publicly available information and should not be construed as investment advice, report or analysis and/or constitute an offer or invitation to buy or sell financial instruments of any kind.
RISK WARNING: Forex and CFDs are highly risky leveraged products, as losses can exceed deposits. Please ensure you understand all the risks and take independent advice if necessary. NCM will segregate the clients based on the criteria of the regulator and its bylaws. NCM does not provide any advisory service; the material published does not constitute advice or a recommendation for a transaction in any financial instrument. NCM accepts no responsibility for any use of the content presented and any consequences of that use. Anyone acting on the information provided does so at their own risk.