
- Contact Us:
-

-

-

-


Daily Market Updates
11 Sep 2023
USDJPY
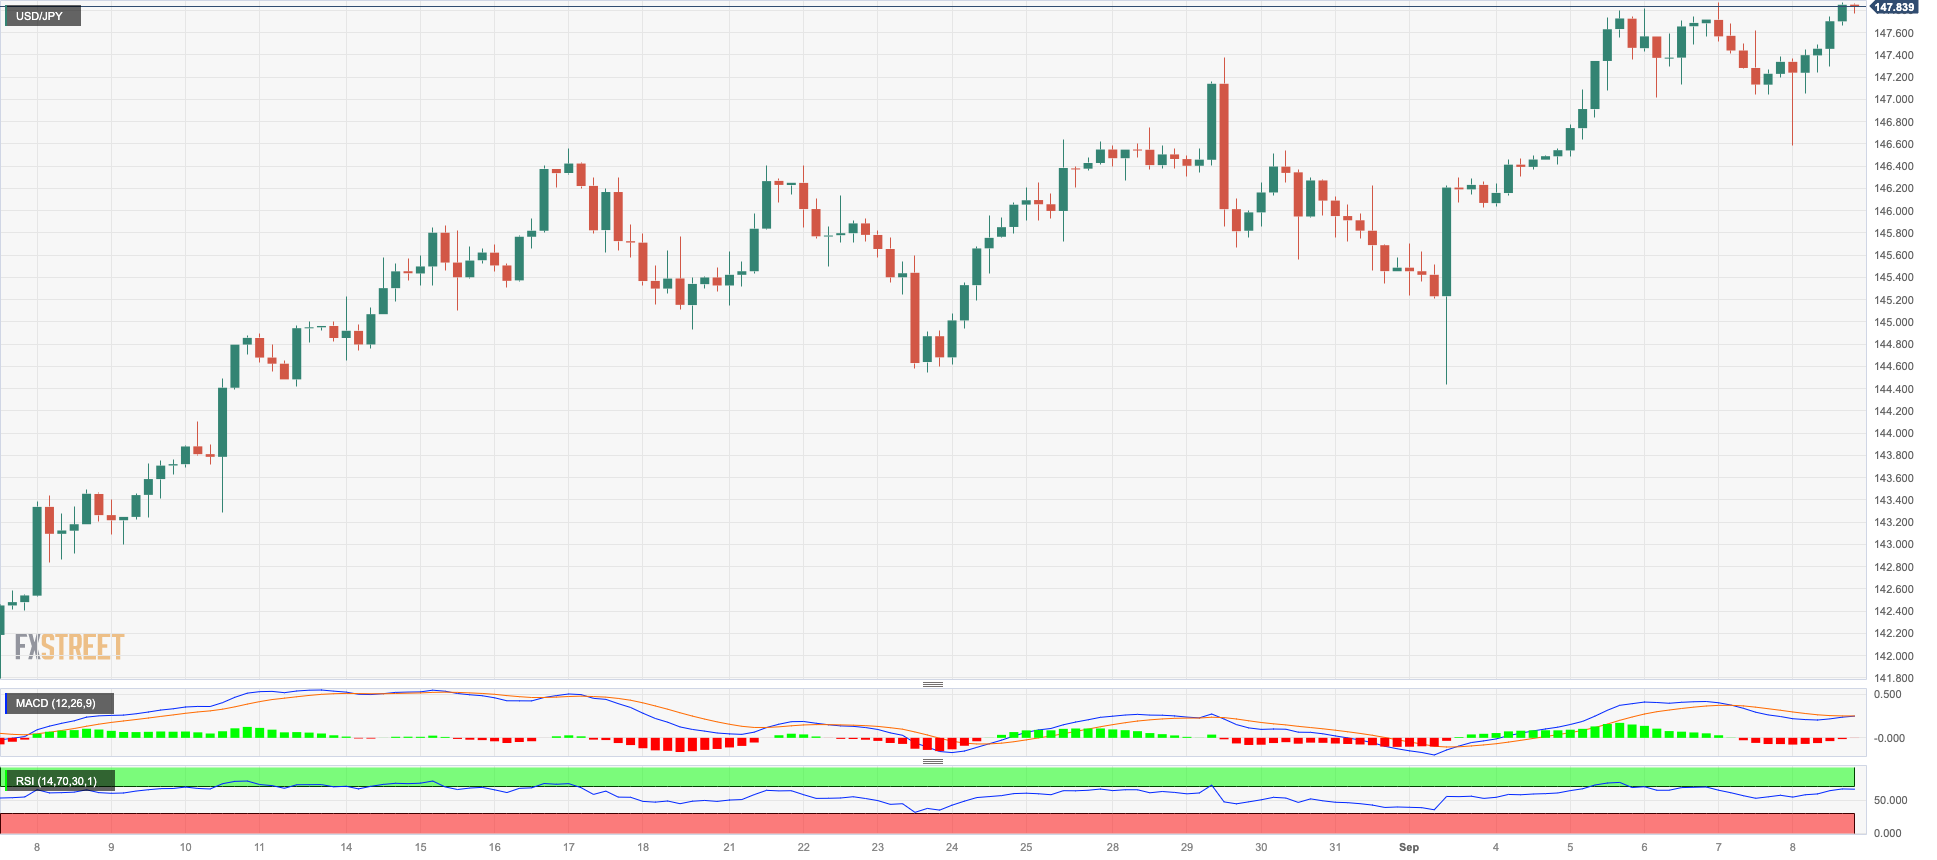
USD/JPY kept the choppiness well in place this week and reversed two daily pullbacks in a row on Friday, resuming the upside and ending the session just below the 2023 tops near 147.80.
The resumption of the upside momentum in the pair came in response to the late recovery in the greenback and the reversal in US yields in the short end and the belly of the curve, while the JGB 10-year yields ended marginally lower near 0.65%.
Reports from the Bank of Japan (BoJ) highlighted the remarks of Board member Suzuki, who emphasized the undesirability of rapid FX fluctuations. He reiterated the bank's preparedness to utilize all available options to tackle excessive movements in the FX market.
Busy day in the Japanese docket, as the final GDP Growth Rate expanded 4.8% YoY in Q2 and 1.2% QoQ. Extra data for the month of August also showed Bank Lending rising 3.1% from a year earlier, Eco Watchers Survey Current ease to 53.6 and Eco Watchers Survey Outlook recede to 51.4.
If USD/JPY breaks above the 2023 high at 147.87 (September 7), it will almost certainly face the 2022 top at 151.95 (October 21). On the downside, the September low of 144.43 (September 1) trumps the transitory 55-day SMA of 143.59 and the August low of 141.50 (August 7). If this level is breached, the pair could target the weekly low of 138.05 (July 28), then the July low of 137.23 (July 13) and finally the 200-day SMA of 137.07. A lower retracement could put the weekly low of 133.01 (April 26) and the smaller level of 132.01 (April 13) and the April low of 130.62 (April 5) in danger. The RSI on the daily chart improved to the boundaries of 65.
Resistance levels: 147.87 148.45 148.84 (4H chart)
Support levels: 146.58 144.64 144.43 (4H chart)
GBPUSD
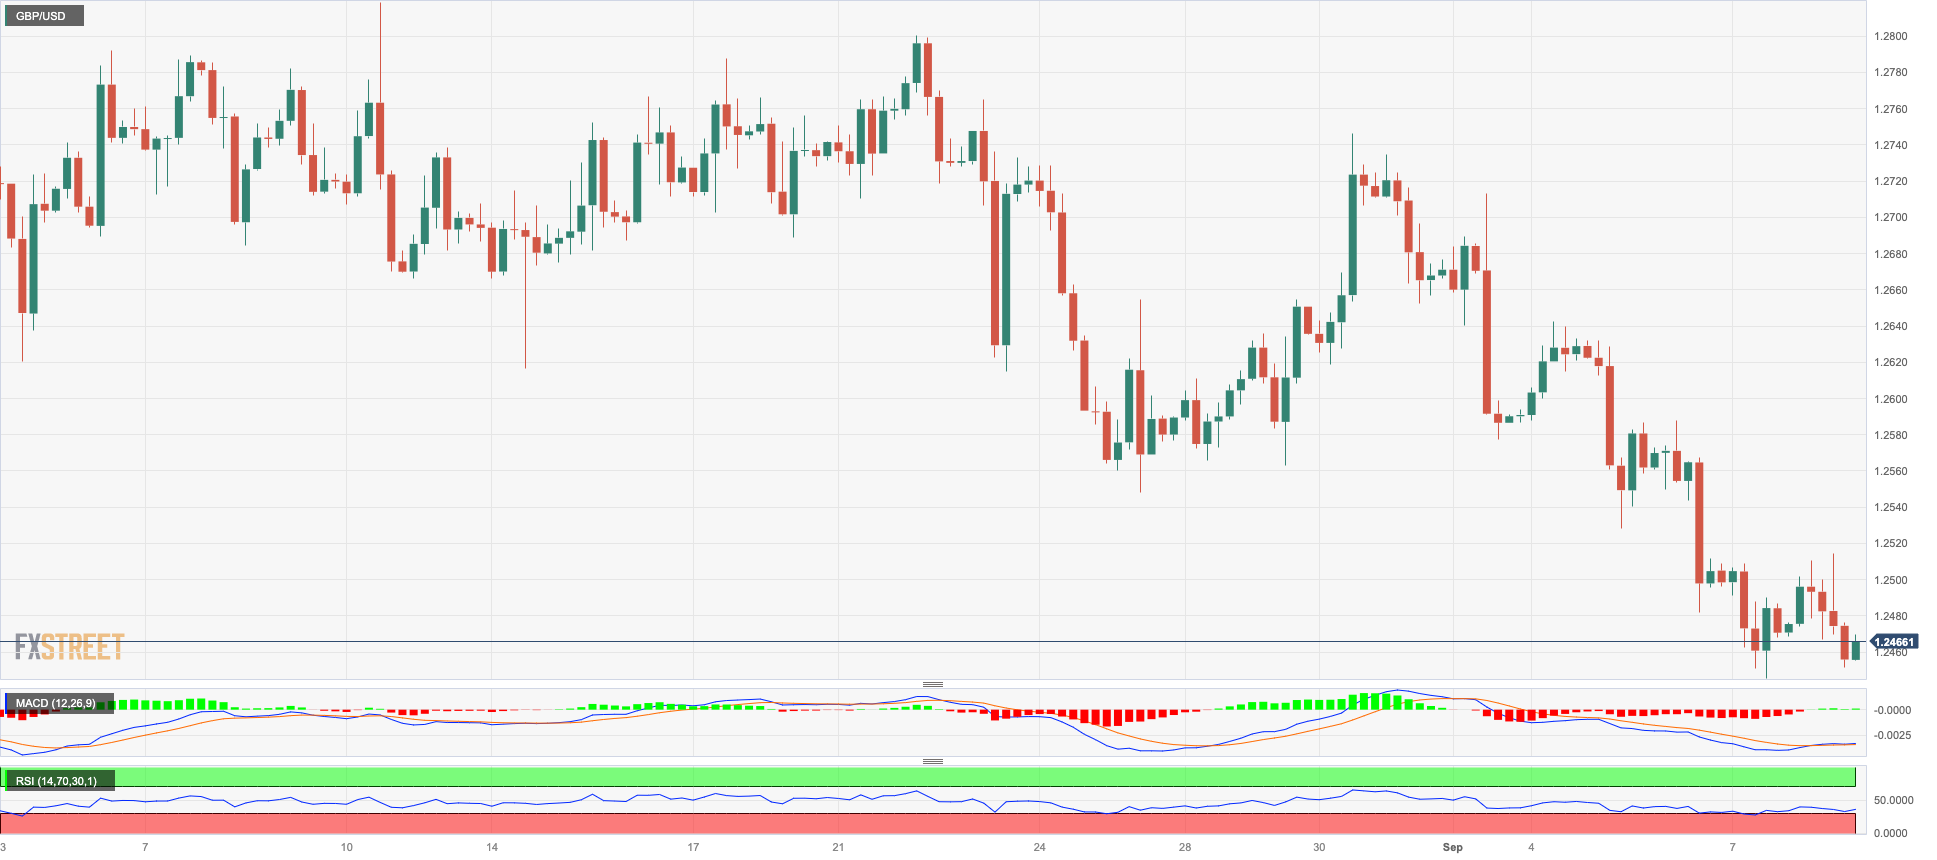
GBP/USD extended the move lower and closed Friday’s session well below the 1.2500 yardstick, down for the fourth consecutive session at the same time.
The recovery in the greenback coupled with the late bounce in US yields weighed further on the British pound and put Cable under extra pressure at the end of the week, while another negative performance of UK 10-year gilt yields also added to the sour sentiment around the quid.
There were no data releases scheduled across the Channel on Friday.
If the GBP/USD falls further, the next level of support is around the September low of 1.2445 (September 7), followed by the 2021-2023 trendline near 1.2420, where the crucial 200-day SMA is also positioned. If this zone is broken, the June low of 1.2368 (June 5) might be achieved ahead of the May low of 1.2308 (May 25). Cable, on the other hand, might retake the provisional 100-day SMA at 1.2653 ahead of the weekly high of 1.2746 (August 30), which looks underpinned by the interim 55-day SMA. North from here emerges the weekly highs at 1.2818 (August 10) and 1.2995 (July 27), just ahead of the psychological barrier at 1.3000. The day-to-day RSI grinded lower and flirted with the 33 zone.
Resistance levels: 1.2514 1.2587 1.2642 (4H chart)
Support levels: 1.2445 1.2368 1.2308 (4H chart)
AUDUSD
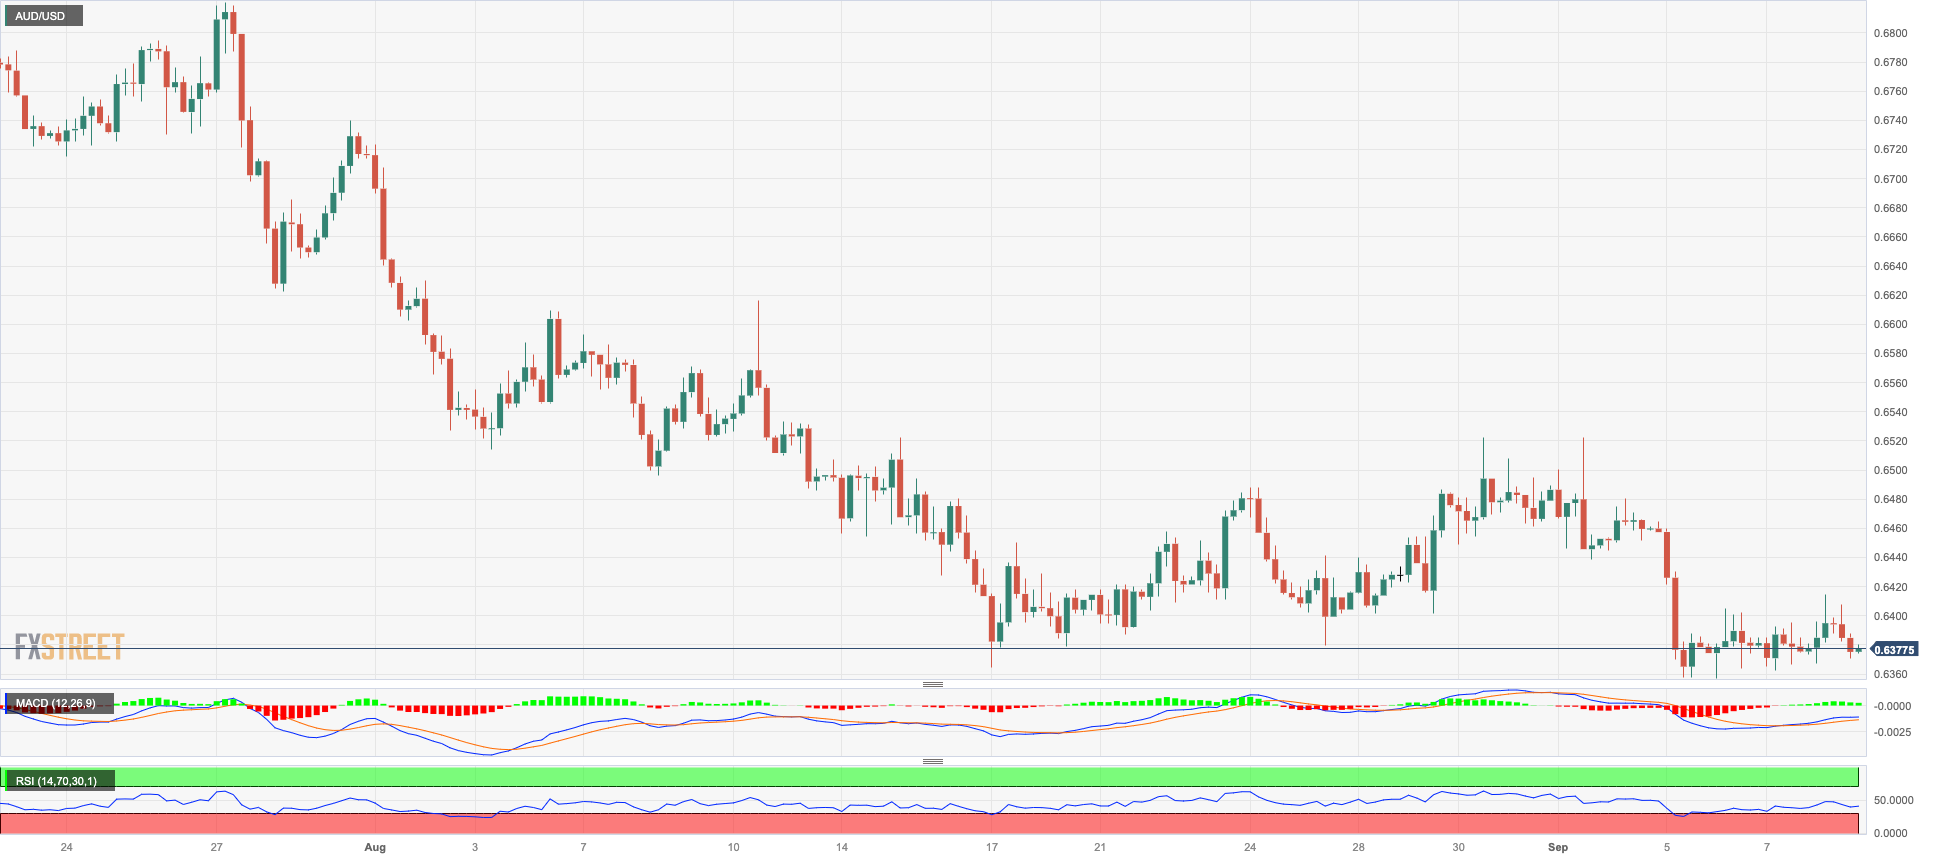
Another inconclusive session saw AUD/USD end around the previous session’s closing levels near 0.6370 on Friday.
The firmer sentiment surrounding the greenback weighed further on the high-beta currencies, while the broad-based bearish day in the commodity universe also added extra downside pressure to the Aussie dollar at the end of the week.
The Australian calendar was empty at the end of the week.
Immediately to the downside for AUD/USD appears the 2023 low of 0.6357 (September 5) before the November 2022 low of 0.6272 (November 7) and the 2022 low of 0.6179 (October 13). On the opposite side, spot is facing immediate resistance at the weekly high of 0.6522 (August 30), which is followed by another weekly top of 0.6616 (August 10). Above this level, the pair might aim for the 200-day SMA at 0.6711 before the July high of 0.6894 (July 14) and the June peak of 0.6899 (June 16). The critical level of 0.7000 is below the weekly top of 0.7029 (February 14) and the 2023 high of 0.7157 (February 2). The everyday RSI settled below the 36 yardstick.
Resistance levels: 0.6414 0.6480 0.6521 (4H chart)
Support levels: 0.6357 0.6272 0.6210 (4H chart)
GOLD
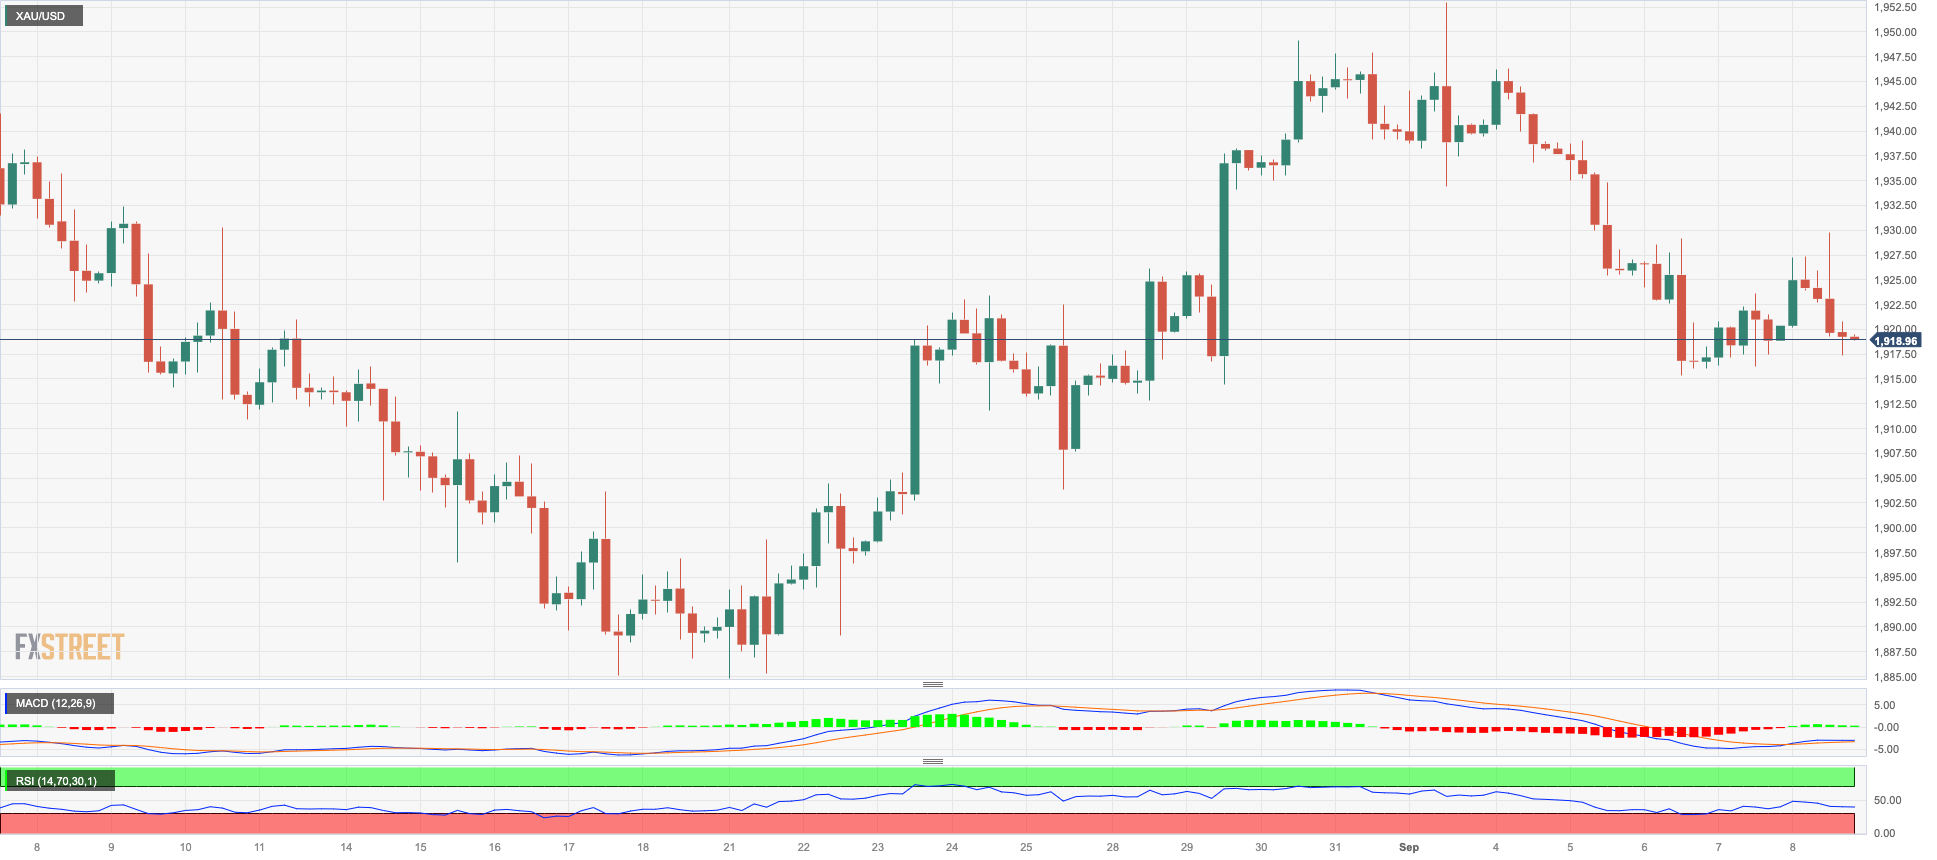
Gold prices could not sustain a move to three-day highs around $1930, where the interim 55-day SMA also sits, and eventually retreated to the proximity of $1920 per troy ounce at the end of the week.
The intense move higher in the greenback, the late uptick in US yields, and speculation that the Fed’s tighter-for-longer stance could extend further weighed on the traders’ mood and relegated the precious metal to print the first week of losses after two advances in a row.
A further decline could push gold back to the $1900 area before reaching the August low of $1884 and the 2023 low of $1804 (February 28), all ahead of the crucial $1800 support. Apart from that, the September high of $1953 (September 1) seems to be held by the 100-day SMA. A breakdown of this region could lead to a possible visit of the July top of $1987 (July 20), which is just short of the psychological $2000 level. Breaking out of this zone could pave the way for an attack on the 2023 peak of $2067 (May 4), followed by the 2022 top of $2070 (March 8) and the all-time high of $2075 (August 7, 2020).
Resistance levels: $1929 $1953 $1972 (4H chart)
Support levels: $1915 $1903 $1884 (4H chart)
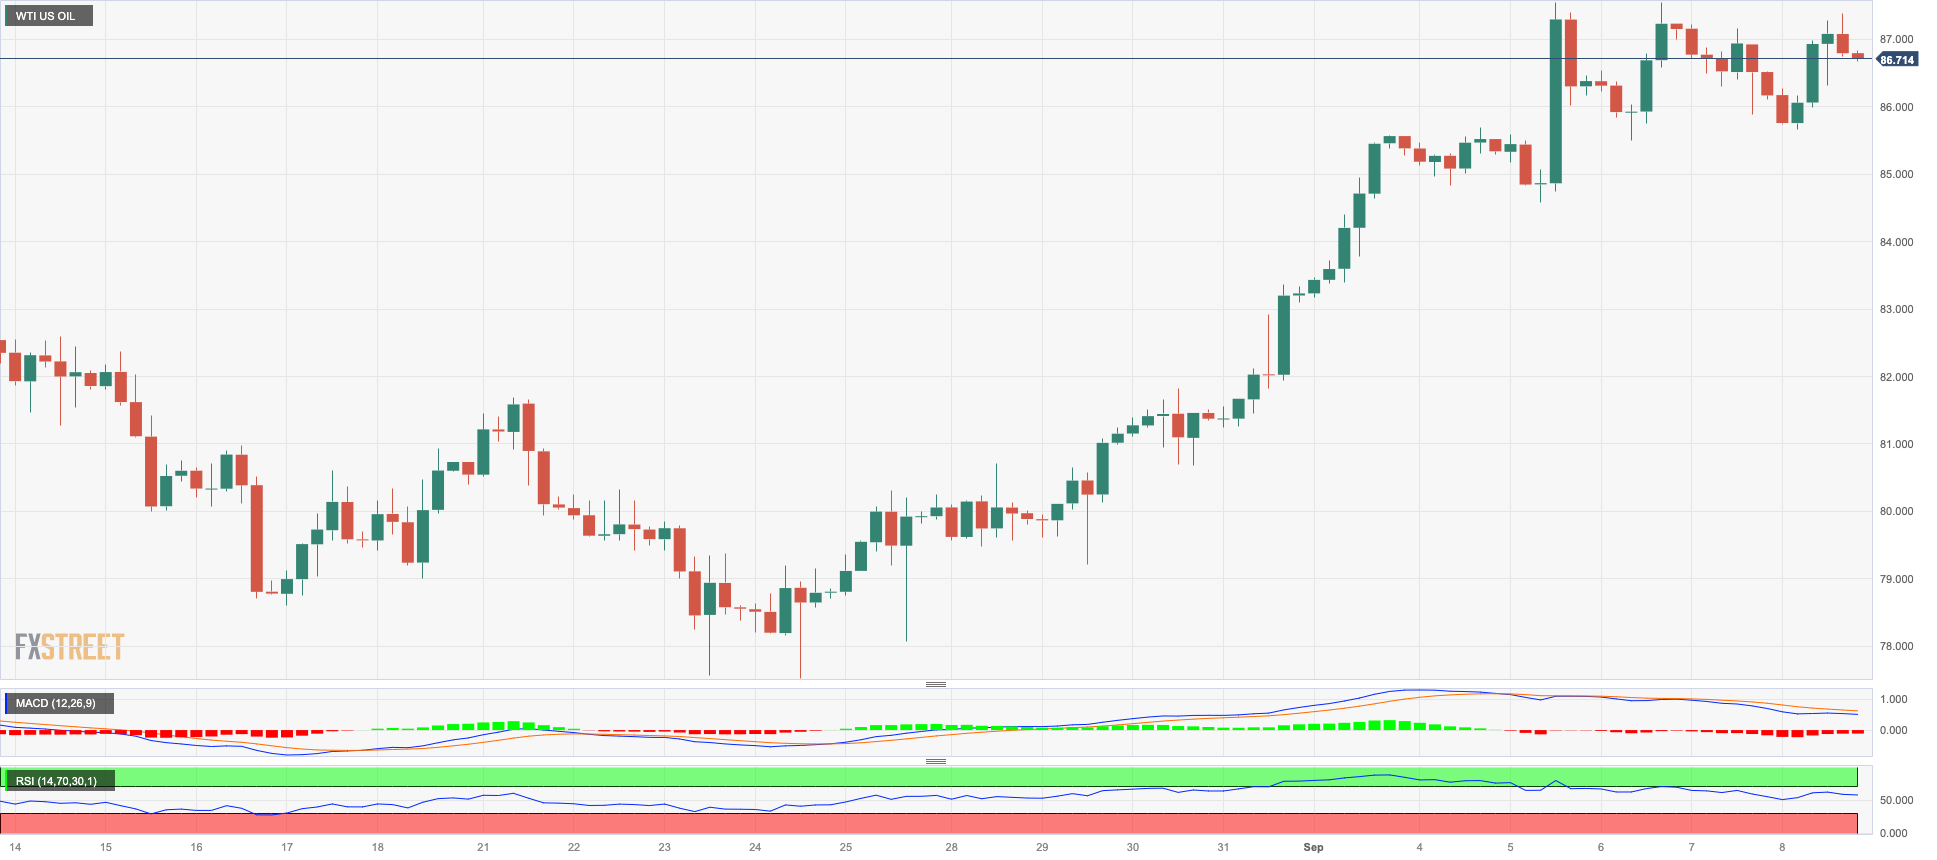
CRUDE WTI
WTI prices clinched the second consecutive week of gains and kept the trade near the yearly highs around the $88.00 mark per barrel on Friday.
Once again, the tight supply narrative kept prices afloat at the end of the week, a view that continued to be propped up by the oil output cuts from Saudi Arabia and Russia’s reduction of its crude oil exports, all helped at the same time by another weekly drop in US crude oil inventories, as reported by the EIA on Thursday.
Prices of the commodity, however, seem to have met some solid resistance just below the $90.00 mark in response to persistent demand concerns stemming from China.
Closing the weekly calendar, the US total oil rig count went up by 1 to 513 in the week to September 8, according to driller Baker Hughes.
If the rally continues and WTI breaks through the 2023 high at $88.05 (September 6), the round $90.00 level appears to be the next hurdle to the upside, followed by the November 2022 top at $93.73 (November 7) and the weekly peak at $97.65 (August 30, 2022), all before the critical $100.00 mark per barrel. On the flip side, the first reversal support is in the area of the August low of $77.64 (August 24), which is above the 200-day SMA of $76.23. A dip in this area could lead to a retest of the weekly lows at $73.89 (July 17) and $66.86 (June 12), all ahead of the 2023 low of $63.61 (May 4). South from here comes the December 2021 low at $62.46 (December 2), which is just above the important $60.00 level.
Resistance levels: $88.05 $88.65 $93.73 (4H chart)
Support levels: $86.12 $84.99 $81.63 (4H chart)
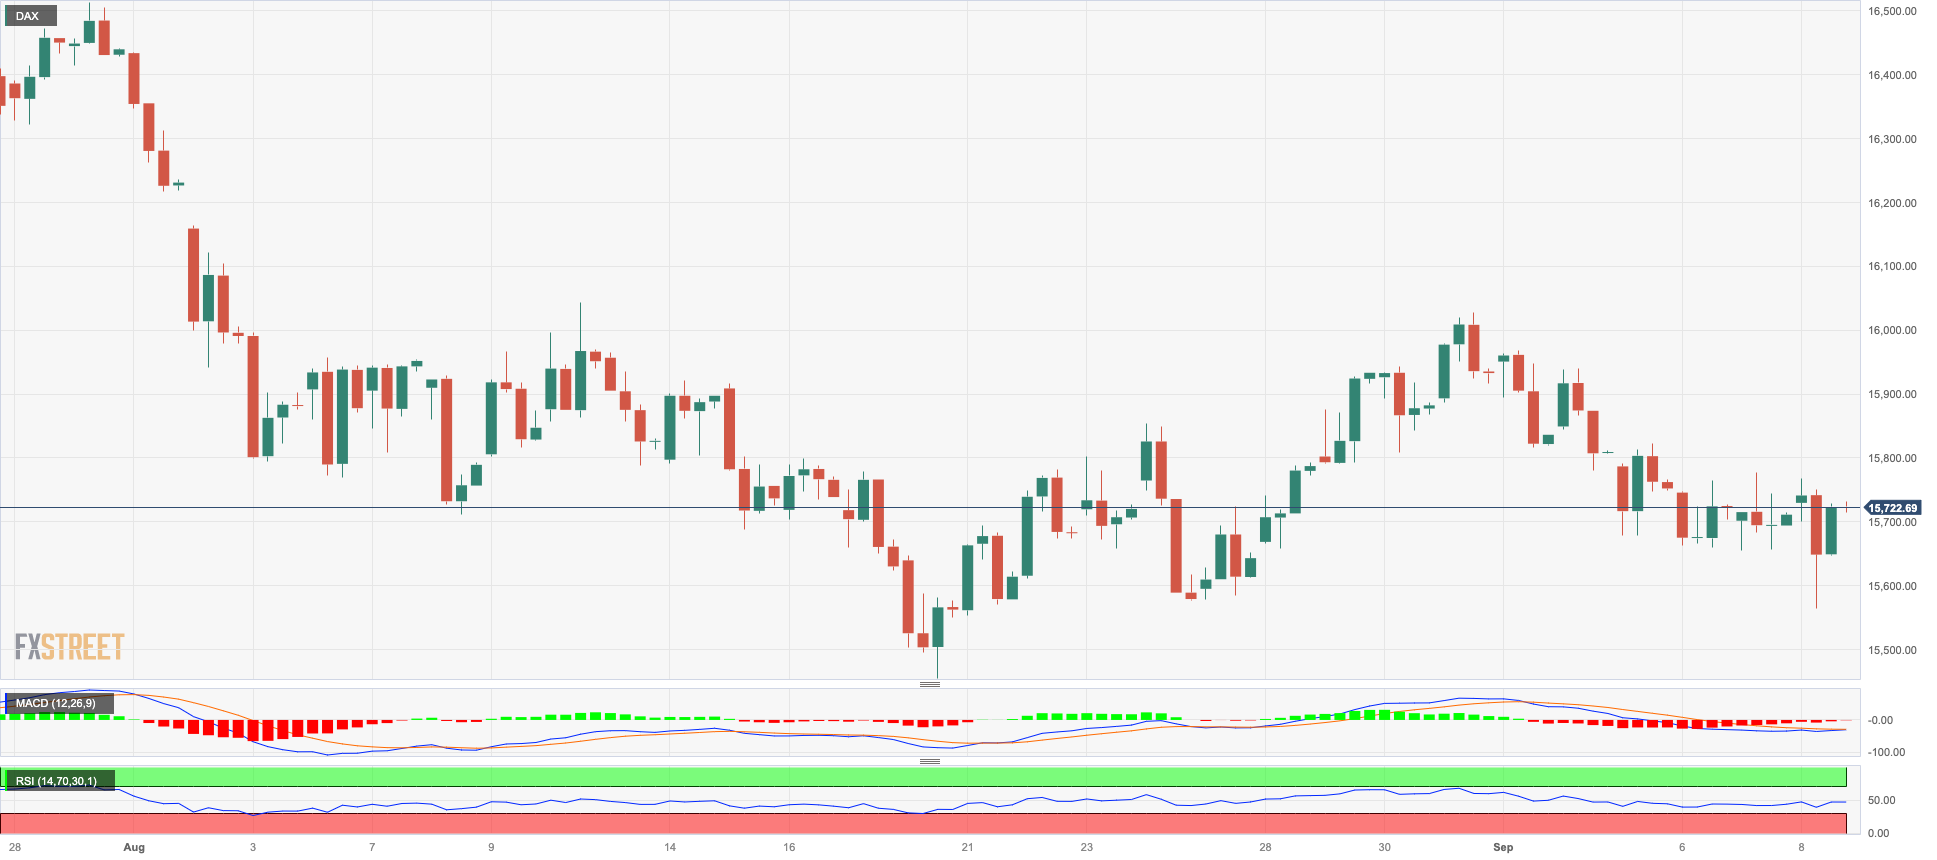
GER40
After five straight sessions of losses, the German reference DAX40 edged higher and managed to reclaim the 15700 region on Friday.
The daily advance in the index came despite omnipresent concerns around the deterioration of the outlook of the Chinese economy, while final inflation figures in Germany regurgitated worries that consumer prices are still running well above the ECB’s target.
In addition, bets on the continuation of the Fed’s restrictive policy for longer than previously estimated contrast with rising speculation that the ECB could skip a rate hike next week.
Back in the German fixed income space, the yields on 10-year bunds added to Thursday’s drop and revisited the 2.60% zone.
Further DAX40 losses now target the August low of 15468 (August 18), which seems to be supported by the 200-day SMA (15482) and is slightly ahead of the July low of 15456 (July 7). If the index drops below the latter, it could challenge the March low of 14458 (March 20) before testing the December 2022 low of 13791 (December 20) and the 2022 low of 11862 (September 28). On the opposite direction, there is a temporary barrier at the 55-day SMA at 15925 prior to the weekly highs of 16042 (August 31) and 16060 (August 10). A break above the latter could bring investors' attention back to a possible challenge of the all-time top of 16528 (July 31). The RSI improved slightly past the 45 level.
Best Performers: Covestro, Commerzbank, Volkswagen VZO
Worst Performers: Zalando SE, MTU Aero, Sartorius AG VZO
Resistance levels: 15958 16042 16060 (4H chart)
Support levels: 15577 15468 15456 (4H chart)
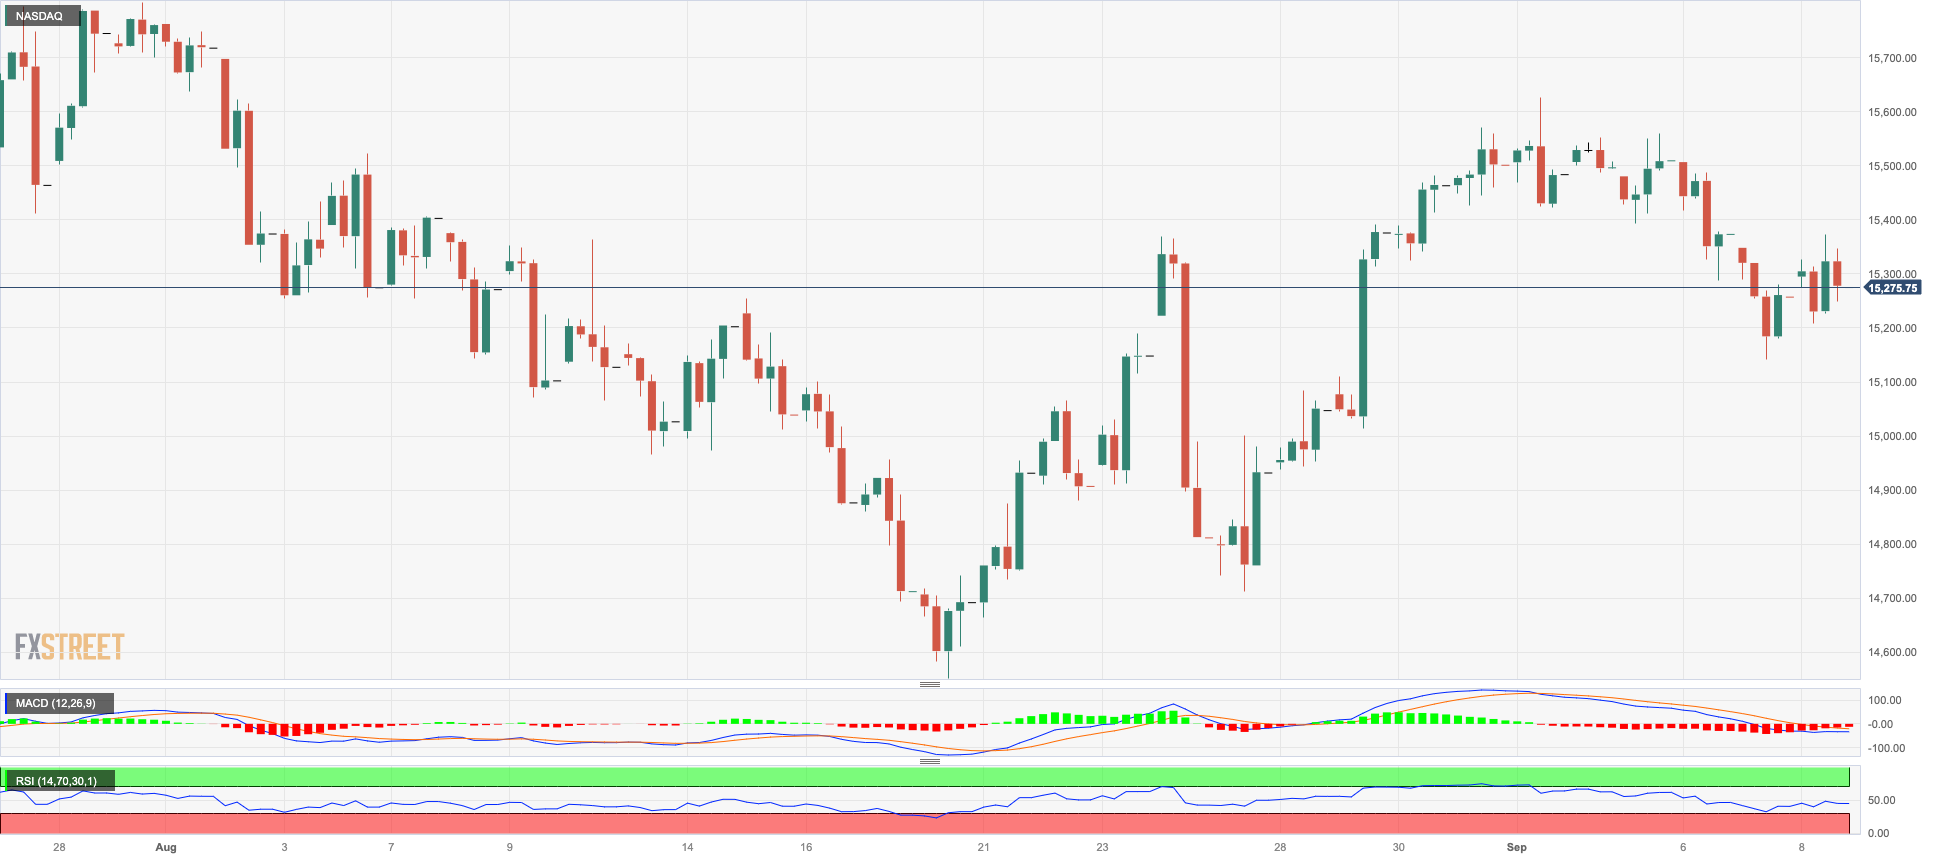
NASDAQ
The US tech benchmark Nasdaq 100 managed to print humble gains and reverse two consecutive daily pullbacks at the end of the week.
The modest uptick in the index came despite the late rebound in the dollar in combination with higher yields in the 2-year/10-year segment, all amidst expectations of a Fed’s tighter-for-longer stance and an impasse at the September meeting.
If the selling trend continues, the Nasdaq 100 is expected to test the tiny weekly bottom at 14715 (August 25), which looks to be supported by the 100-day SMA and comes before the August low of 14557 (August 18). The breach of this level could put the weekly lows at 14283 (June 7) and 13520 (May 24) back on the radar prior to the 200-day SMA of 13311. In the inverse direction, the September high of 15618 (September 1) comes first, followed by the weekly top of 15803 (July 31). The 2023 peak at 15932 (July 19) lies north of this, seconded by the round mark of 16000. On a daily basis, the RSI climbed marginally to the 52 area.
Top Gainers: Marriott Int, Gilead, Warner Bros Discovery
Top Losers: Lucid Grop, Old Dominion Freight Line, Align
Resistance levels: 15618 15795 15932 (4H chart)
Support levels: 15138 14715 14557 (4H chart)
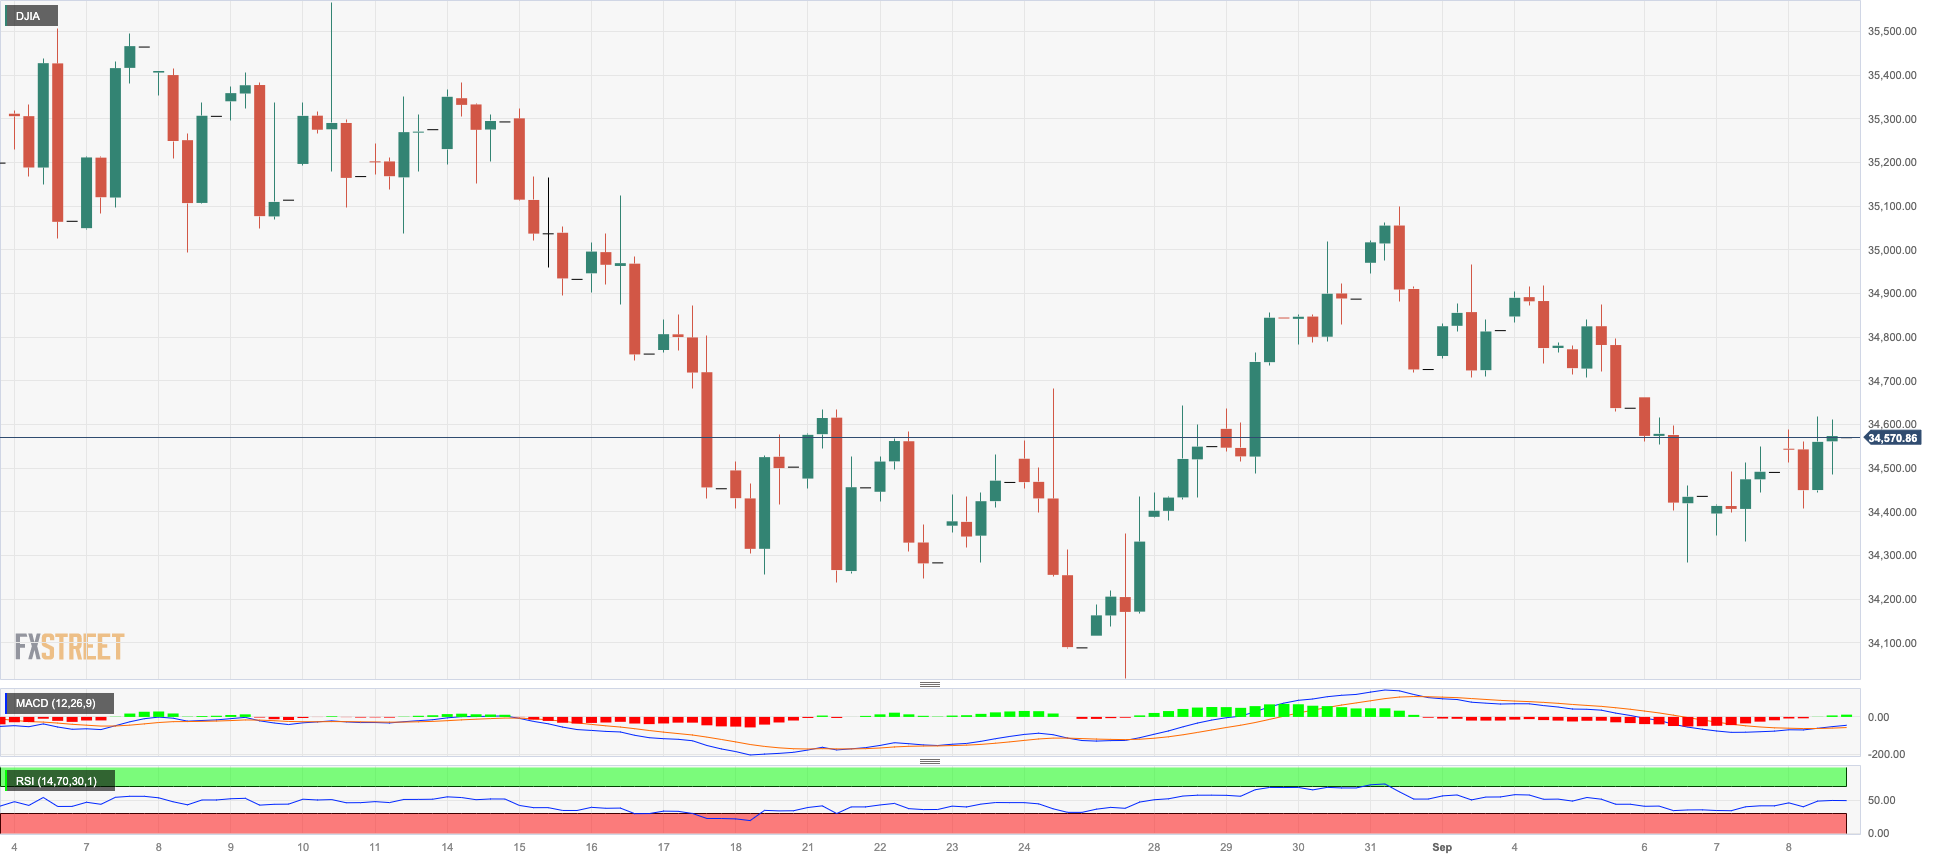
DOW JONES
The US benchmark index Dow Jones extended the optimism seen in the latter part of the week and closed Friday’s session with decent gains around the 34600 region.
In the meantime, market participants continued to assess the likelihood that the Fed might keep its restrictive monetary stance for longer than anticipated against the backdrop of the current strength of US fundamentals, while some cautiousness started to emerge ahead of the release of US inflation figures on September 13.
Overall, the Dow Jones rose 0.22% to 34576, the S&P500 advanced 0.14% to 4457, and the tech-reference Nasdaq Composite gained 0.09% to 13761.
If the Dow Jones falls below the August low of 34029 (August 25), it might return to the 200-day SMA at 33789, ahead of the July low of 33705 (July 10). The May low of 32586 (May 25) is followed by the 2023 low of 31429 (March 15). The initial up-barrier aligns at the weekly high of 35070 (August 31) seconded by the 2023 top of 35679 (August 1) and the February 2022 peak of 35824 (February 9). The breakout of the latter could open the door to the all-time high of 36952 (January 5, 2022). The RSI rose past the 47 mark.
Top Performers: Amgen, Microsoft, Walt Disney
Worst Performers: Boeing, Verizon, Dow
Resistance levels: 35070 35578 35679 (4H chart)
Support levels: 34291 34029 33705 (4H chart)
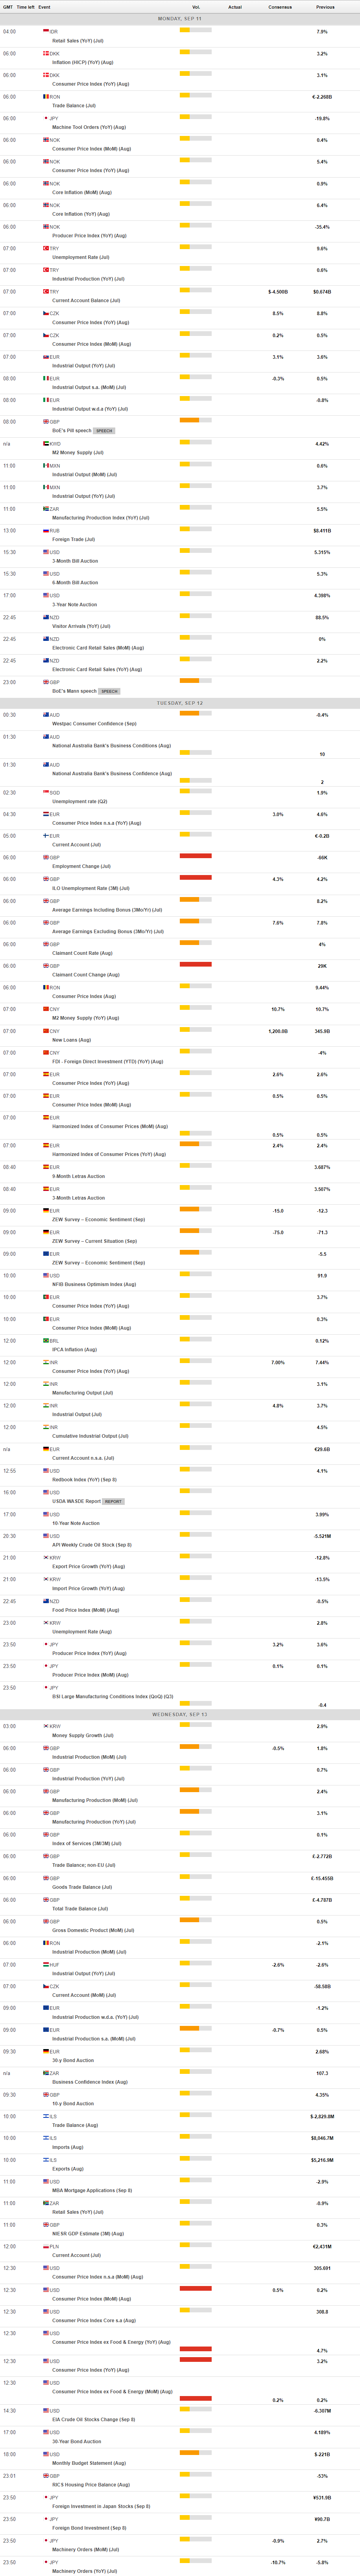
MACROECONOMIC EVENTS
All Information & Updates provided by:

All information relating to the financial markets available on this page has been prepared and issued by FXStreet (Forexstreet SL, Spain, Reg: B62498233) on the basis of publicly available information and all information believed to be reliable and does not conflict with Kuwaiti local laws, and all necessary care has been taken to before the company to ensure that the facts mentioned are correct from the source.
NCM Investment nor any of its directors or employees shall in any way be held responsible for the contents of this news, and the information contained on this page is intended only to provide clients with publicly available information and should not be construed as investment advice, report or analysis and/or constitute an offer or invitation to buy or sell financial instruments of any kind.
RISK WARNING: Forex and CFDs are highly risky leveraged products, as losses can exceed deposits. Please ensure you understand all the risks and take independent advice if necessary. NCM will segregate the clients based on the criteria of the regulator and its bylaws. NCM does not provide any advisory service; the material published does not constitute advice or a recommendation for a transaction in any financial instrument. NCM accepts no responsibility for any use of the content presented and any consequences of that use. Anyone acting on the information provided does so at their own risk.