
- Contact Us:
-

-

-

-


Daily Market Updates
12 Sep 2023
USDJPY
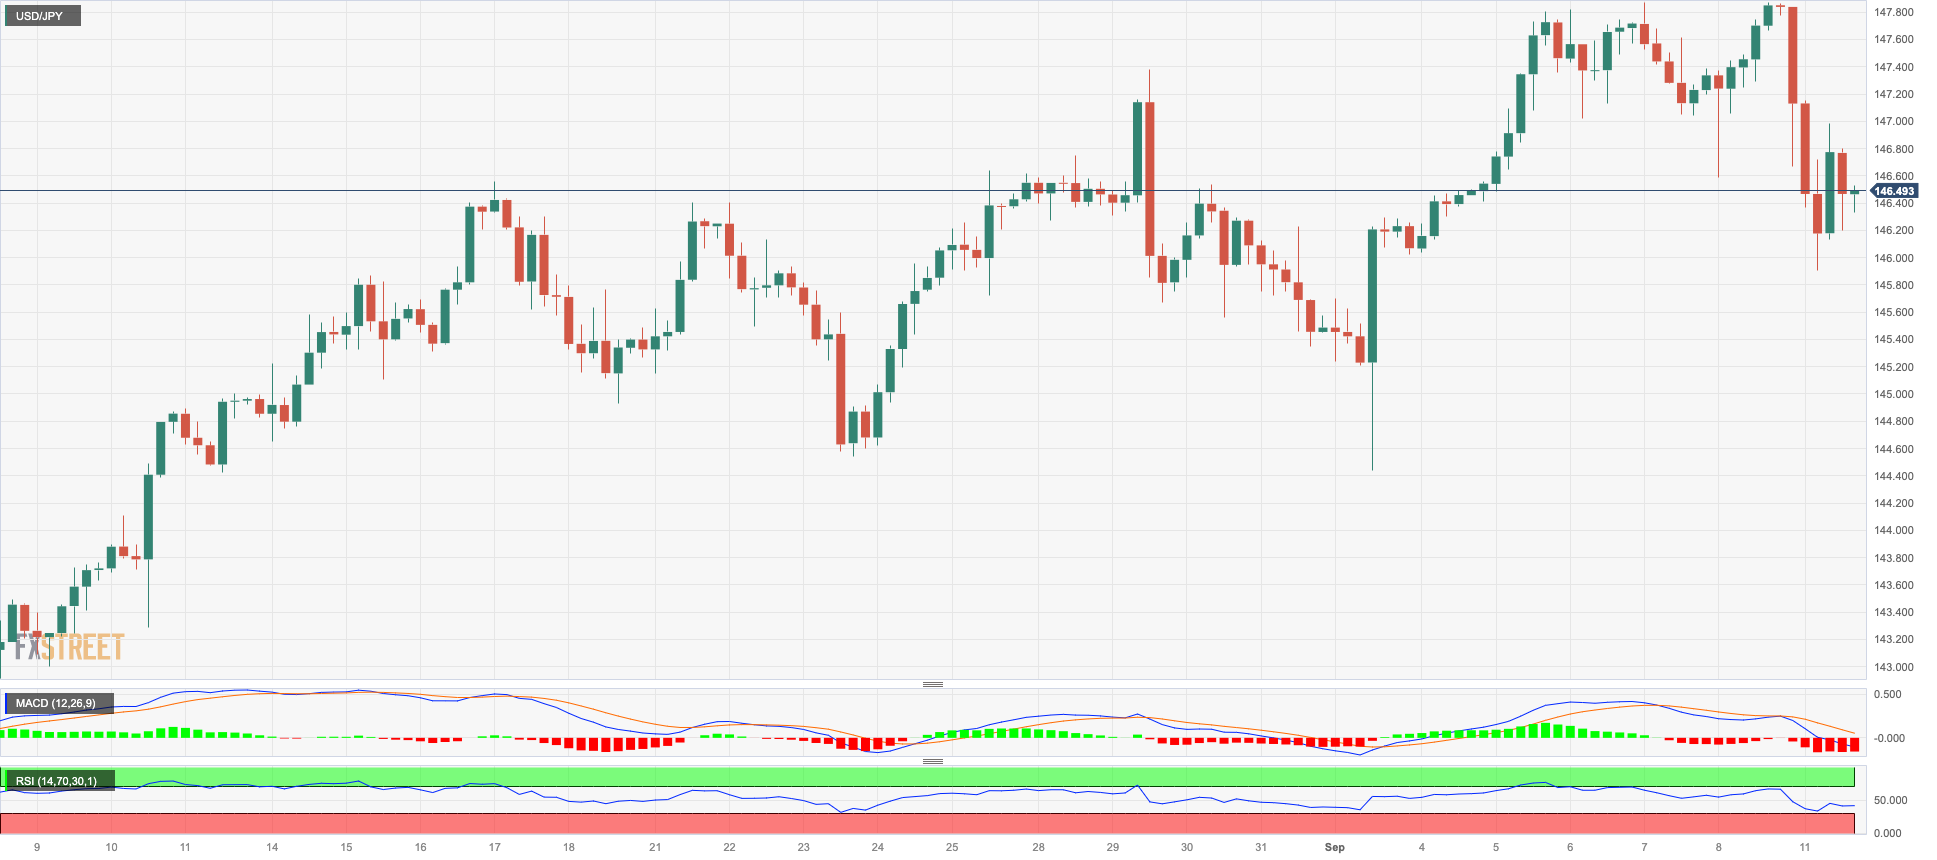
The resumption of buying interest in the Japanese currency dragged USD/JPY to multi-session lows in the sub-146.00 region on Monday, where it managed to stage a decent comeback soon afterwards.
The demand for the Japanese yen picked up pace after BoJ Governor K. Ueda hinted at the likelihood of a "stealth exit" of the current ultra-accommodative monetary policy stance.
The negative start of the week for the greenback and a small uptick in US yields across the curve vs. the jump in JGB 10-year yields past the 0.70% mark also added to the downward bias in spot.
In Japan, Machine Tool Orders contracted at an annualized 17.6% in August.
If USD/JPY breaks over the 2023 high of 147.87 (September 7), it will almost likely face the 2022 high of 151.95 (October 21). On the downside, the September low of 144.43 (September 1) takes precedence over the transitory 55-day SMA of 143.64 and the August low of 141.50 (August 7). If this level is broken, the pair may go for the weekly low of 138.05 (July 28), the July low of 137.23 (July 13), and eventually the 200-day SMA of 137.11. A lower retracement might put the weekly low of 133.01 (April 26) in jeopardy, as well as the minor levels of 132.01 (April 13) and 130.62 (April 5). On the daily chart, the RSI deflated to the sub-56 area.
Resistance levels: 147.87 148.45 148.84 (4H chart)
Support levels: 145.89 144.78 144.43 (4H chart)
GBPUSD
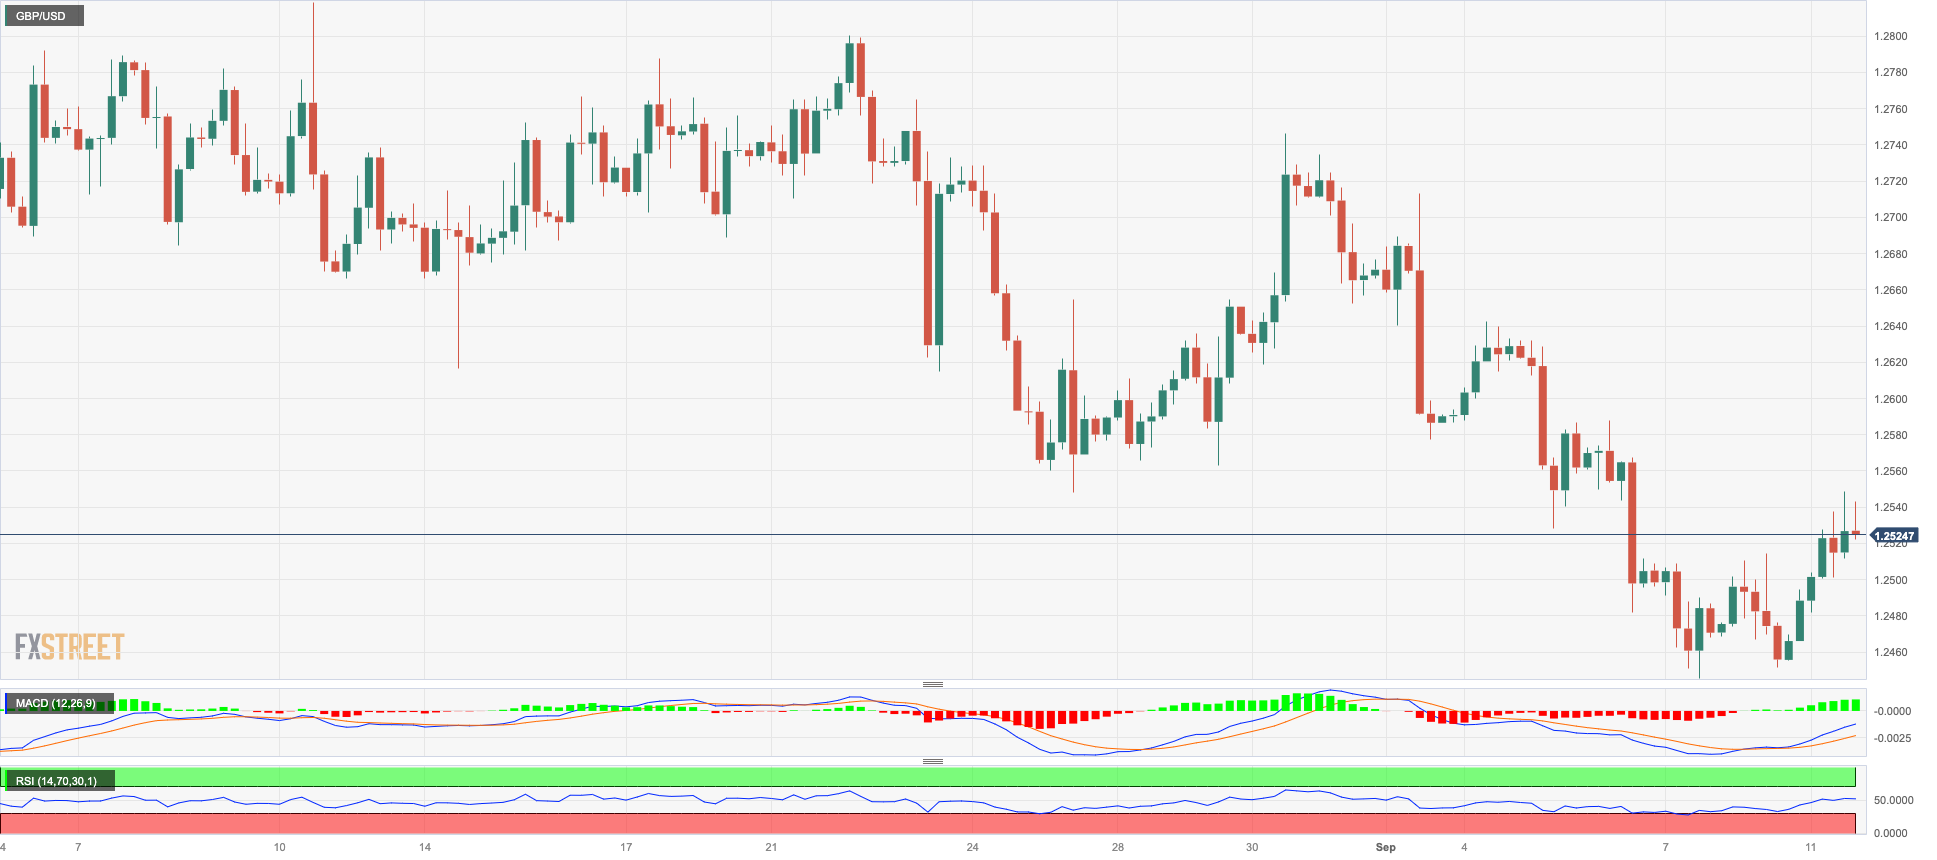
In line with the rest of its risk-associated peers, the British pound regained its smile and prompted GBP/USD to leave behind four consecutive daily pullbacks at the beginning of the week.
Indeed, Cable managed to grab some fresh upside traction and climbed to three-day peaks near 1.2550 on the back of the pronounced retracement in the greenback on Monday.
The UK calendar was empty on Monday.
If GBP/USD continues to fall, the next support is at the September low of 1.2445 (September 7), followed by the important 200-day SMA at 1.2426, a region also propped up by the 2021-2023 trendline. If this zone is breached, the June low at 1.2368 (June 5) could be reached before the May low at 1.2308 (May 25). Cable, on the other hand, could reclaim the interim 100-day SMA at 1.2653 before the weekly high at 1.2746 (August 30), which seems to be bolstered by the 55-day SMA. North of this, the weekly highs are at 1.2818 (August 10) and 1.2995 (July 27), just ahead of the psychological barrier at 1.3000. The daily RSI leapt to the vicinity of 41.
Resistance levels: 1.2547 1.2587 1.2642 (4H chart)
Support levels: 1.2445 1.2368 1.2308 (4H chart)
AUDUSD
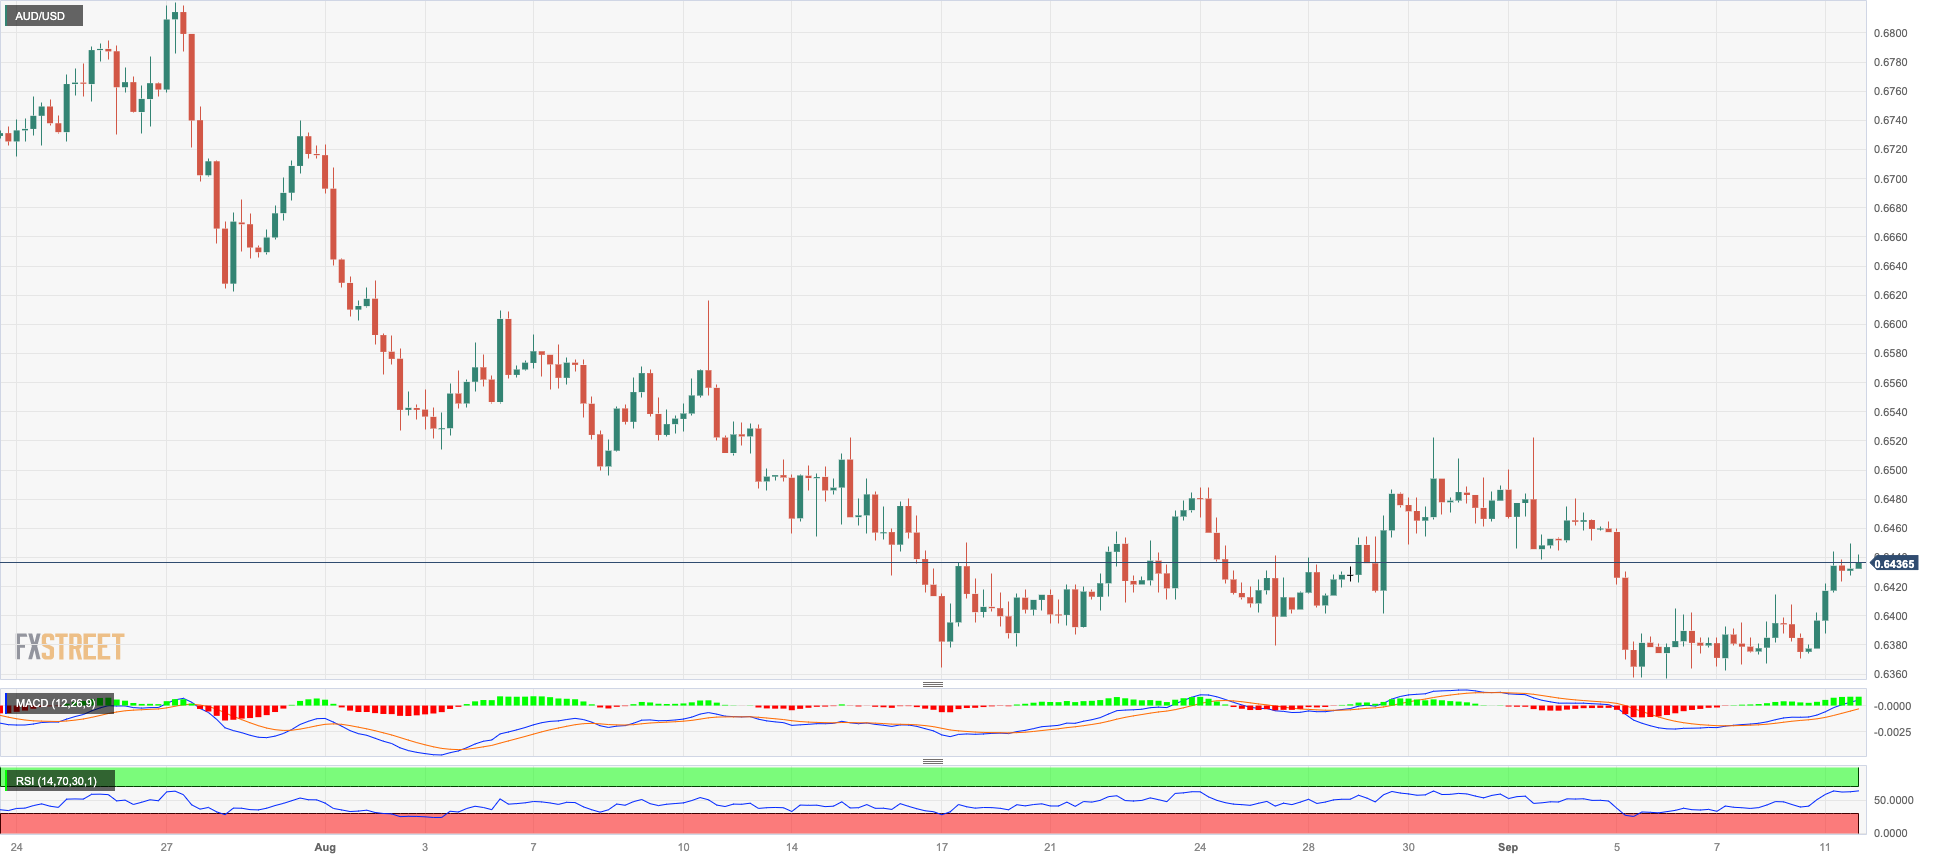
AUD/USD saw its upside momentum suddenly revitalized in response to the marked selling bias in the greenback along with the reinvigorated upbeat mood in the risk-linked galaxy on Monday.
In addition, the broad-based change of heart in the commodity universe (with the exception of a small decline in the price of a tonne of iron ore) also contributed to the firm performance of the Aussie dollar.
Adding to the above appeared some hopes regarding the economic recovery in China, particularly following earlier results from the Chinese docket.
Next of note in the Australian calendar will be the release of the Consumer Confidence index gauged by Westpac.
Immediately on the downside for AUD /USD, the 2023 low appears at 0.6357 (5 September) ahead of the November 2022 low at 0.6272 (7 November) and the 2022 low at 0.6179 (13 October). On the flip side, Spot faces immediate resistance at the weekly high of 0.6522 (30 August), followed by another weekly high of 0.6616 (10 August). Above this level, the pair could target the 200-day line SMA at 0.6711 before reaching the July high of 0.6894 (July 14) and the June high of 0.6899 (June 16). The critical level of 0.7000 is below the weekly high of 0.7029 (Feb 14) and the 2023 high of 0.7157 (Feb 2). The daily RSI has settled below the 36 level.
Resistance levels: 0.6449 0.6496 0.6521 (4H chart)
Support levels: 0.6357 0.6272 0.6210 (4H chart)
GOLD
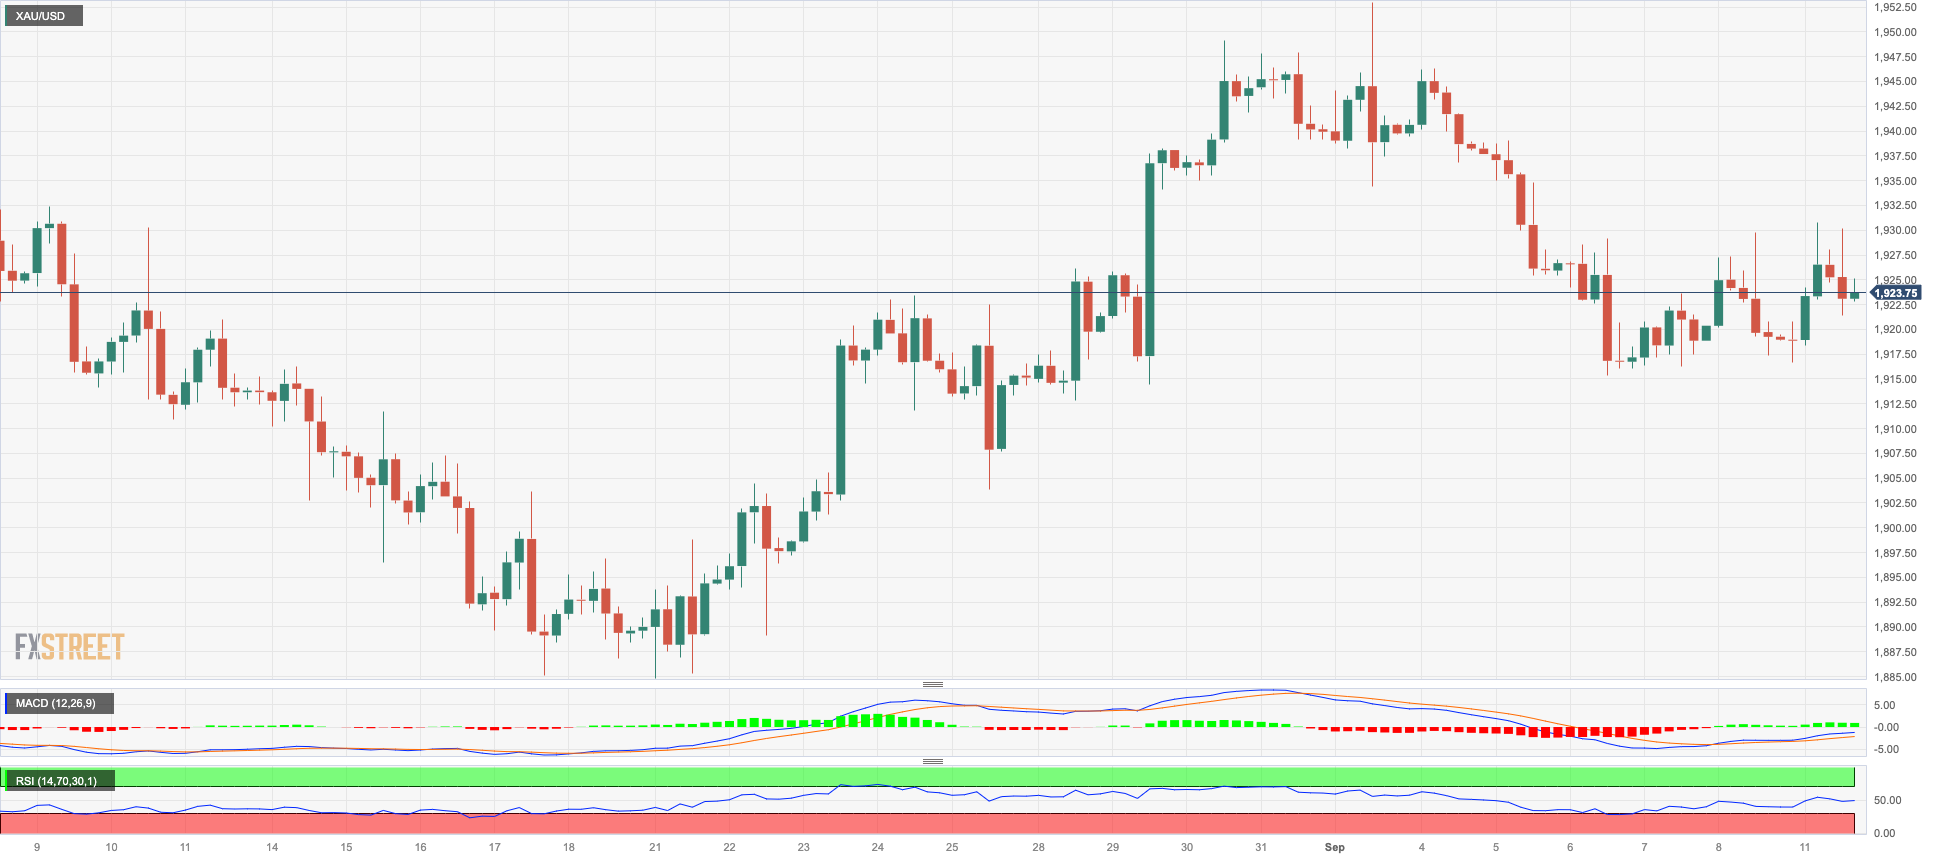
Prices of gold extended the erratic performance and gyrated around the $1920 region per troy ounce at the beginning of the week.
Price action around the yellow metal came amidst the strong correction in the greenback following last week’s multi-week tops when tracked by the USD Index (DXY), while the mixed tone in US yields across different timeframes also propped up the metal.
Moving forward, bullion is expected to closely follow the release of US inflation figures (September 13) ahead of the FOMC gathering on September 20.
A further drop may send gold down to the $1900 level before reaching the August low of $1884 and the 2023 low of $1804 (February 28), all of which are ahead of the critical $1800 support. Aside from that, the 100-day SMA appears to be holding the September high of $1953 (September 1). A breakout of this zone might result in a visit to the July top of $1987 (July 20), which is just shy of the psychological $2000 yardstick. Breaking out of this range might open the way for an assault on the 2023 peak of $2067 (May 4), then the 2022 high of $2070 (March 8) and the all-time top of $2075 (August 7, 2020).
Resistance levels: $1930 $1953 $1972 (4H chart)
Support levels: $1915 $1903 $1884 (4H chart)
CRUDE WTI
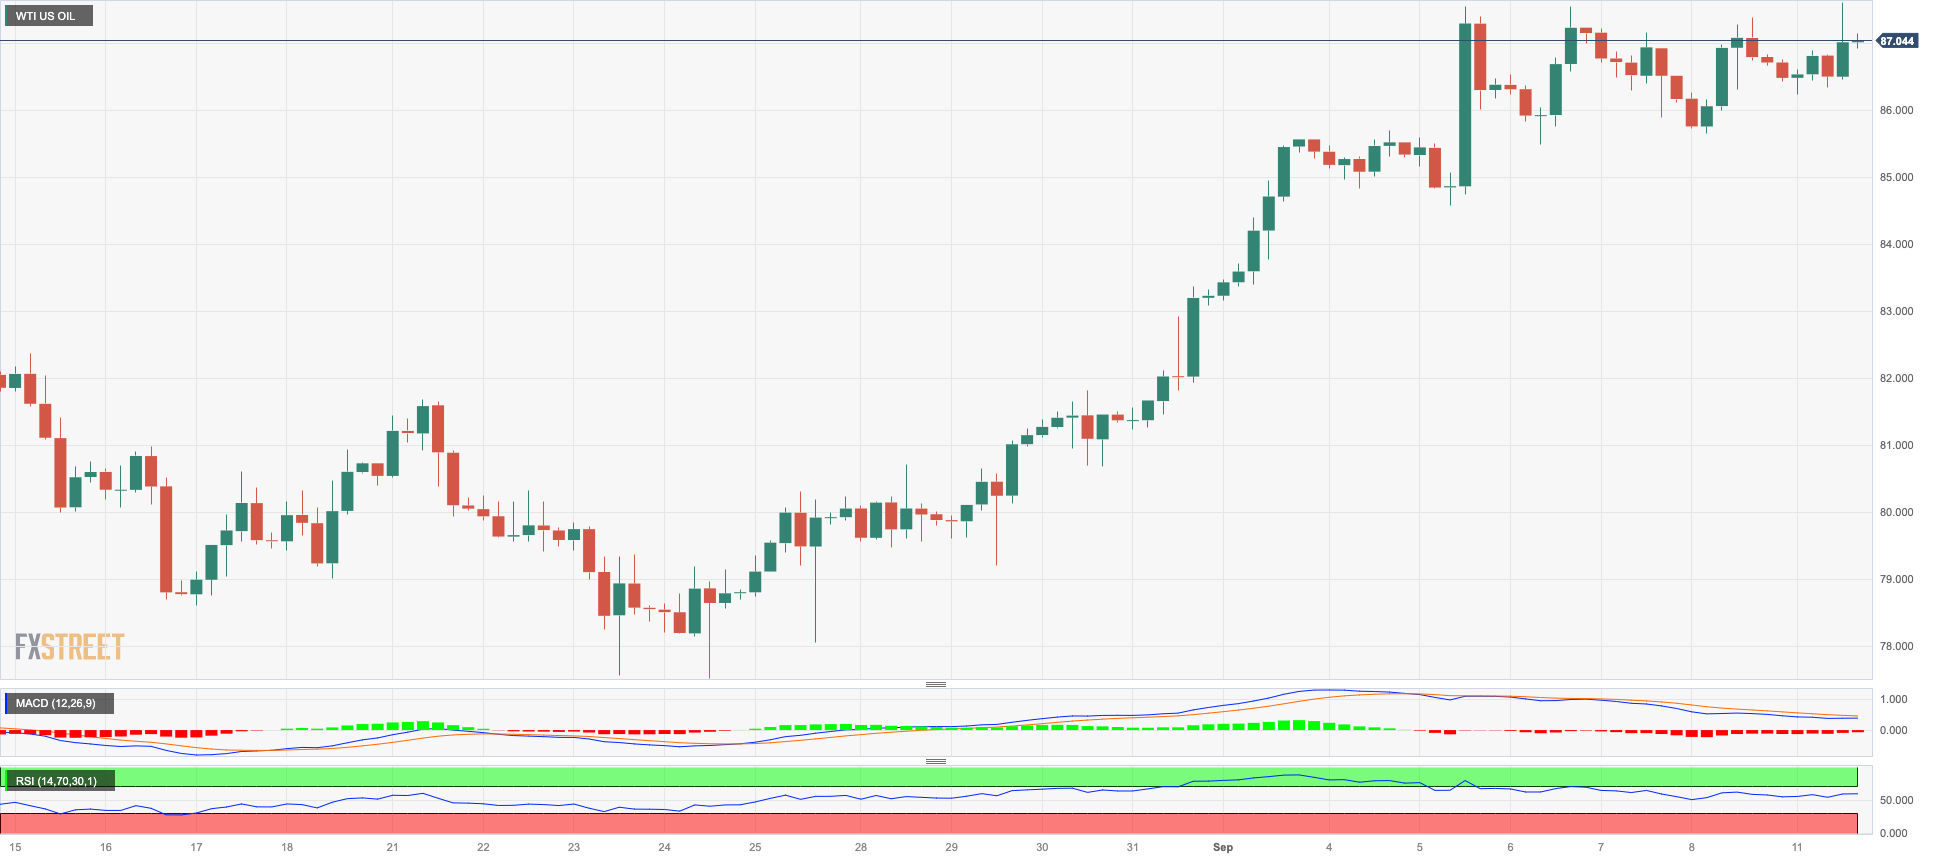
Prices of the American benchmark for sweet light crude oil added to Friday’s decent uptick and reached new 2023 peaks around $88.10 per barrel on Monday.
This time, supply concerns appeared to have come to the fore as investors continued to assess the oil output cuts from Saudi Arabia and Russia’s reduction of crude oil exports, while supply disruptions in Libya also added to the narrative.
Adding to the upside bias in the commodity also emerged the corrective retracement in the greenback as well as the broad perception that the Federal Reserve might be done with rate hikes.
Of note is that further upside in prices of the commodity came in line with a sharp increase in net longs in WTI to levels last seen in late June 2022 near 300K contracts, as per the latest CFTC Positioning Report for the week ended on September 5.
As usual, the API and the EIA will report on US crude oil inventories for the week ended September 8 on Tuesday and Wednesday, respectively.
If the rally continues and WTI breaks through the 2023 high of $88.11 (September 11), the round $90.00 level appears to be the next hurdle to the upside, followed by the November 2022 top of $93.73 (November 7) and the weekly peak of $97.65 (August 30, 2022), all before the critical $100.00 mark per barrel. On the other hand, there is an interim contention at the 55-day SMA at $79.00 ahead of the August low of $77.64 (August 24) and the key 200-day SMA of $76.28. A breach of this level might lead to a retest of the weekly lows of $73.89 (July 17) and $66.86 (June 12), both of which are ahead of the 2023 low of $63.61 (May 4). The low for December 2021 is $62.46 (December 2), which is just above the important $60.00 level.
Resistance levels: $88.11 $88.65 $93.73 (4H chart)
Support levels: $86.12 $84.99 $82.12 (4H chart)
GER40
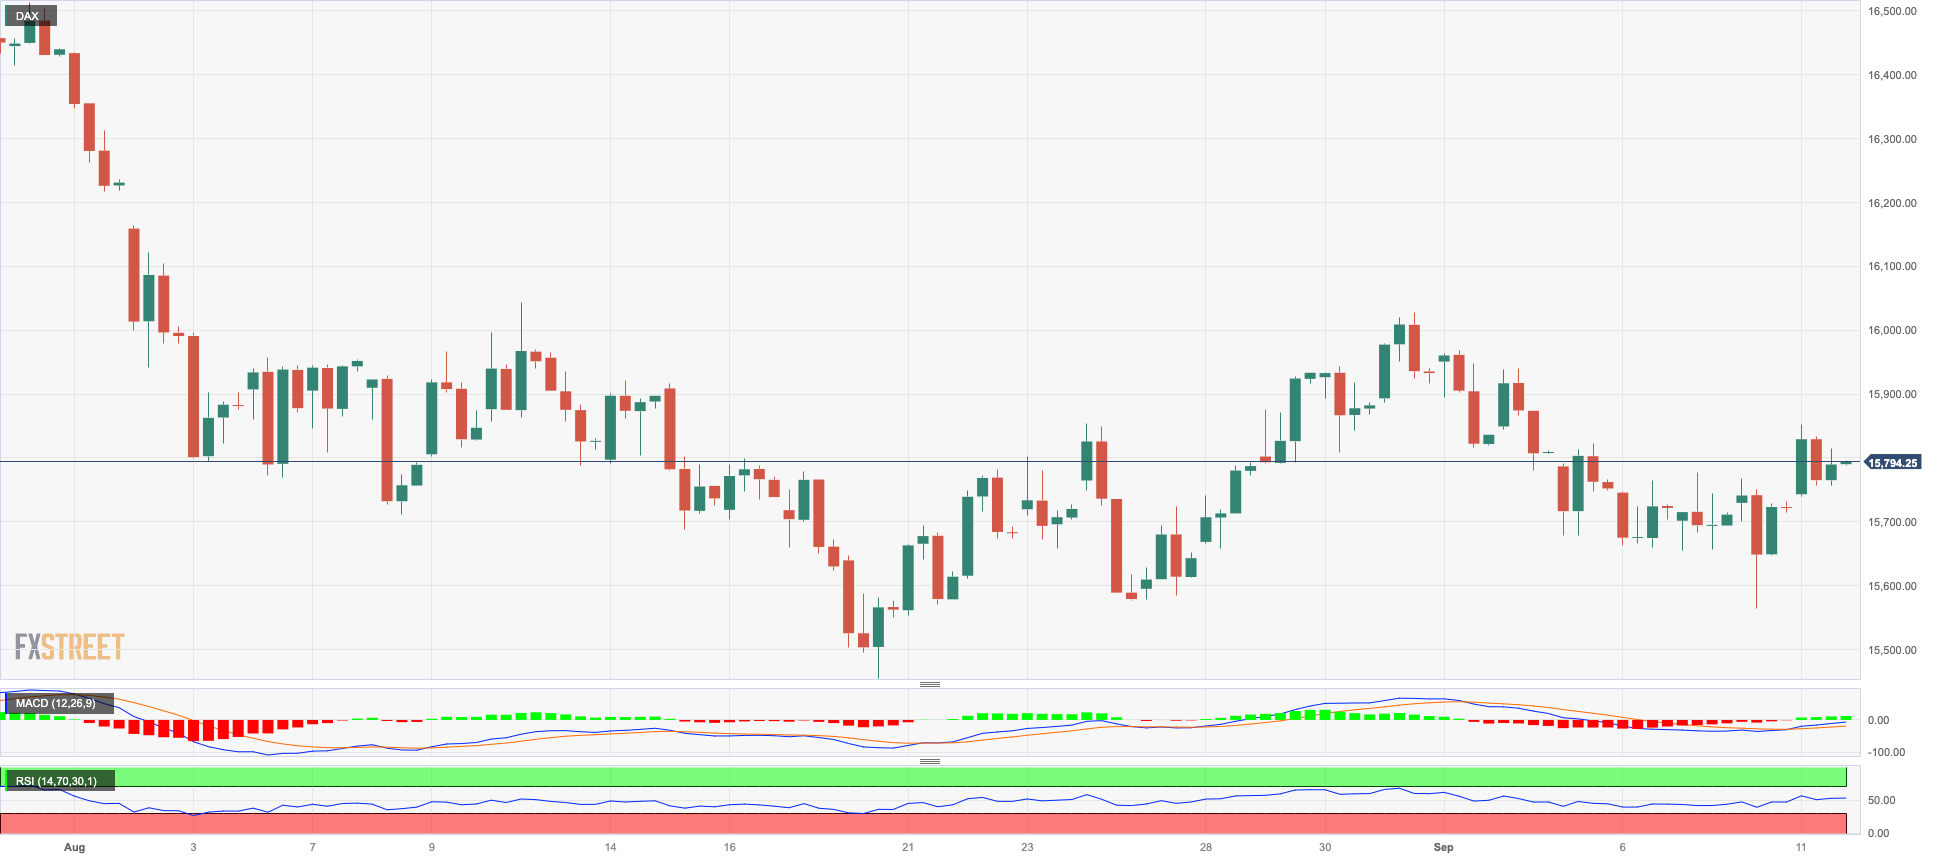
The German benchmark DAX40 added to Friday’s gains and regained the 15800 region at the beginning of the week.
The slight improvement in the index came despite the fact that the European Commission expects economic growth in the region to lose traction this year and next, while Germany is seen entering recession.
In addition, investors kept a prudent stance prior to the release of US CPI on September 13 and the ECB interest rate decision on September 14, which is expected to be a close call amidst a pretty divided Council.
In the German money market, the 10-year bund yield reversed two daily pullbacks in a row and revisited the 2.65% zone on Monday.
Further DAX40 losses are now aimed at the August low of 15468 (August 18), which seems to be supported by the 200-day SMA (15489) and is slightly ahead of the July low of 15456 (July 7). If the index falls below this level, it could dispute the March low of 14458 (March 20) prior to the December 2022 low of 13791 (December 20) and the 2022 low of 11862 (September 28). In reverse order, there is a temporary barrier at the 55-day SMA at 15924 ahead of the weekly highs of 16042 (August 31) and 16060 (August 10). A break above the latter could refocus investors' attention on a possible challenge of the all-time top of 16528 (July 31). The RSI improved slightly above the 48 mark.
Best Performers: Vonovia, Covestro, Commerzbank, Rheinmetall AG
Worst Performers: MTU Aero, Sartorius AG VZO, SAP
Resistance levels: 15867 16042 16060 (4H chart)
Support levels: 15577 15468 15456 (4H chart)
NASDAQ
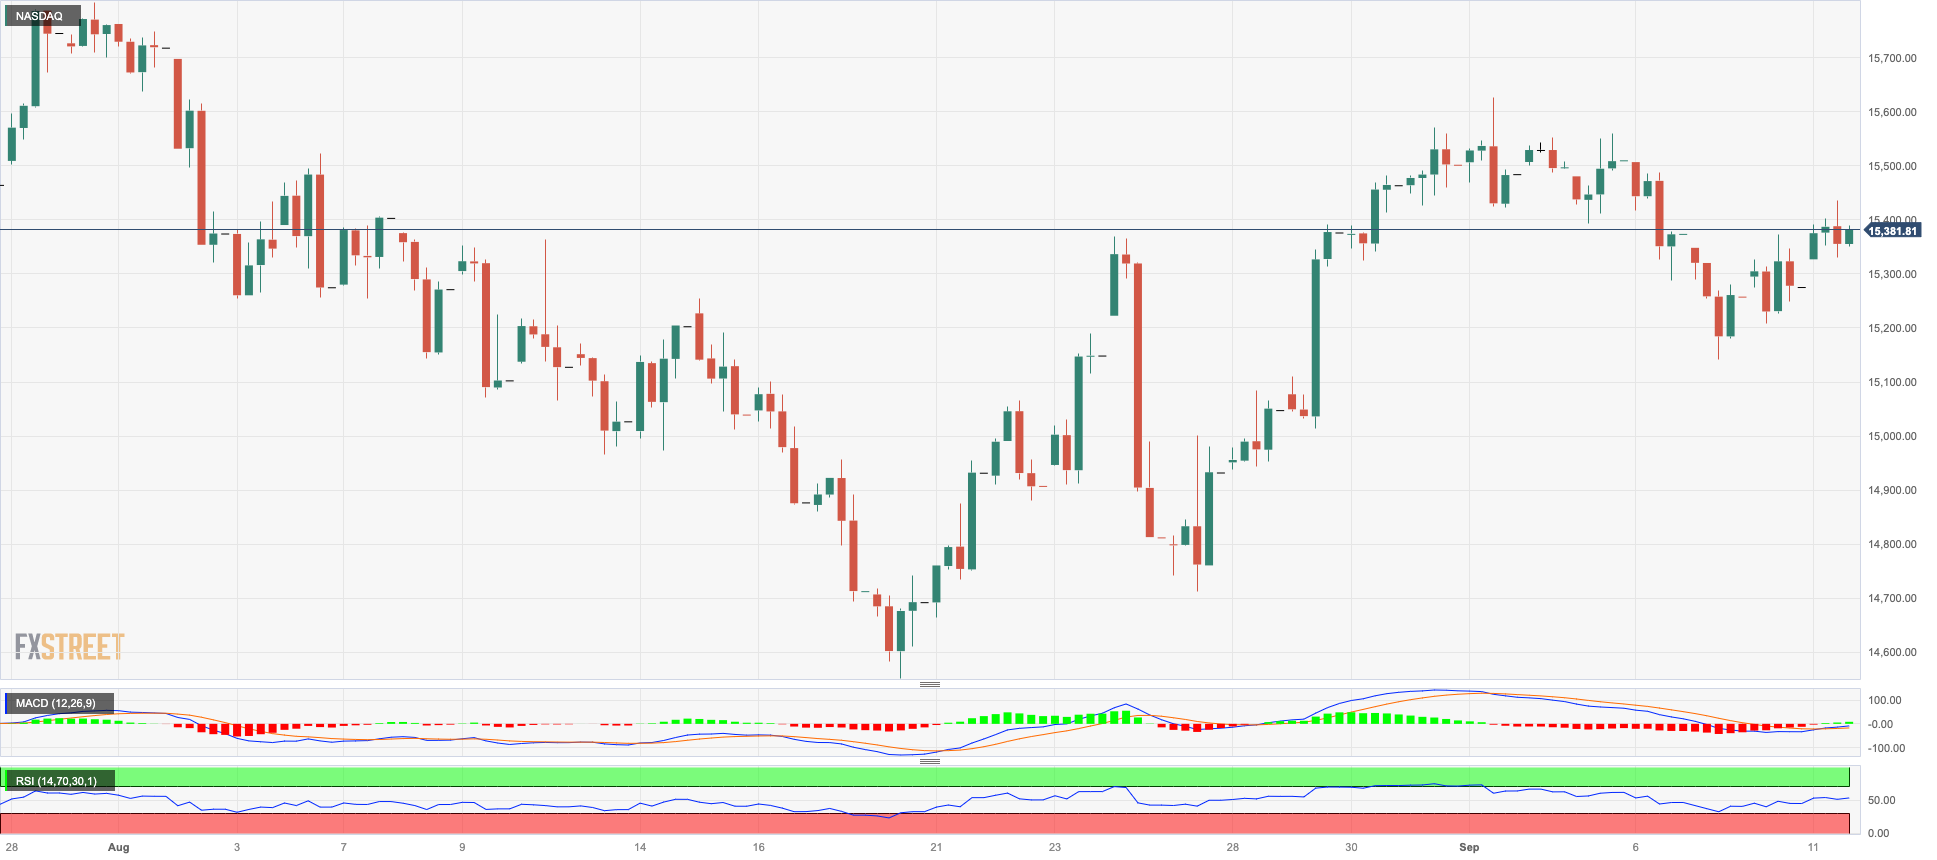
The optimism around the US tech sector remained well in place on Monday and lifted the reference Nasdaq 100 to three-day highs past the 15400 level.
The sell-off in the greenback and the mixed developments from the US bond markets sustained the upbeat mood among investors, which was also helped by the outperformance of EV maker Tesla.
If the recovery gathers extra impulse, the Nasdaq 100 should meet the next hurdle at the September high of 15618 (September 1) before the weekly top of 15803 (July 31). North of this is the 2023 peak at 15932 (July 19), which is followed by the round mark of 16000. Just the opposite, there is a minor weekly bottom at 14715 (August 25), which appears to be supported by the proximity of the 100-day SMA and comes before the August low of 14557 (August 18). If this level is breached, the weekly lows of 14283 (June 7) and 13520 (May 24) will be reintroduced before the 200-day SMA of 1330. On a daily basis, the RSI increased past the 54 yardstick.
Top Gainers: Tesla, Qualcomm, Charter Communications
Top Losers: Moderna, AMD, AstraZeneca ADR
Resistance levels: 15432 15618 15795 (4H chart)
Support levels: 15138 14715 14557 (4H chart)
DOW JONES
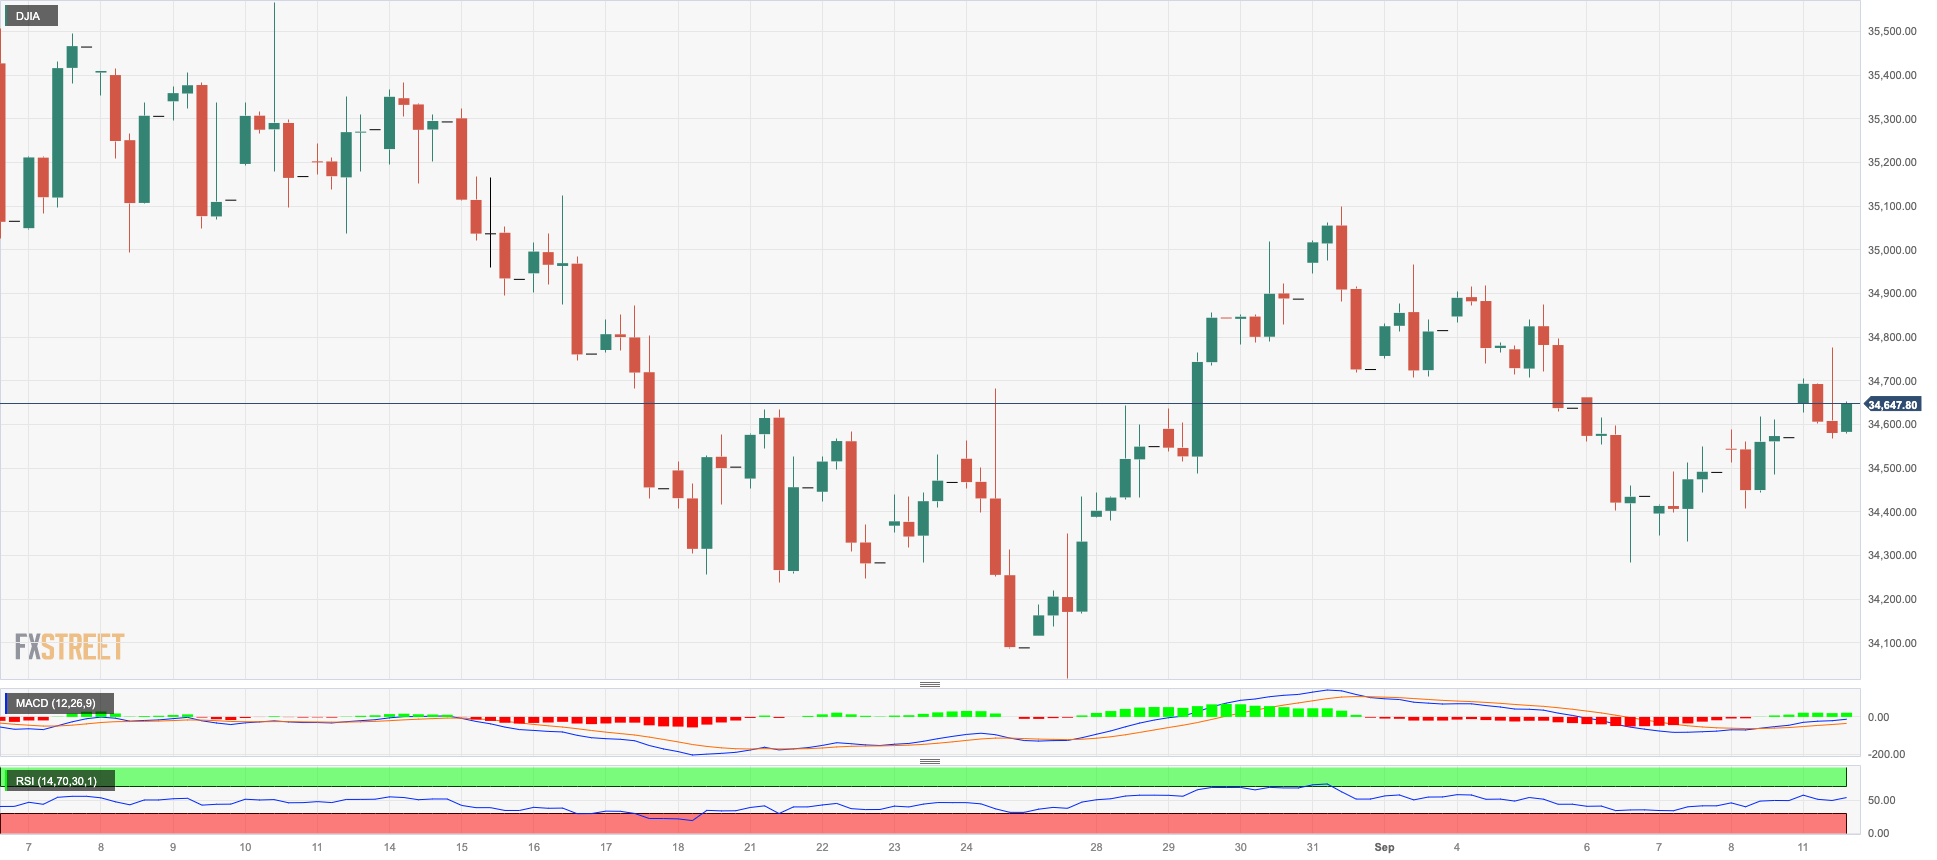
US stocks measured by the Dow Jones reached fresh four-day highs near the 34800 region earlier on Monday, although that bullish attempt fizzled out towards the end of the session on Wall Street.
In fact, investors remained cautious ahead of the release of US inflation figures tracked by the CPI later in the week as well as the FOMC gathering due on September 20, where the Fed is largely anticipated to keep rates unchanged.
On the whole, the Dow Jones gained 0.19% to 34642, the S&P500 rose 0.47% to 4478, and the tech-focused Nasdaq Composite advanced 0.70% to 13857.
Immediately to the upside for the Dow Jones aligns the weekly high of 35070 (August 31), seconded by the 2023 top of 35679 (August 1) and the February 2022 peak of 35824 (February 9). The breakout from the latter could open the door to the all-time high of 36952 (January 5, 2022). By contrast, if the index falls below the August low of 34029 (August 25), it could return to the 200-day SMA at 33794, ahead of the July low of 33705 (July 10). The May low of 32586 (May 25) comes next prior to the 2023 low of 31429 (March 15). The everyday RSI climbed to the vicinity of the 50 threshold.
Top Performers: Verizon, 3M, Procter&Gamble
Worst Performers: Walgreen Boots, Chevron, Boeing
Resistance levels: 34784 35070 35578 (4H chart)
Support levels: 34291 34029 33705 (4H chart)
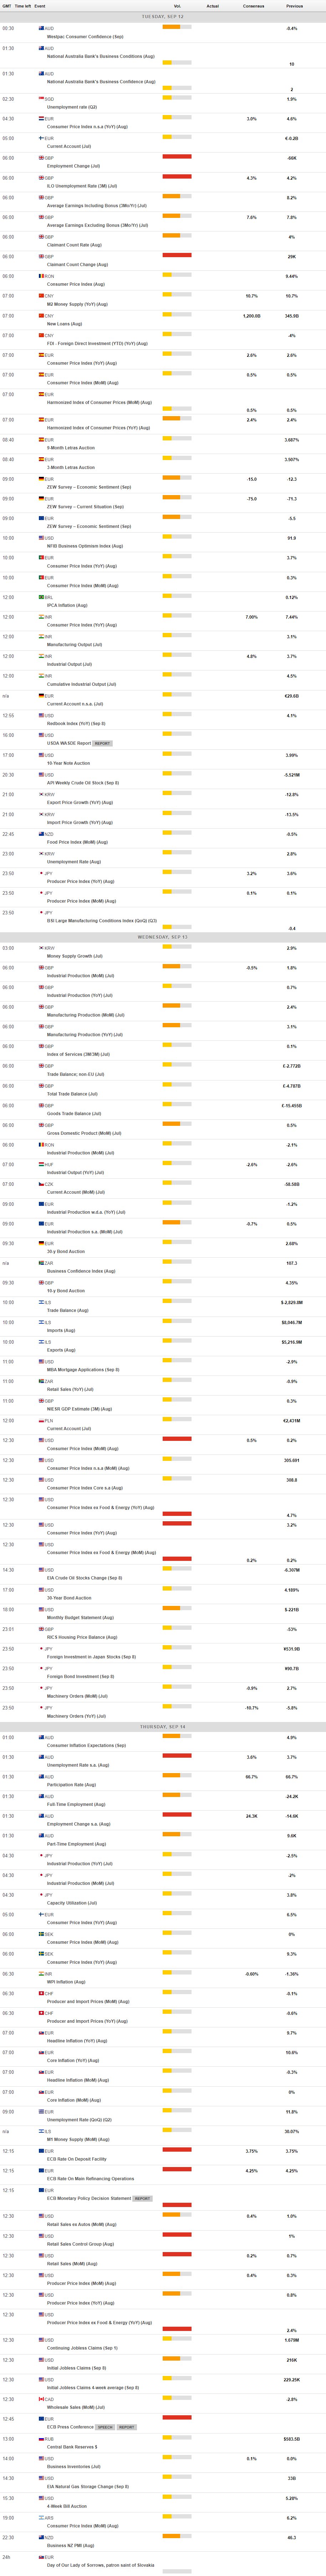
MACROECONOMIC EVENTS
All Information & Updates provided by:

All information relating to the financial markets available on this page has been prepared and issued by FXStreet (Forexstreet SL, Spain, Reg: B62498233) on the basis of publicly available information and all information believed to be reliable and does not conflict with Kuwaiti local laws, and all necessary care has been taken to before the company to ensure that the facts mentioned are correct from the source.
NCM Investment nor any of its directors or employees shall in any way be held responsible for the contents of this news, and the information contained on this page is intended only to provide clients with publicly available information and should not be construed as investment advice, report or analysis and/or constitute an offer or invitation to buy or sell financial instruments of any kind.
RISK WARNING: Forex and CFDs are highly risky leveraged products, as losses can exceed deposits. Please ensure you understand all the risks and take independent advice if necessary. NCM will segregate the clients based on the criteria of the regulator and its bylaws. NCM does not provide any advisory service; the material published does not constitute advice or a recommendation for a transaction in any financial instrument. NCM accepts no responsibility for any use of the content presented and any consequences of that use. Anyone acting on the information provided does so at their own risk.