
- Contact Us:
-

-

-

-


Daily Market Updates
13 Sep 2023
USDJPY
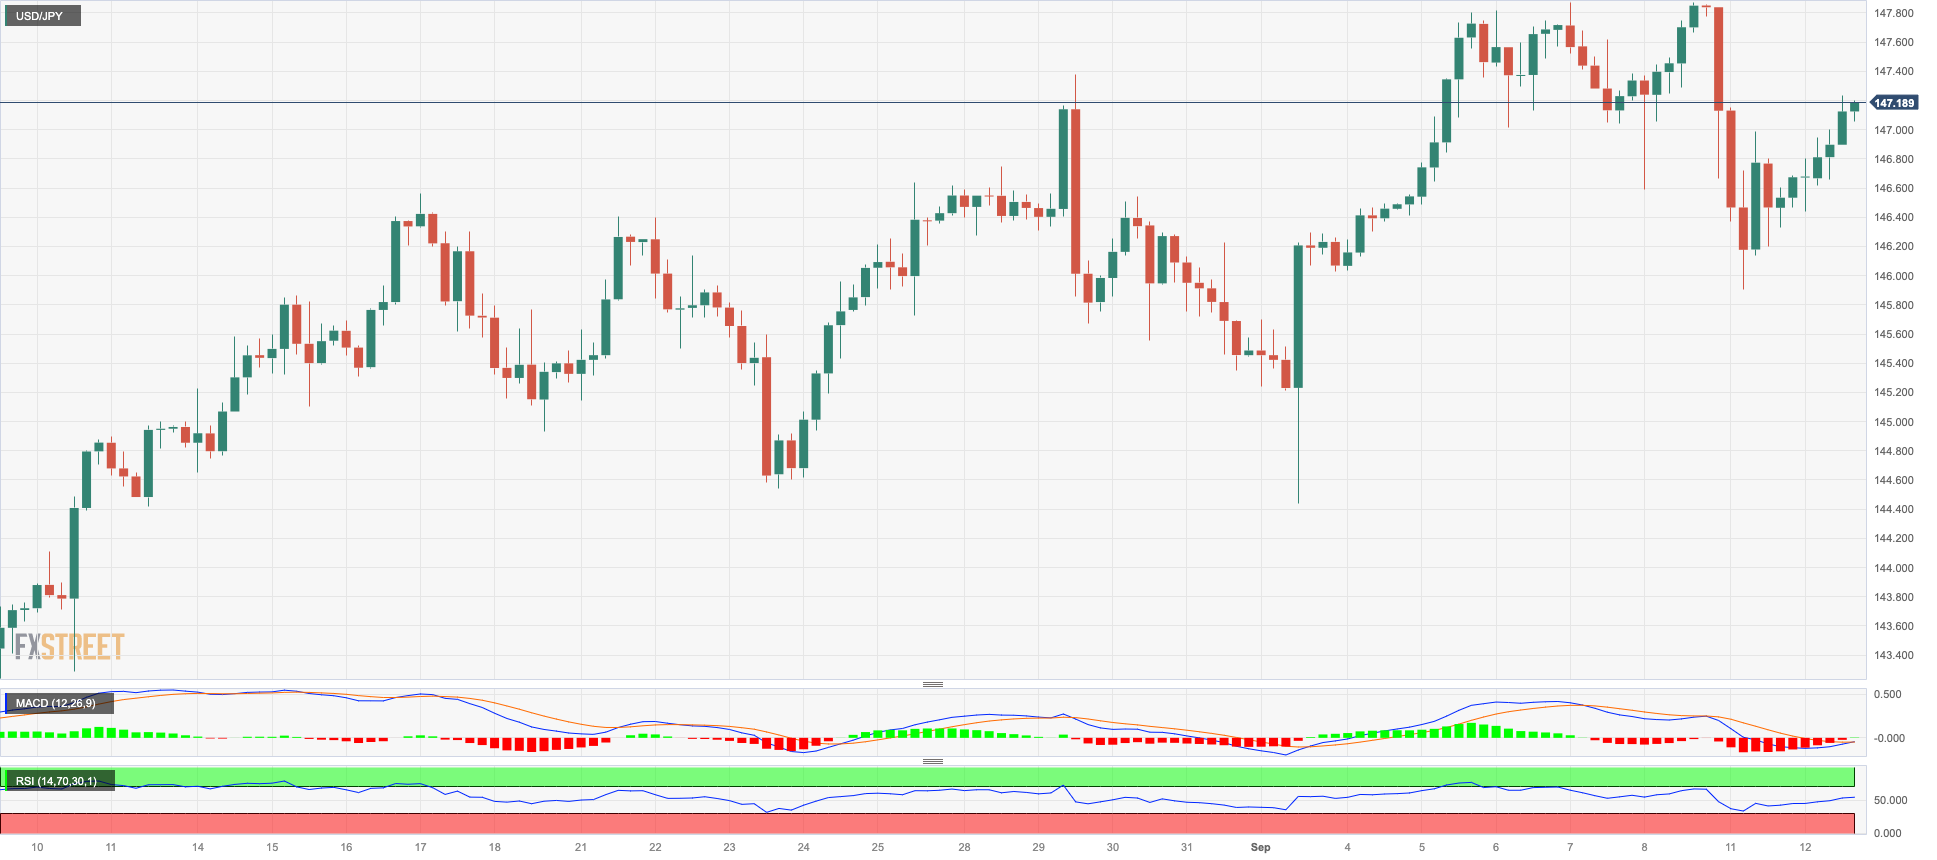
The better tone in the greenback helped USD/JPY resume the upward bias and regain the 147.00 hurdle and beyond on turnaround Tuesday.
In the meantime, the small uptick in yields in the short end of the US curve appears to have also lent wings to the pair’s upside momentum.
Of note, however, is that the JGB 10-year yields surpassed the 0.70% yardstick for the first time since early January 2014.
There were no data releases scheduled in the Japanese docket on Tuesday.
If USD/JPY breaks above the 2023 high of 147.87 (September 7), it will most likely face the 2022 top of 151.95 (October 21). On the downside, the September low of 144.43 (September 1) takes precedence over the interim 55-day SMA of 143.70 and the August low of 141.50 (August 7). If this level is breached, the pair could target the weekly low of 138.05 (July 28) seconded by the July low of 137.23 (July 13), which looks underpinned by the 200-day SMA at 137.16. A lower retracement could put the weekly low of 133.01 (April 26) and the smaller levels of 132.01 (April 13) and 130.62 (April 5) in danger. On the daily chart, the RSI improved to the 59 zone.
Resistance levels: 147.87 148.45 148.84 (4H chart)
Support levels: 145.89 144.98 144.43 (4H chart)
GBPUSD
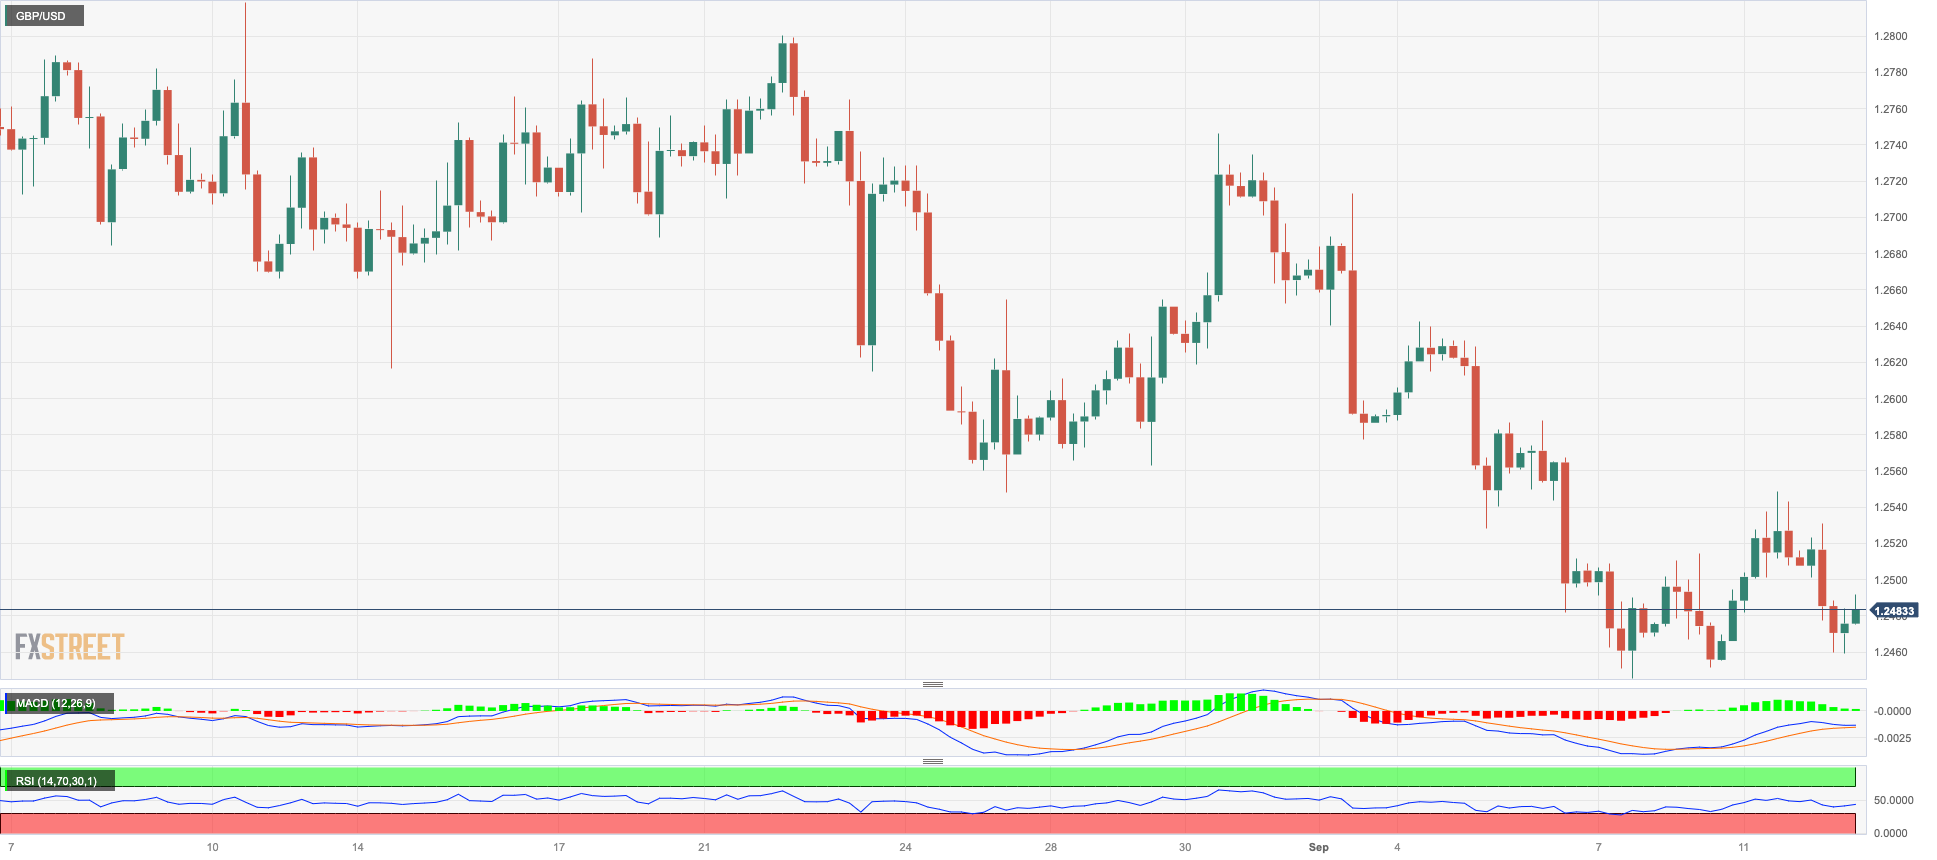
GBP/USD resumed the downside following Monday’s positive session, breaking below the 1.2500 support once again on Tuesday.
The resumption of buying interest in the greenback put the sterling and the rest of the risk complex under pressure, motivating Cable to refocus its attention to the downside and a potential revisit to the area of monthly lows in the mid-1.2400s.
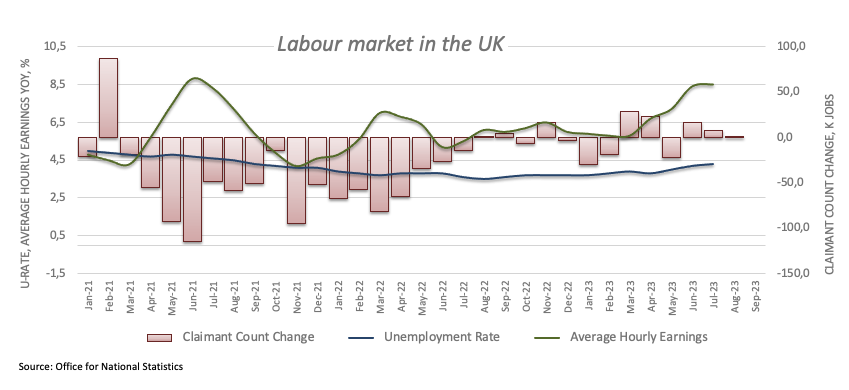
The British pound derived extra selling pressure from the mixed results from the UK jobs report, where the jobless rate ticked higher to 4.3% in July, the Employment Change shrank by 207K individuals in June, and the Average Earnings inc. Bonus rose 8.5% in the year to July.
In the meantime, investors continue to see the BoE hiking its policy rate by 25 bps at its September 21 meeting and a subsequent pause at the November 2 event.
If GBP/USD falls further, the next level of support is at the September low of 1.2445 (September 7), followed by the 200-day SMA at 1.2428, which is also supported by the proximity of the 2021-2023 trendline just above the 1.2400 mark. If this zone is broken, the June low of 1.2368 (June 5) may be hit before the May low of 1.2308 (May 25). Cable, on the other hand, has the potential to retake the intermediate 100-day SMA at 1.2654 before the weekly high at 1.2746 (August 30), which appears to be supported by the 55-day SMA (1.2743). The weekly tops north of this are at 1.2818 (August 10) and 1.2995 (July 27), barely ahead of the psychological barrier at 1.3000. The daily RSI eased to the sub-37 area.
Resistance levels: 1.2548 1.2587 1.2642 (4H chart)
Support levels: 1.2445 1.2368 1.2308 (4H chart)
AUDUSD
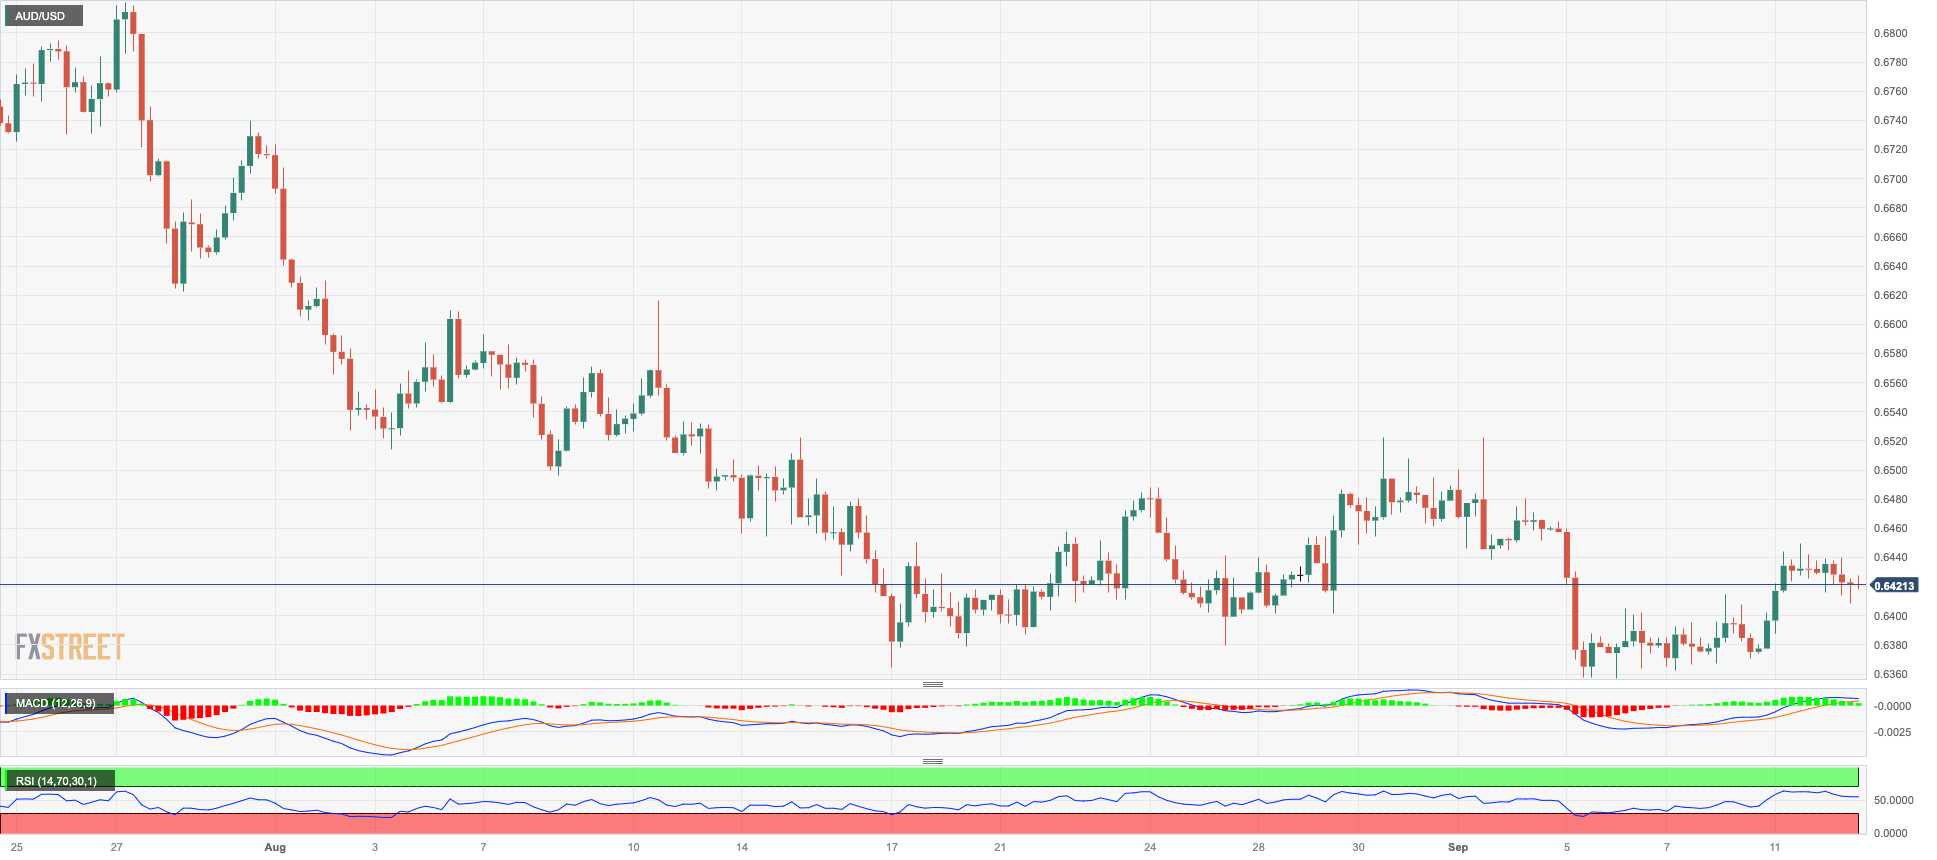
Following Monday’s strong advance, AUD/USD faced renewed upside pressure from the greenback and ended Tuesday’s session with modest losses in the 0.6420 region.
Extra selling interest hurt the Aussie dollar in response to the generalized downbeat tone in the commodity space, while the downtick in Australia’s Consumer Confidence gauged by Westpac for the month of September (79.7) also helped with the downside.
Immediately to the downside for the AUD/USD appears the 2023 low at 0.6357 (September 5), seconded by the November 2022 bottom at 0.6272 (November 7) and the 2022 low at 0.6179 (October 13). The pair, on the other hand, confronts immediate resistance at the weekly high of 0.6522 (August 30), prior to another weekly top of 0.6616 (August 10) and the 200-day SMA at 0.6708. Extra gains could see the July peak of 0.6894 (July 14) revisited ahead of the June high of 0.6899 (June 16). The crucial level of 0.7000 comes next before the weekly top of 0.7029 (February 14) and the 2023 high of 0.7157 (February 2). The daily RSI slipped back to the vicinity of 43.
Resistance levels: 0.6449 0.6485 0.6521 (4H chart)
Support levels: 0.6357 0.6272 0.6210 (4H chart)
GOLD
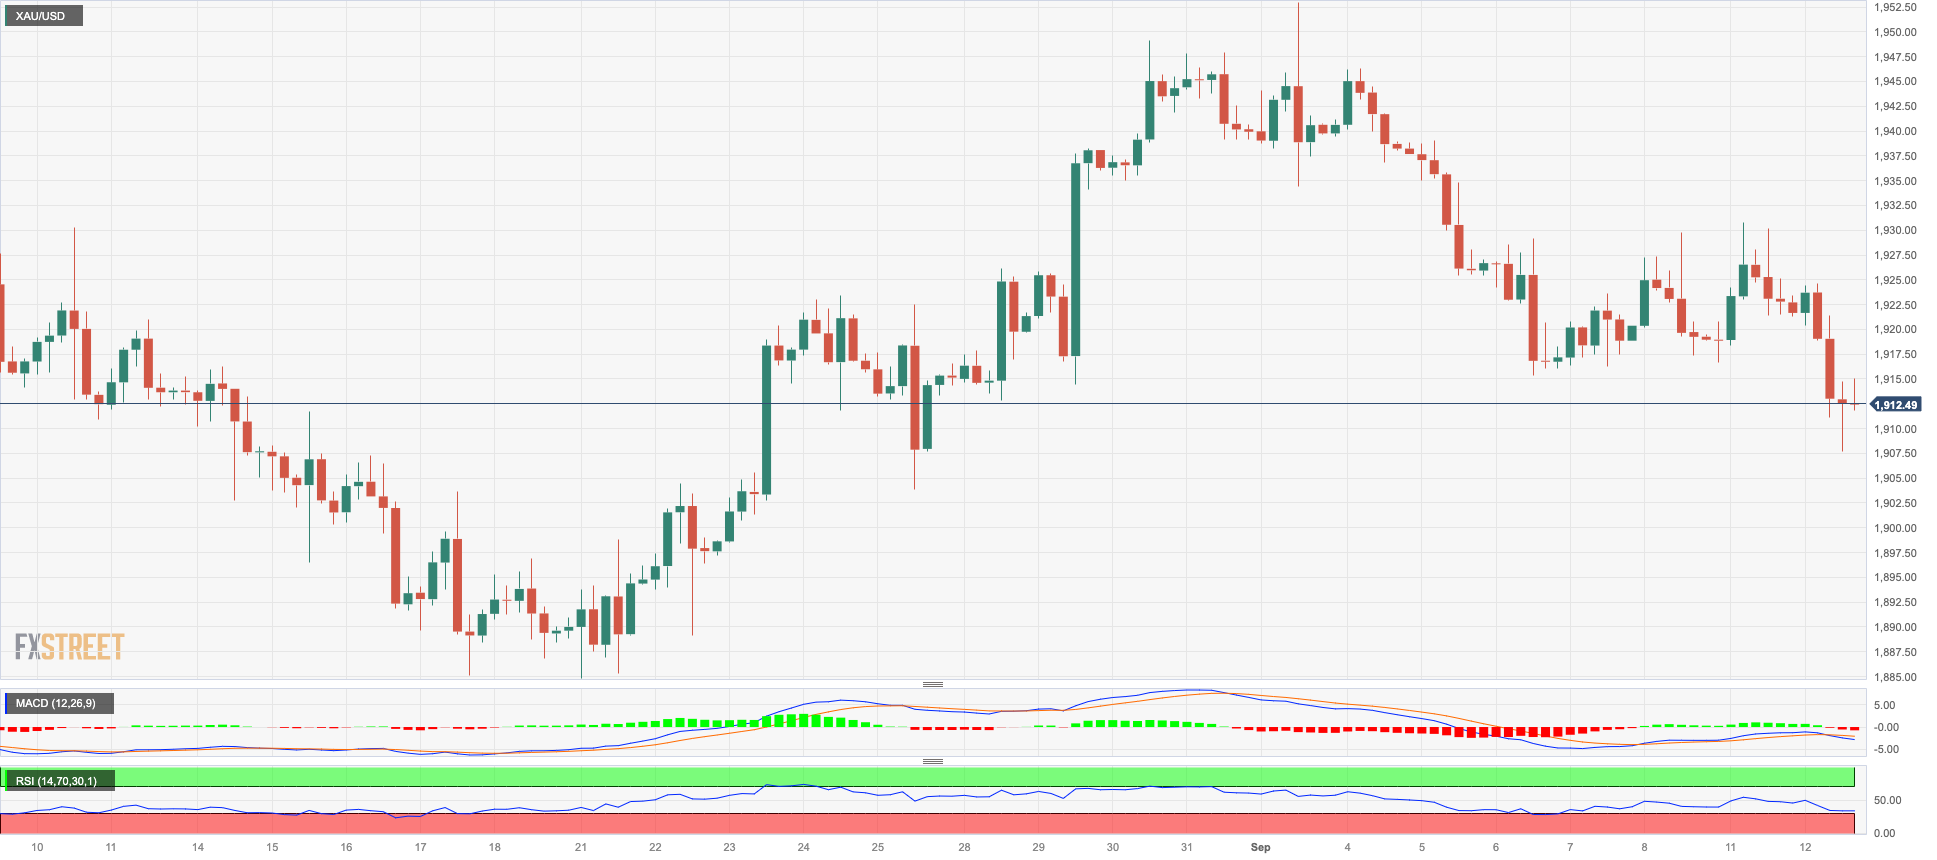
Gold prices suffered from the strong rebound in the greenback and revisited the proximity of the key contention area around the $1900 mark per troy ounce on Tuesday.
Further weakness for the yellow metal emerged from the small advance in US 2-year yields vs. the absence of traction in the belly and the long end of the curve.
Looking ahead, it is anticipated that bullion will closely track the release of US inflation data on September 13, leading up to the FOMC meeting on September 20. During this meeting, it is widely expected that the Committee will maintain the current interest rates without making any changes.
A further decline could push gold back to the $1900 level before reaching the August low of $1885 (August 17) and the 2023 low of $1804 (February 28), all ahead of the critical $1800 support. Apart from that, the 100-day SMA seems to be holding the September high of $1953 (September 1). A breakout from this zone could lead to a visit to the July top of $1987 (July 20), which is just below the psychological $2000 level. A breakout from this range could pave the way for a challenge of the 2023 peak of $2067 (May 4), then the 2022 high of $2070 (March 8) and the all-time top of $2075 (August 7, 2020).
Resistance levels: $1930 $1953 $1972 (4H chart)
Support levels: $1907 $1903 $1884 (4H chart)
CRUDE WTI
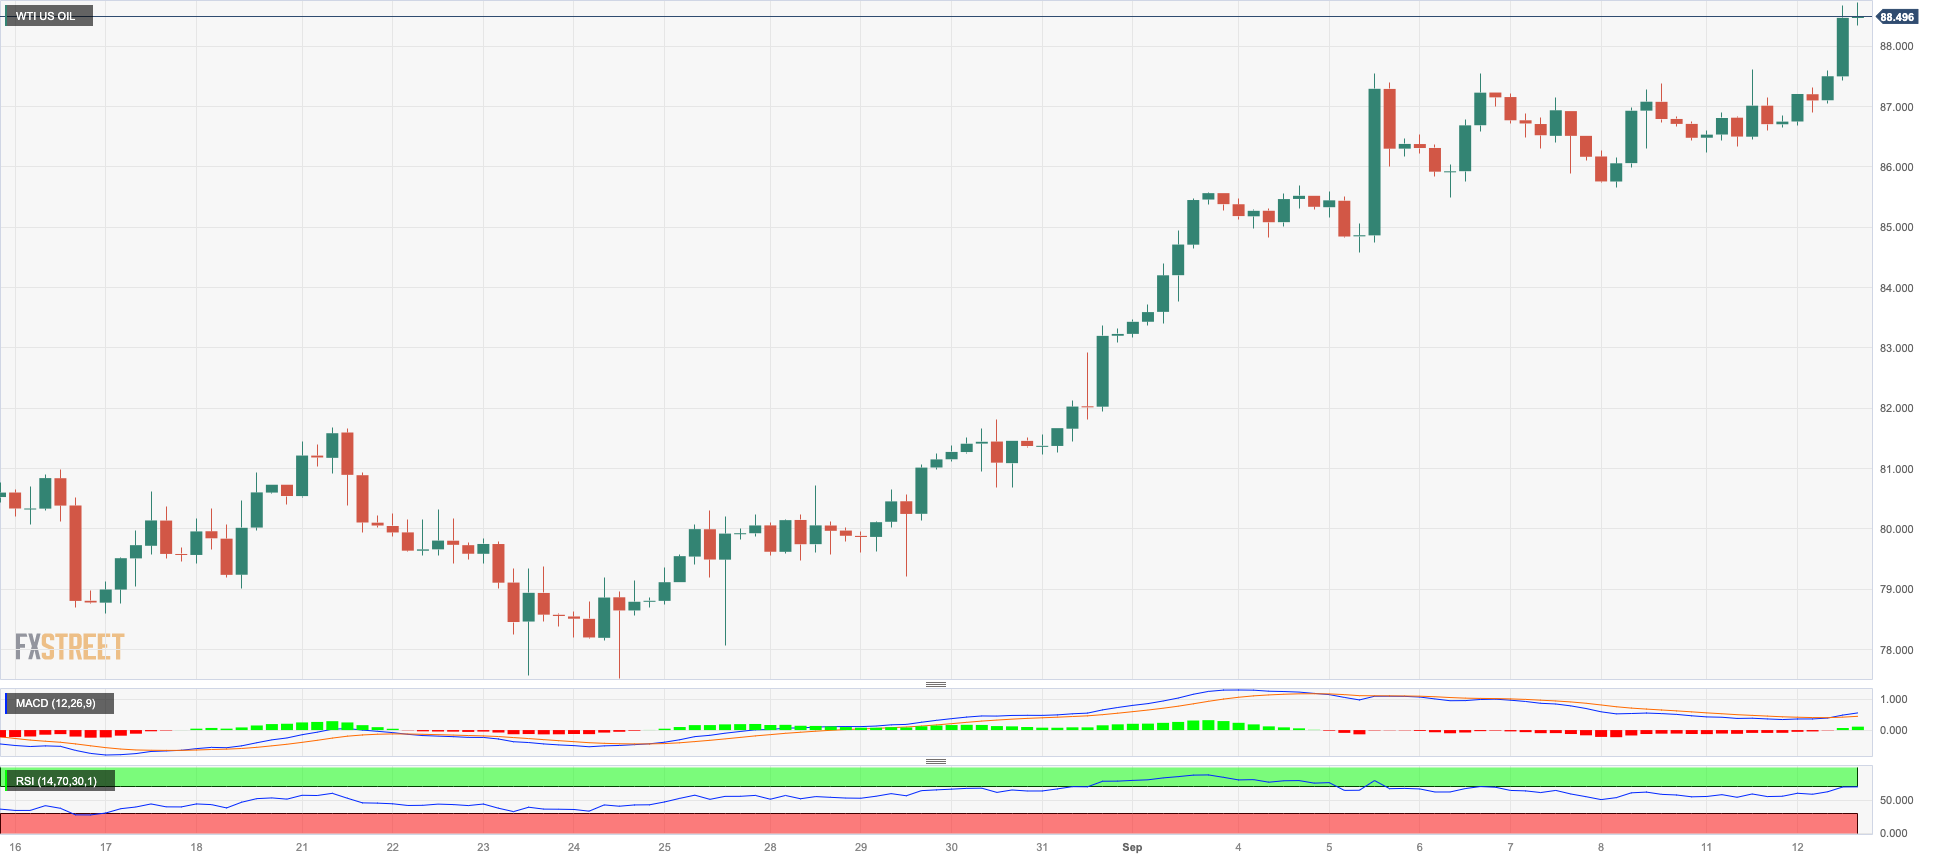
WTI prices advanced further and approached the key $90.00 mark per barrel for the first time since November 2022 on Tuesday.
The strong gains in crude oil prices came in response to the upbeat assessment from OPEC, which sees stronger demand for the commodity this year and next.
In the meantime, the tight supply narrative remained underpinned by the oil output cuts by Saudi Arabia, the reduction of Russian crude oil exports, and weather-driven disruptions in Libya.
In light of the recent price action in WTI, the round $90.00 level appears to be the next hurdle to the upside, followed by the November 2022 top of $93.73 (November 7) and the weekly high of $97.65 (August 30, 2022), all before the critical $100.00 mark per barrel. On the other hand, the 55-day SMA at $79.38 emerges as the initial support ahead of the August low of $77.64 (August 24) and the important 200-day SMA at $76.32. The breach of this region could lead to a retest of the weekly lows at $73.89 (July 17) and $66.86 (June 12), both ahead of the 2023 low at $63.61 (May 4). The December 2021 low is $62.46 (2 December), just above the key $60.00 level.
Resistance levels: $89.25 $93.73 $97.65 (4H chart)
Support levels: $86.12 $84.99 $82.12 (4H chart)
GER40
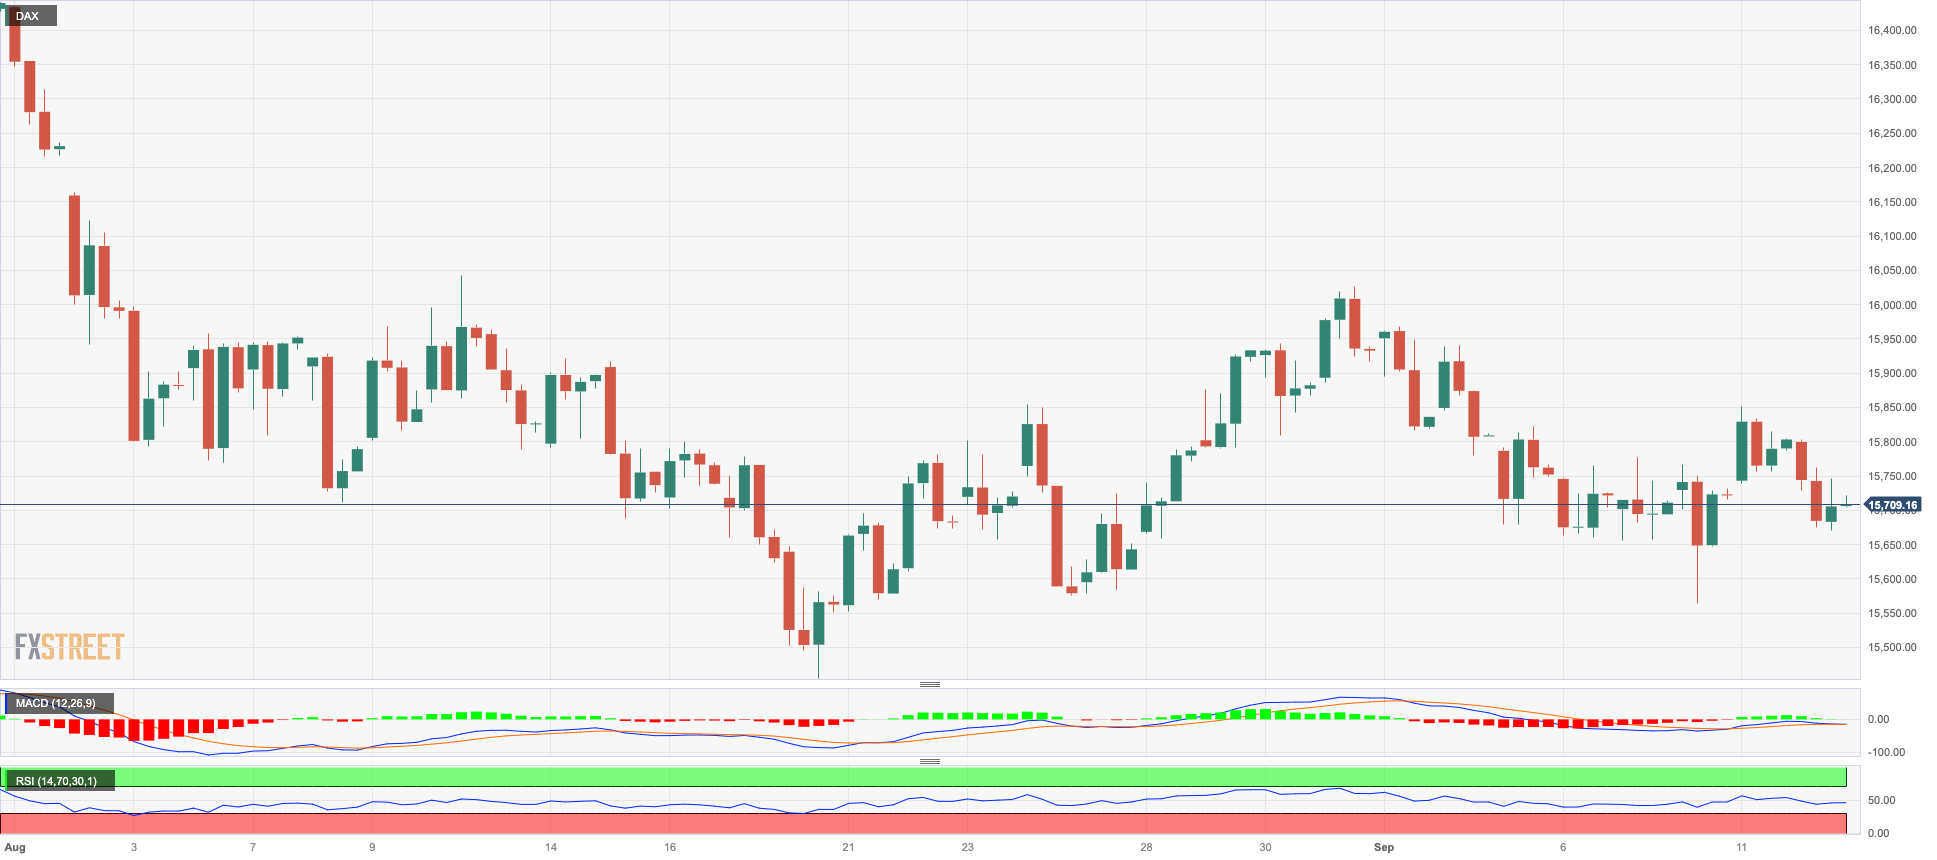
German equities resumed the downtrend following Monday’s irresolute price action, dragging the reference DAX40 back to the 15700 region on Tuesday.
The combination of prudence ahead of the release of US inflation figures on Wednesday and the ECB’s interest rate decision on Thursday with mixed results from the ZEW survey for Germany and the euro area weighed on investors’ sentiment and sponsored the drop to two-day lows in the index.
Furthermore, the daily pullback in the DAX40 contrasted with the second consecutive daily advance in the 10-year bund yield.
Further losses in the DAX40 are now aimed at the August low of 15468 (August 18), which seems to be supported by the 200-day line SMA (15496) and is slightly ahead of the July low of 15456 (July 7). If the index falls below this level, it could dispute the March low of 14458 (March 20) before reaching the December 2022 low of 13791 (December 20) and the 2022 low of 11862 (September 28). In reverse order, there is a temporary barrier at the 55-day SMA at 15922 prior to the weekly highs of 16042 (August 31) and 16060 (August 10). A breakout above the latter could refocus investors' attention on a possible challenge of the all-time top of 16528 (July 31). The RSI deflated to the area below 45.
Best Performers: Commerzbank, Rheinmetall AG, Hannover Rueck SE
Worst Performers: MTU Aero, Sartorius AG VZO, Merck
Resistance levels: 15867 16042 16060 (4H chart)
Support levels: 15577 15468 15456 (4H chart)
NASDAQ
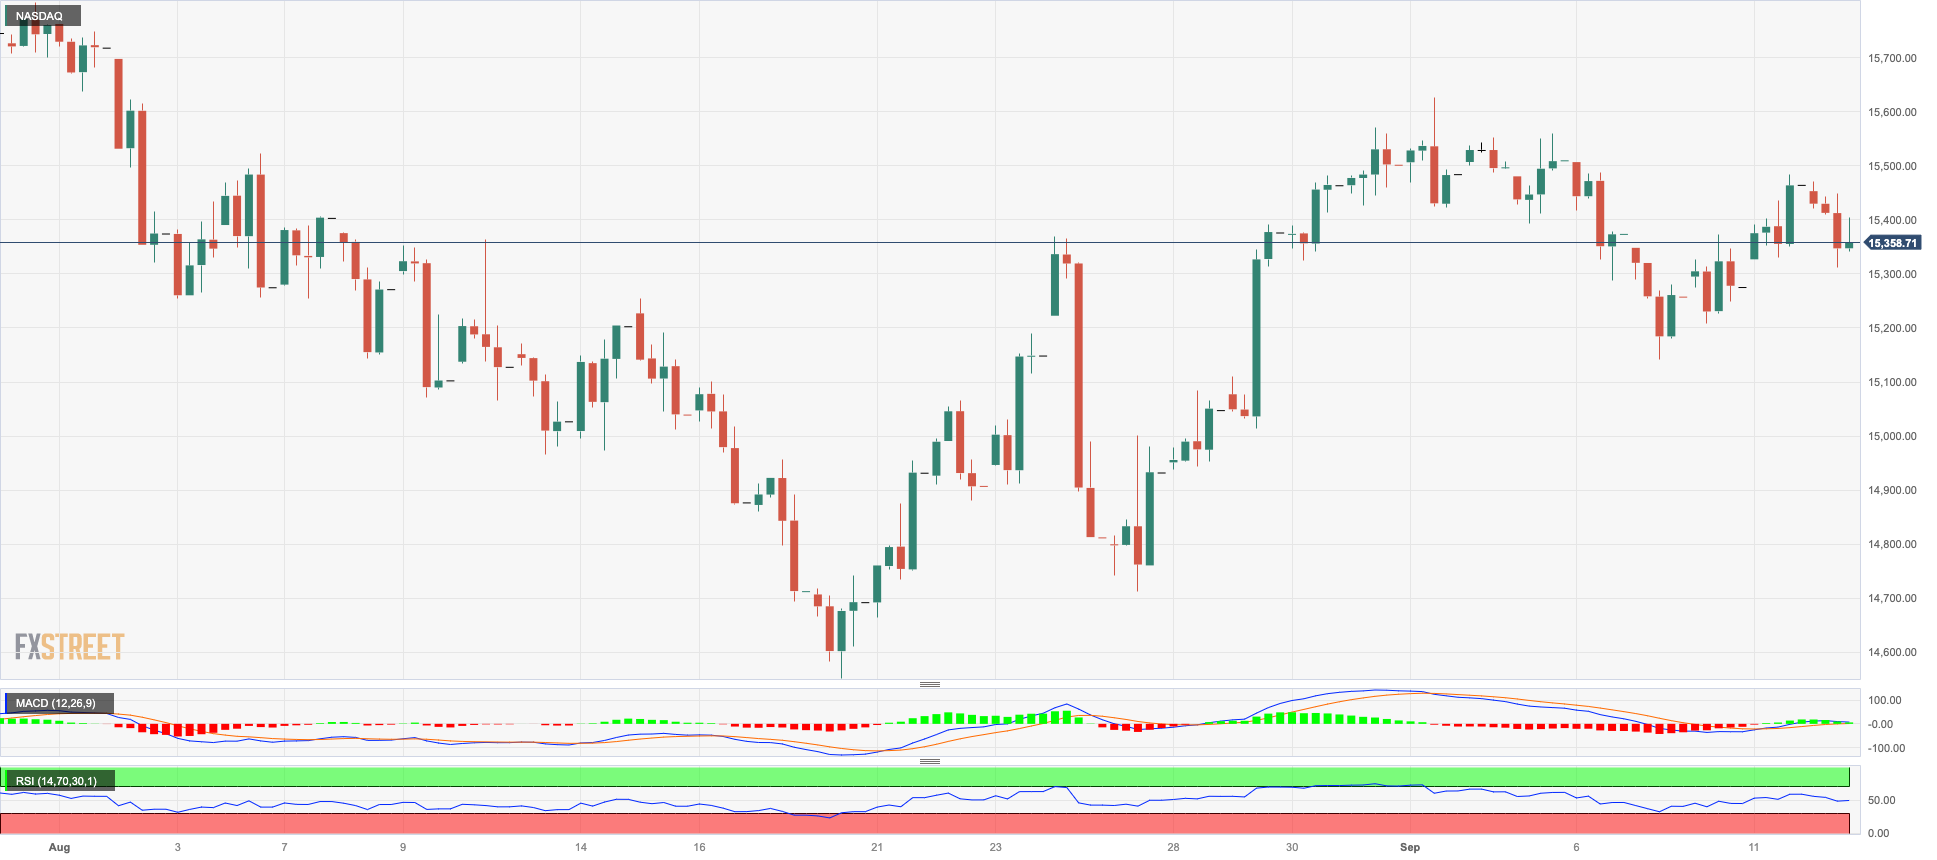
The tech benchmark Nasdaq 100 reversed two consecutive daily advances and charted a modest daily pullback to the 15400 zone on Tuesday.
The better tone in the greenback and the decent advance in the short end of the US yield curve kept the price action in the US tech sector somewhat subdued, while cautious ahead of Apple’s event also added to the daily downtick.
If bulls regain the initiative, the Nasdaq 100 should reach the September high of 15618 (September 1) before the weekly high of 15803 (July 31). The 2023 peak at 15932 (July 19) lies to the north, followed by the round mark of 16000. On the contrary, a tiny weekly bottom has formed at 14715 (August 25), which looks to be supported by the vicinity of the 100-day SMA and occurs before the August low of 14557 (August 18). If this level is broken, the weekly lows of 14283 (June 7) and 13520 (May 24) will be reintroduced before the 200-day SMA of 13349. The RSI grinded lower and broke below 55.
Top Gainers: Diamondback, Walgreen Boots, PayPal Holdings Inc
Top Losers: Adobe, DexCom, Datadog
Resistance levels: 15618 15803 15932 (4H chart)
Support levels: 15138 14715 14557 (4H chart)
DOW JONES
The blue-chip index Dow Jones clinched its fourth consecutive session with gains and advanced to five-day highs around the 34800 region on Tuesday.
In fact, investors remained optimistic and extended the positive mood amidst hopes of another confirmation of further disinflation in the US economy when the CPI figures are published on Wednesday.
The latter should morph into extra support for the perception that the Fed has ended its hiking cycle (with the July rate hike).
All in all, the Dow Jones advanced 0.51% to 34839, the S&P500 dropped 0.05% to 4485, and the tech-benchmark Nasdaq Composite retreated 0.38% to 13864.
For the Dow Jones, the weekly high of 35070 (August 31) is immediately to the upside, followed by the 2023 peak of 35679 (August 1) and the February 2022 top of 35824 (February 9). The latter's breakthrough might lead to the all-time high of 36952 (January 5, 2022). If the index goes below the August low of 34029 (August 25), it may return to the 200-day SMA at 33798, just ahead of the July low of 33705 (July 10). South from here aligns the May low of 32586 (May 25) prior to the 2023 low of 31429 (March 15). The daily RSI climbed north of the 53 mark.
Top Performers: Goldman Sachs, Walgreen Boots, Chevron
Worst Performers: Procter&Gamble, Microsoft, Apple
Resistance levels: 35070 35578 35679 (4H chart)
Support levels: 34291 34029 33705 (4H chart)
MACROECONOMIC EVENTS
All Information & Updates provided by:

All information relating to the financial markets available on this page has been prepared and issued by FXStreet (Forexstreet SL, Spain, Reg: B62498233) on the basis of publicly available information and all information believed to be reliable and does not conflict with Kuwaiti local laws, and all necessary care has been taken to before the company to ensure that the facts mentioned are correct from the source.
NCM Investment nor any of its directors or employees shall in any way be held responsible for the contents of this news, and the information contained on this page is intended only to provide clients with publicly available information and should not be construed as investment advice, report or analysis and/or constitute an offer or invitation to buy or sell financial instruments of any kind.
RISK WARNING: Forex and CFDs are highly risky leveraged products, as losses can exceed deposits. Please ensure you understand all the risks and take independent advice if necessary. NCM will segregate the clients based on the criteria of the regulator and its bylaws. NCM does not provide any advisory service; the material published does not constitute advice or a recommendation for a transaction in any financial instrument. NCM accepts no responsibility for any use of the content presented and any consequences of that use. Anyone acting on the information provided does so at their own risk.