
- Contact Us:
-

-

-

-


Daily Market Updates
14 Sep 2023
USDJPY
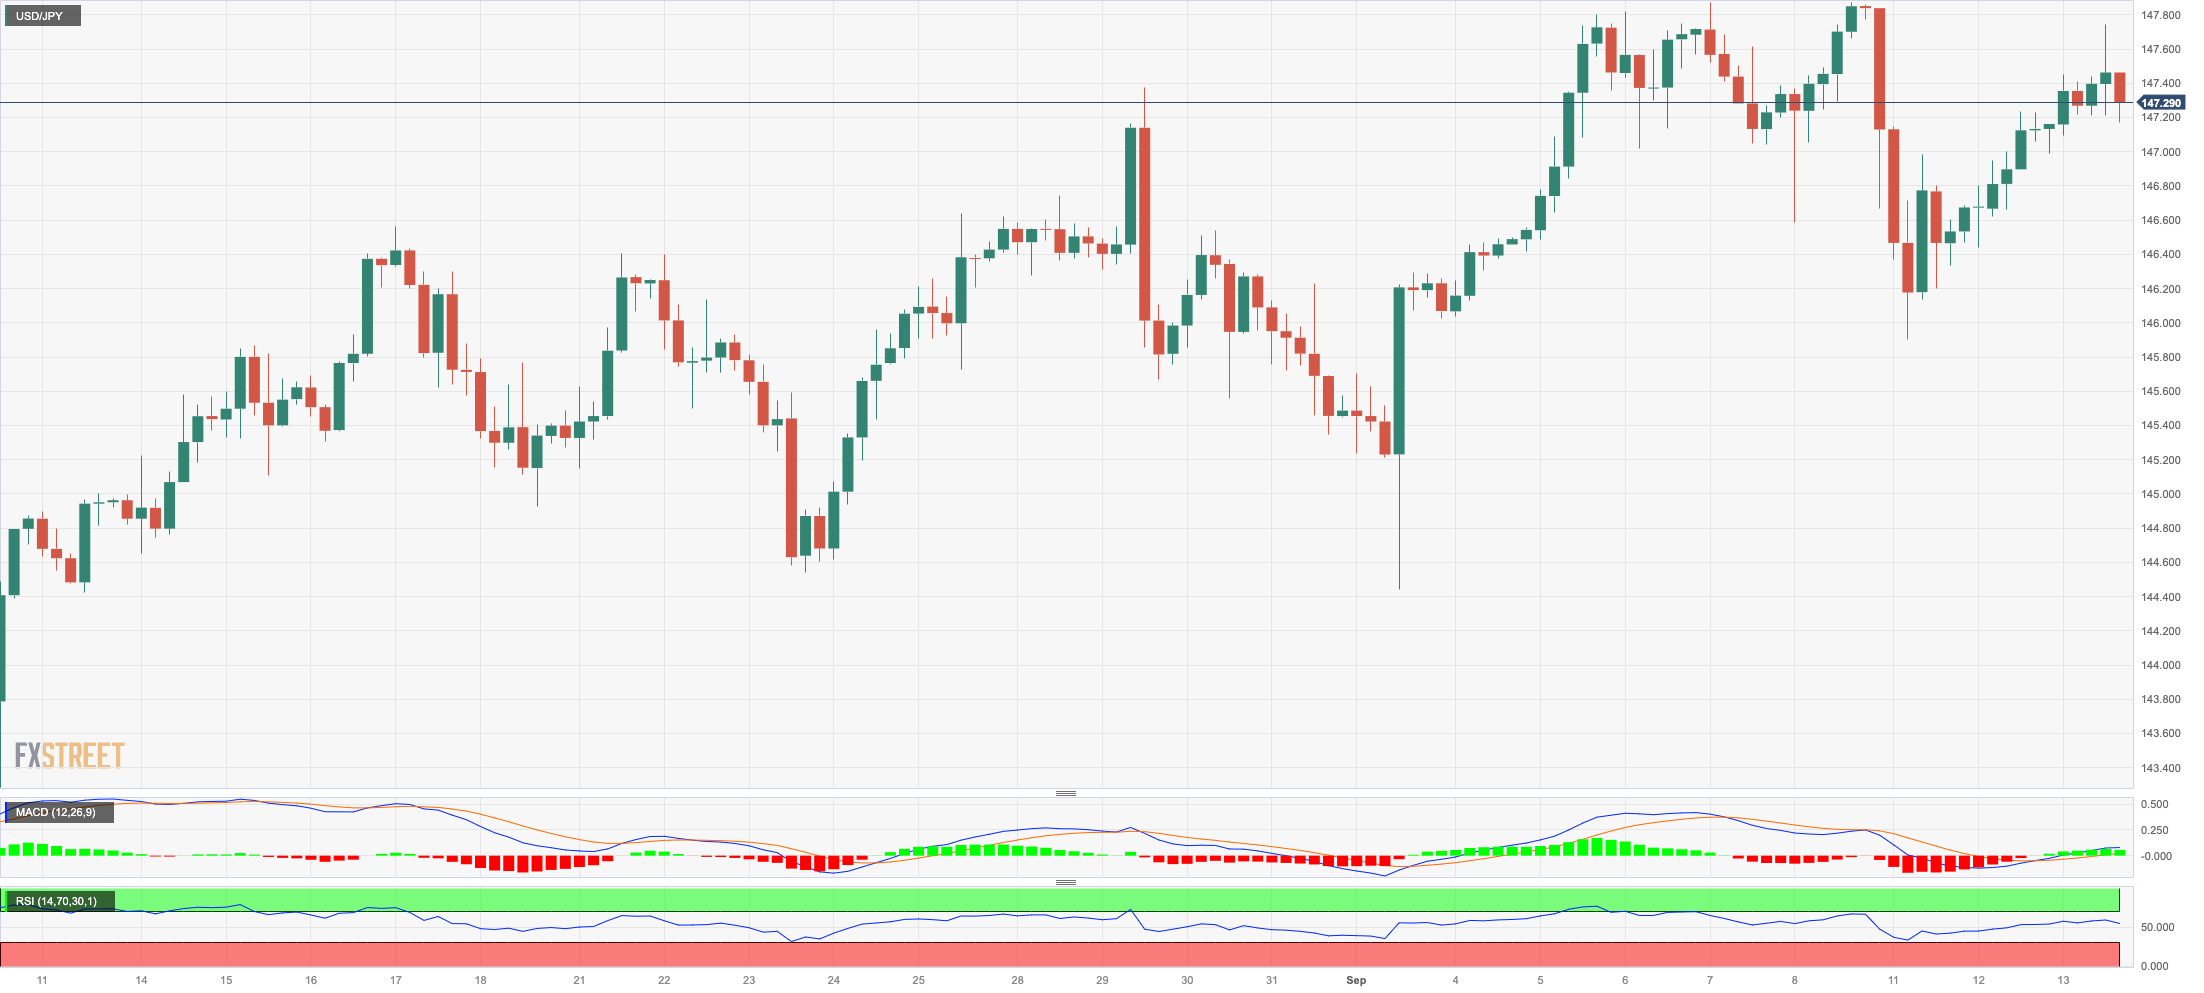
USD/JPY added to Tuesday’s gains and rose to the proximity of the 2023 peaks, passing 147.70 on Wednesday.
Fresh legs for the pair came on the back of the persistent move higher in the greenback amidst the negative performance of US yields and extra consolidation in JGB 10-year yields just above 0.70%.
News from the BoJ cited Board member Suzuki stating that JGB yields are influenced by a multitude of factors, adding the bank’s commitment to effectively managing the national debt and determining both the scale and the specific components of the forthcoming economic stimulus package.
Meanwhile in Japan, the Reuters Tankan Index retreated to 4 in September (from 12), and the BSI Large Manufacturing Index expanded 5.4% QoQ in Q3. In addition, Producer Prices rose 0.3% MoM in August and 3.2% from a year earlier.
If USD/JPY breaks above the 2023 high of 147.87 (September 7), it will most likely face the 2022 top of 151.95 (October 21). On the downside, the September low of 144.43 (September 1) takes precedence over the 55-day SMA of 143.75 and the August low of 141.50 (August 7). If this level is breached, the pair could target the weekly low of 138.05 (July 28), seconded by the July low of 137.23 (July 13), which seems to be underpinned by the 200-day SMA at 137.22. A lower retracement could put the weekly low of 133.01 (April 26) and the smaller levels of 132.01 (April 13) and 130.62 (April 5) in danger. On the daily chart, the RSI improved into the 60 area.
Resistance levels: 147.87 148.45 148.84 (4H chart)
Support levels: 145.89 145.21 144.43 (4H chart)
GBPUSD
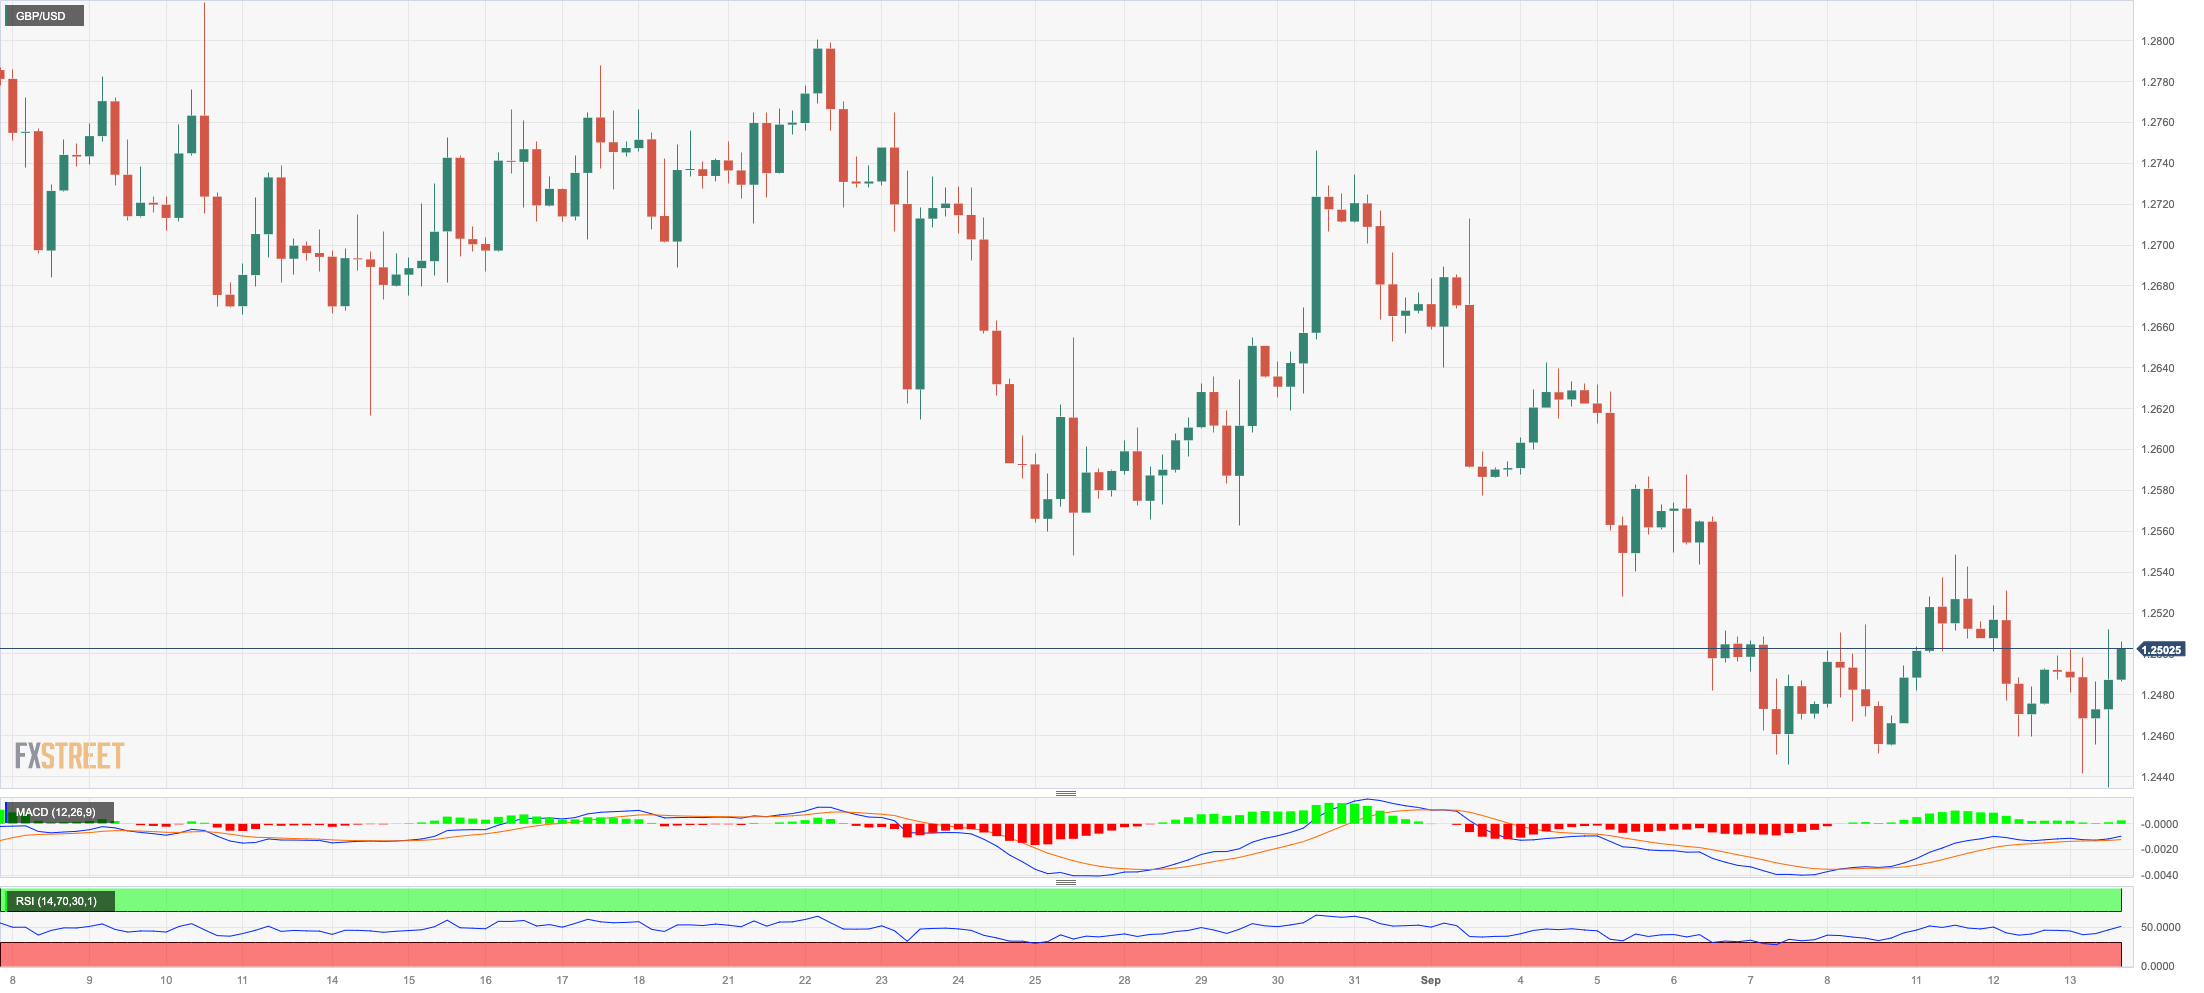
GBP/USD alternated gains with losses around the 1.2500 hurdle on Wednesday, managing to gather composure following an earlier drop to the 1.2430 region, an area coincident with the critical 200-day SMA.
The better tone in the greenback kept risk-linked assets under pressure midweek, although that bullish stance in the greenback wore off in the wake of the release of mixed US inflation figures for the month of August.
Returning to the realm of monetary policy, there is approximately a 73% likelihood that the Bank of England will implement a quarter-point interest rate hike during its meeting on September 21, with a probable pause in early November.
Very interesting docket in the UK for the month of July: GDP 3-Month Average expanded 0.2%, while the GDP came in flat on a yearly basis and contracted 0.5% vs. the previous month. In addition, Industrial Production expanded 0.4% YoY, and Manufacturing Production rose 3.0% over the last twelve months. Finally, the trade deficit narrowed a tad to £14.064B and Construction Output expanded 2.8% YoY.
If GBP/USD falls further, the 200-day SMA at 1.2429 will provide initial support, as will the vicinity of the 2021-2023 trendline just above the 1.2400 mark. If this zone is breached, the June low of 1.2368 (June 5) may be reached before the May low of 1.2308 (May 25). Instead, Cable has the ability to recapture the intermediate 100-day SMA at 1.2654 before the weekly high at 1.2746 (August 30), which looks to be supported by the 55-day SMA (1.2741). The weekly tops to the north of this are 1.2818 (August 10) and 1.2995 (July 27), pips ahead of the psychological 1.3000 threshold. The daily RSI settled just below 38.
Resistance levels: 1.2548 1.2587 1.2642 (4H chart)
Support levels: 1.2433 1.2368 1.2308 (4H chart)
AUDUSD
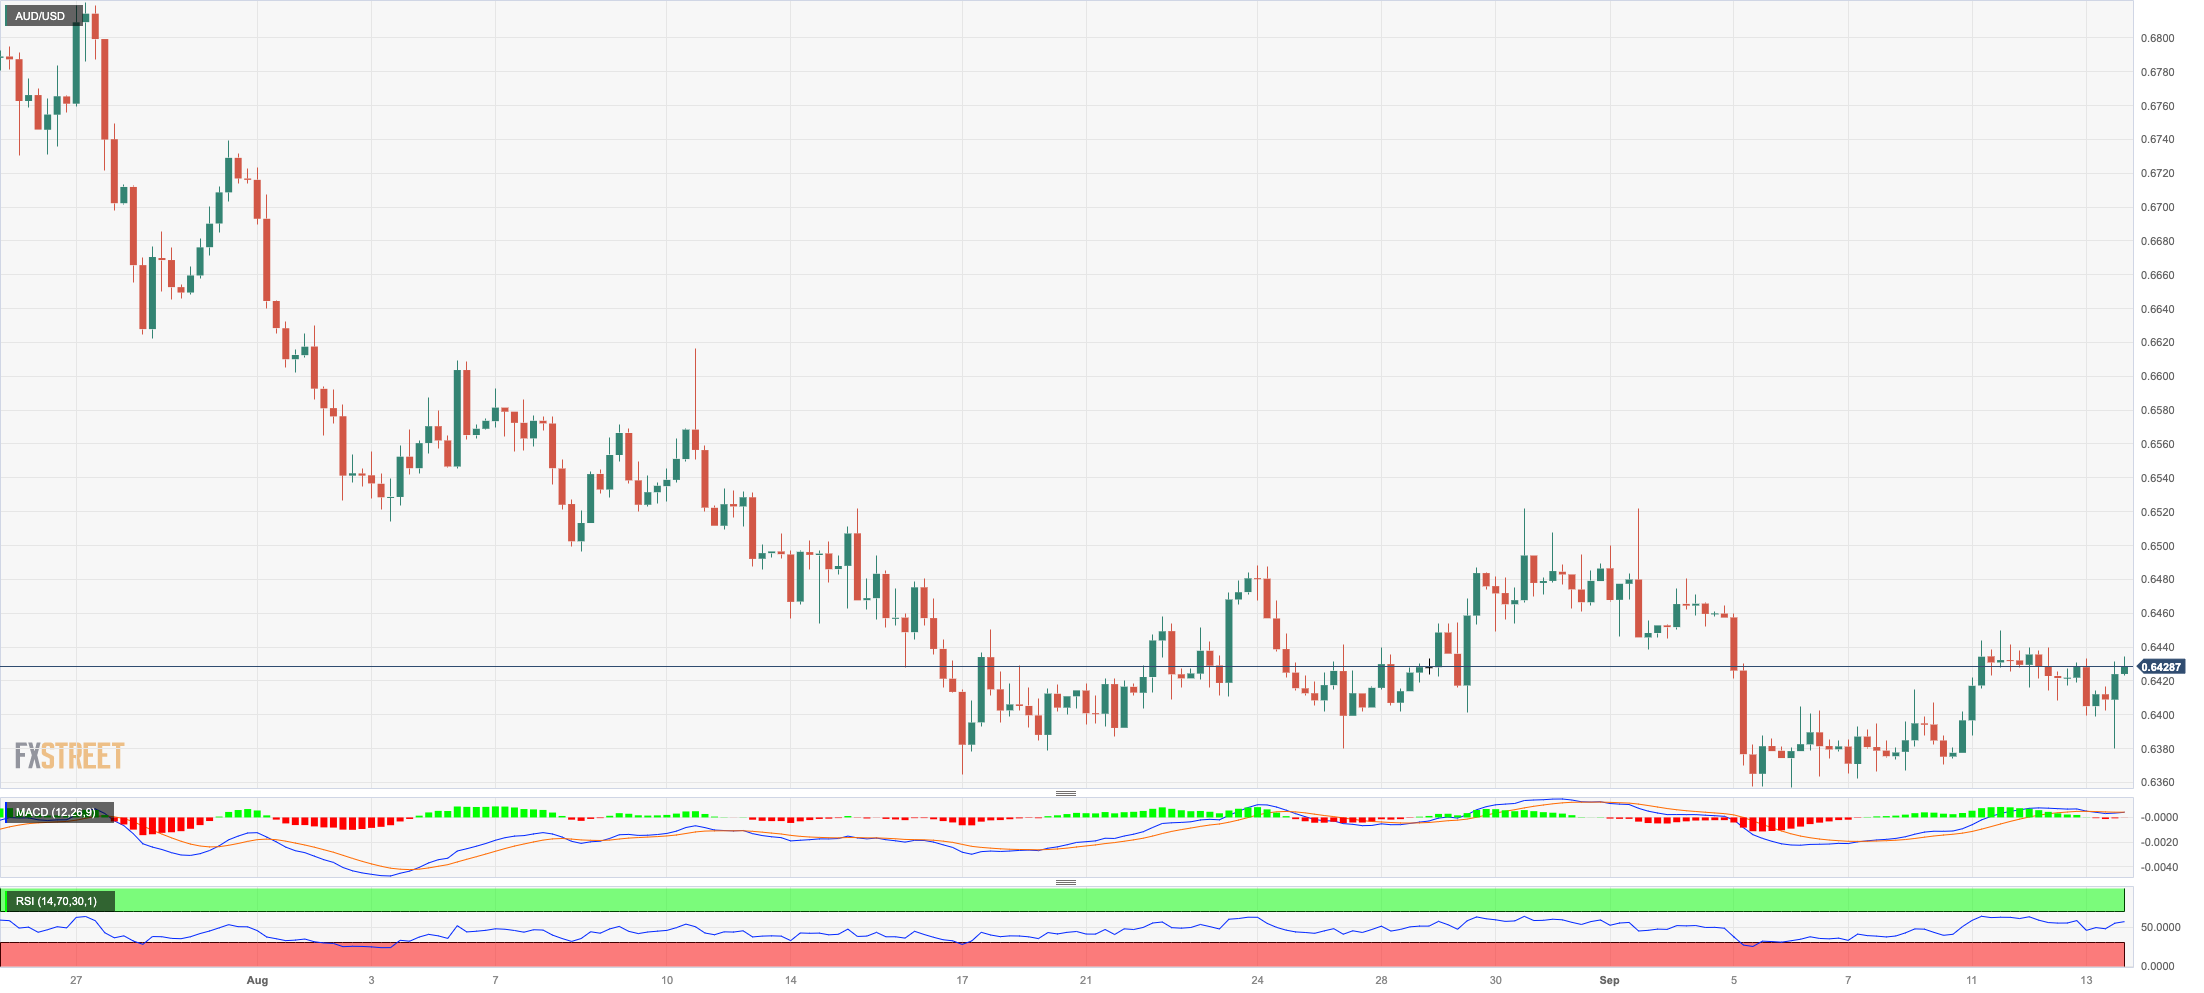
Despite another positive session for the US dollar, AUD/USD managed well to stay afloat and print humble gains around 0.6430 on Wednesday.
In fact. The Aussie dollar derived fresh support from news suggesting further stimulus measures by the PBoC, while the broad-based upbeat sentiment in the commodity complex also added to the daily gains.
The Australian calendar was empty on Wednesday.
The 2023 low at 0.6357 (September 5) is immediately to the downside for the AUD/USD, followed by the November 2022 bottom at 0.6272 (November 7) and the 2022 low at 0.6179 (October 13). On the contrary, the pair faces immediate resistance at the weekly high of 0.6522 (August 30), ahead of another weekly top of 0.6616 (August 10) and the 200-day SMA at 0.6707. Extra gains may cause the July peak of 0.6894 (July 14) to be revisited before the June high of 0.6899. (June 16). The critical milestone of 0.7000 follows, before the weekly top of 0.7029 (February 14) and the 2023 peak of 0.7157 (February 2). The daily RSI remained flat around 44.
Resistance levels: 0.6449 0.6477 0.6521 (4H chart)
Support levels: 0.6380 0.6357 0.6272 (4H chart)
GOLD
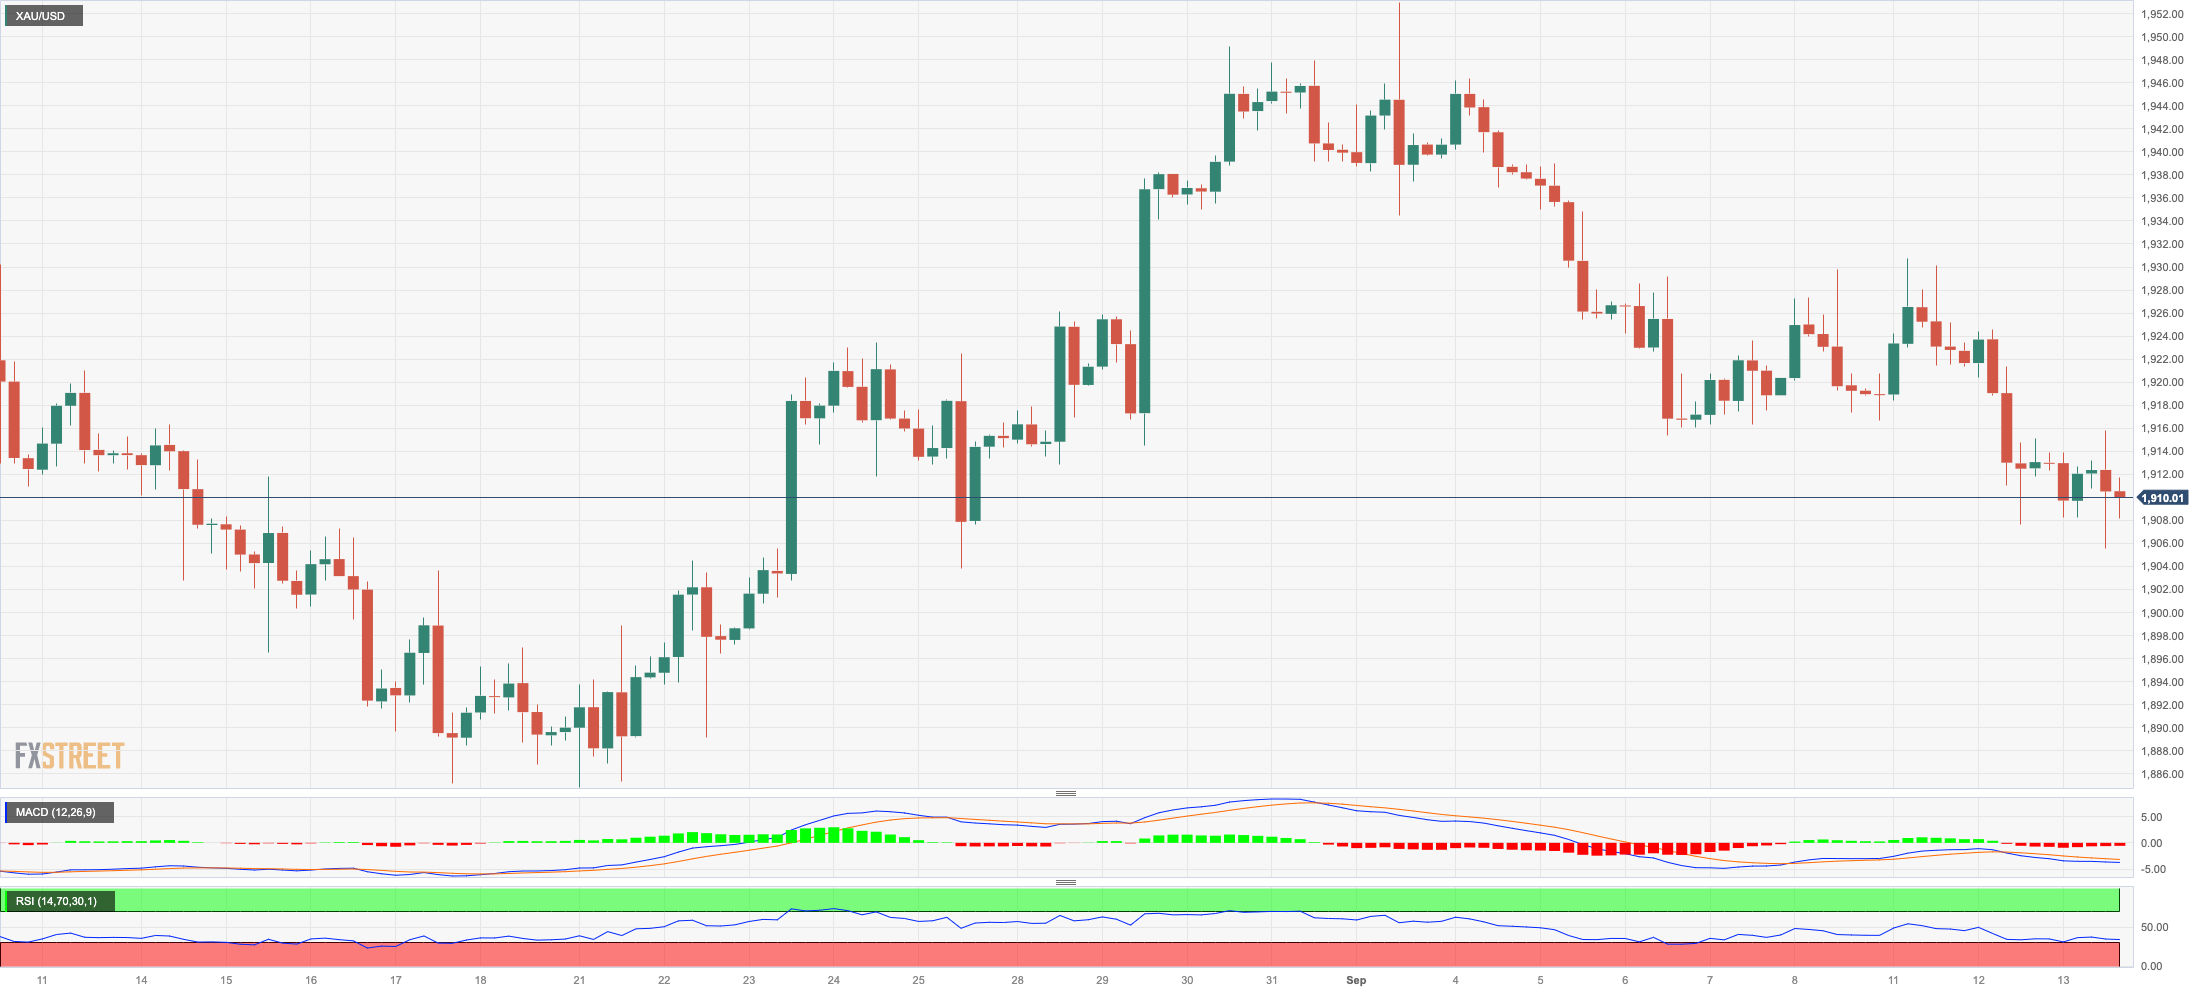
Prices of the troy ounce of the yellow metal retreated for the second session in a row on Wednesday, this time dangerously approaching the key contention area around $1900.
The daily pullback in bullion was accompanied by decent gains in the greenback, while the decline of US yields across different timeframes appears to have tempered the downside pressure somewhat.
The next risk event for the precious metal is the FOMC gathering on September 20, where the Fed is widely anticipated to keep the Fed Funds Target Range (FFTR) unchanged.
A further decline could push gold back to the $1900 level before reaching the August low of $1885 (August 17) and the 2023 low of $1804 (February 28), all ahead of the critical $1800 support. Apart from that, the 100-day SMA seems to be holding the September high of $1953 (September 1). A breakout from this zone could lead to a visit to the July top of $1987 (July 20), just below the psychological $2000 level. A breakout from this area could pave the way for a challenge of the 2023 peak at $2067 (May 4), then the 2022 high at $2070 (March 8) and the all-time top at $2075 (August 7, 2020).
Resistance levels: $1923 $1930 $1953 (4H chart)
Support levels: $1905 $1903 $1884 (4H chart)
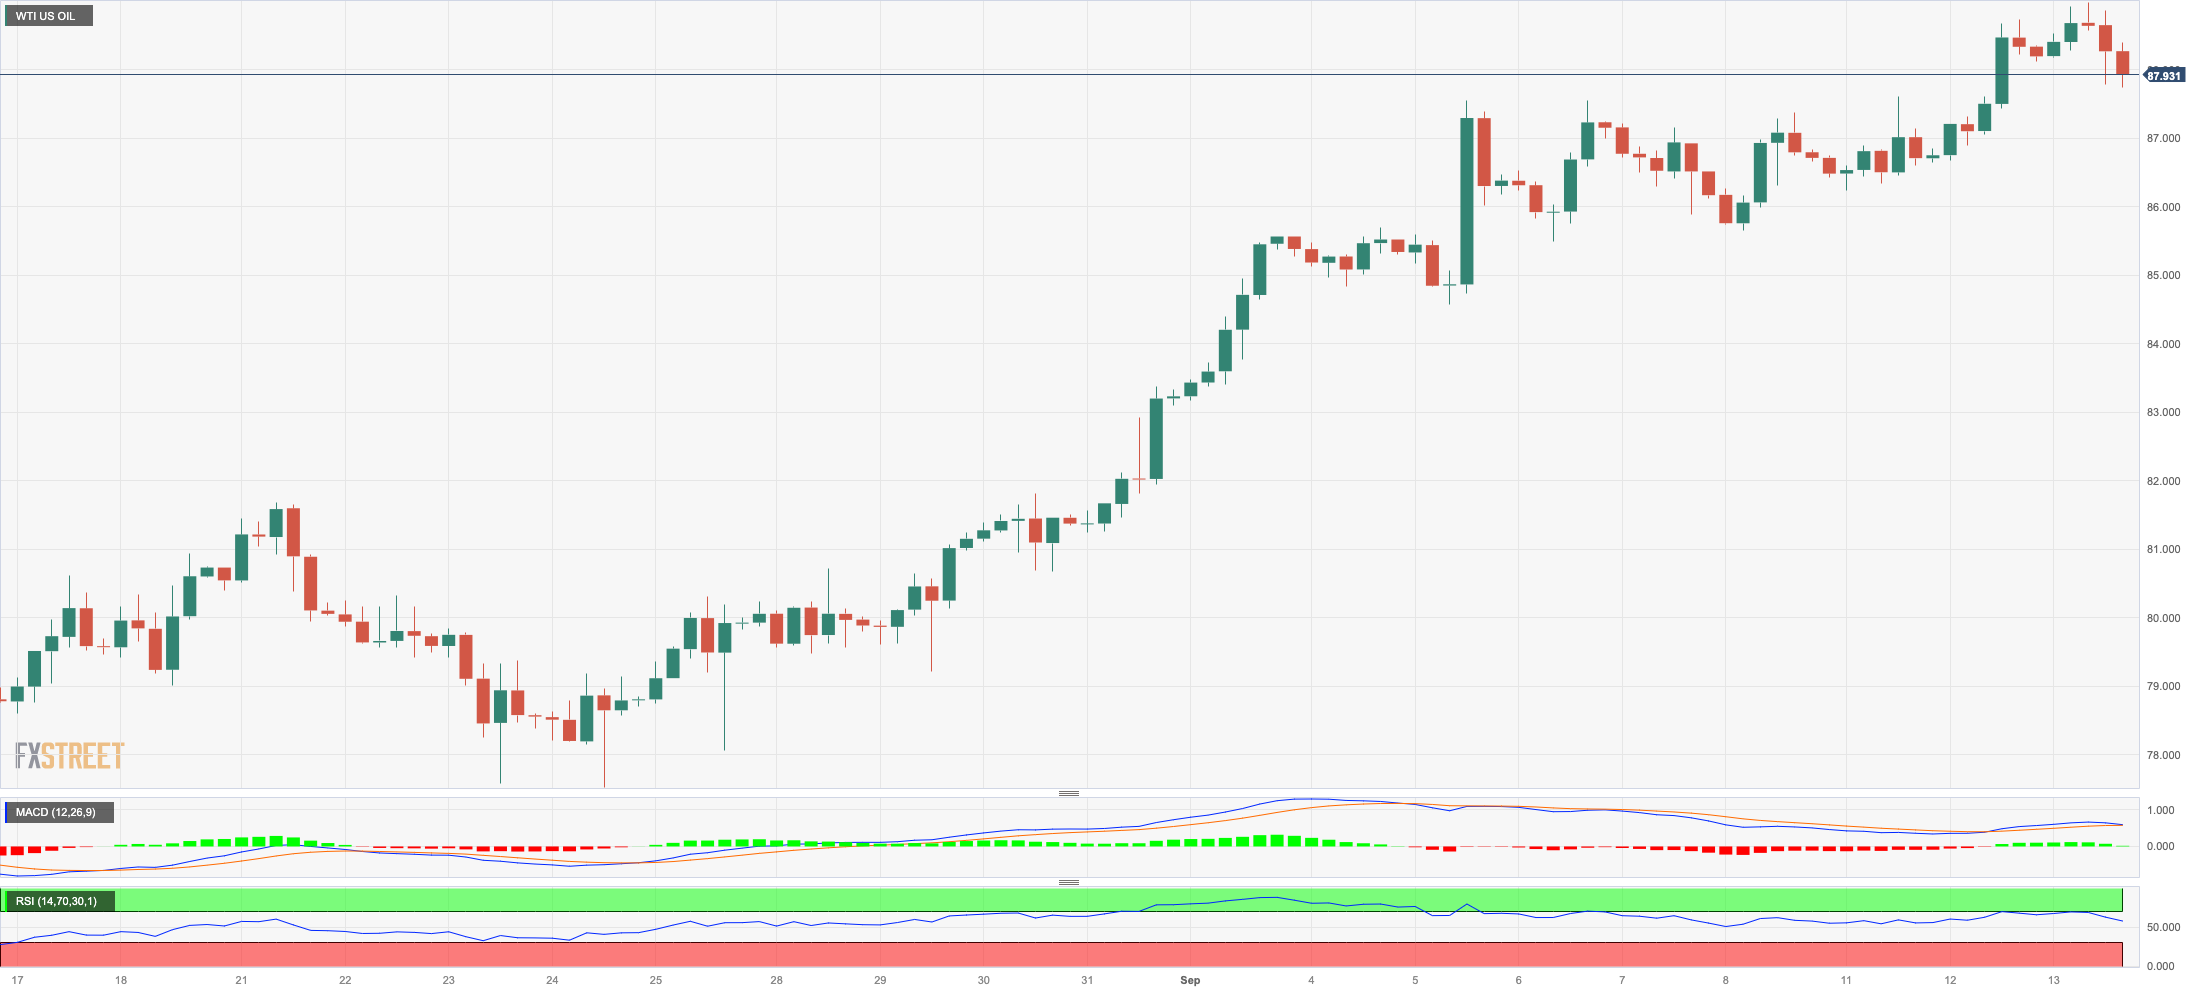
CRUDE WTI
Prices of WTI rose to fresh tops around $89.60 for the first time since mid-November on Wednesday.
The initial uptick, however, lost some traction and prompted the commodity to give away part of those gains and recede to the sub-$89.00 zone towards the end of the session on Wall Street.
Once again, the perception of a pick-up in the demand for crude oil in 2023 and 2024 (according to OPEC) coupled with oil output cuts from Saudi Arabia and the reduction of Russia’s crude oil exports favoured extra gains in WTI.
On the other hand, the unexpected weekly build in US crude oil supplies and the reopening of ports in Libya seem to have reignited some selling pressure.
Back to the EIA’s report, US crude oil inventories unexpectedly increased by 3.954M barrels in the week to September 8, while supplies at Cushing dropped by 2.450M barrels, Weekly Distillate Stocks went up by 3.931M barrels and gasoline stockpiles rose by 5.560M barrels.
Given the recent price action in WTI, the round $90.00 level appears to be the next hurdle to the upside, followed by the November 2022 top at $93.73 (November 7) and the weekly high at $97.65 (August 30, 2022), all ahead of the critical $100.00 mark per barrel. On the flip side, the 55-day SMA at $79.72 is proving to be the first support ahead of the August low of $77.64 (August 24) and the important 200-day SMA at $76.35. A breakdown of this region could lead to a retest of the weekly lows at $73.89 (July 17) and $66.86 (June 12), both ahead of the 2023 low at $63.61 (May 4). The December 2021 low is $62.46 (December 2), just above the important $60.00 level.
Resistance levels: $89.60 $93.73 $97.65 (4H chart)
Support levels: $86.74 $84.99 $82.12 (4H chart)
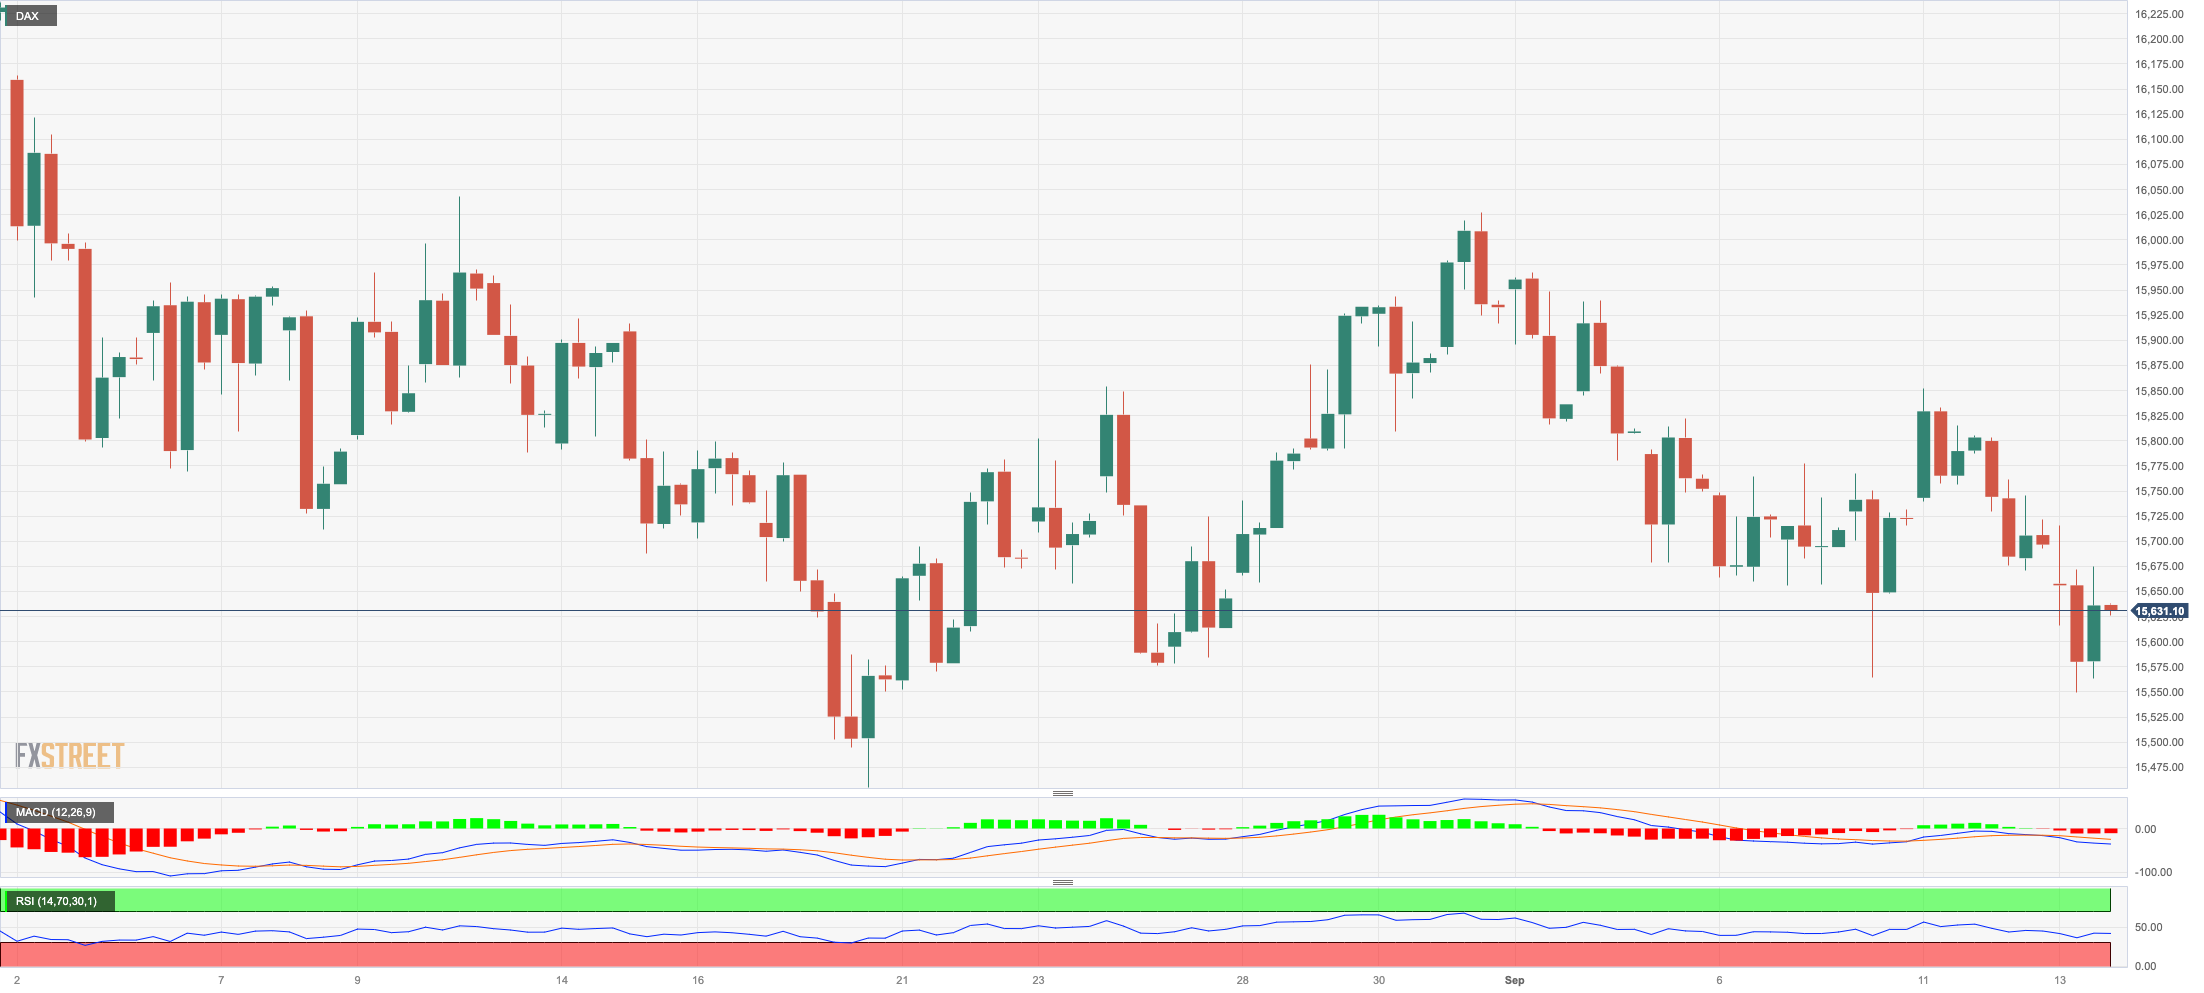
GER40
Germany’s reference DAX40 clinched its second session in a row of losses on Wednesday.
The index briefly dipped to new three-week lows near 15560, although it managed to regain some balance afterwards. The bearish mood, however, prevailed among market participants after US inflation figures came in mostly in line with markets’ expectations.
In addition, traders remained cautious ahead of the ECB event on Thursday, where consensus kept pointing to a 25 bps rate hike, taking the Deposit Facility Rate to 4.0%.
Extra downside pressure hurt German stocks in response to the government’s projection of a contraction of 0.3% in the economy this year.
Further losses in the DAX40 are now targeting the August low of 15468 (18 August), which seems to be supported by the 200-day SMA (15501) and is slightly ahead of the July low of 15456 (July 7). If the index falls below this level, it could challenge the March low of 14458 (March 20) before the December 2022 low of 13791 (December 20) and the 2022 low of 11862 (September 28). In reverse order, there is a temporary barrier at the 55-day SMA at 15917 before the weekly highs of 16042 (August 31) and 16060 (August 10). A breakout above the latter could refocus investors' attention on a possible challenge of the all-time top of 16528 (July 31). The RSI dropped to the area below 42.
Best Performers: Deutsche Bank AG, MTU Aero, Sartorius AG VZO
Worst Performers: Bayer, Adidas, Siemens Healthineers
Resistance levels: 15867 16042 16060 (4H chart)
Support levels: 15564 15468 15456 (4H chart)
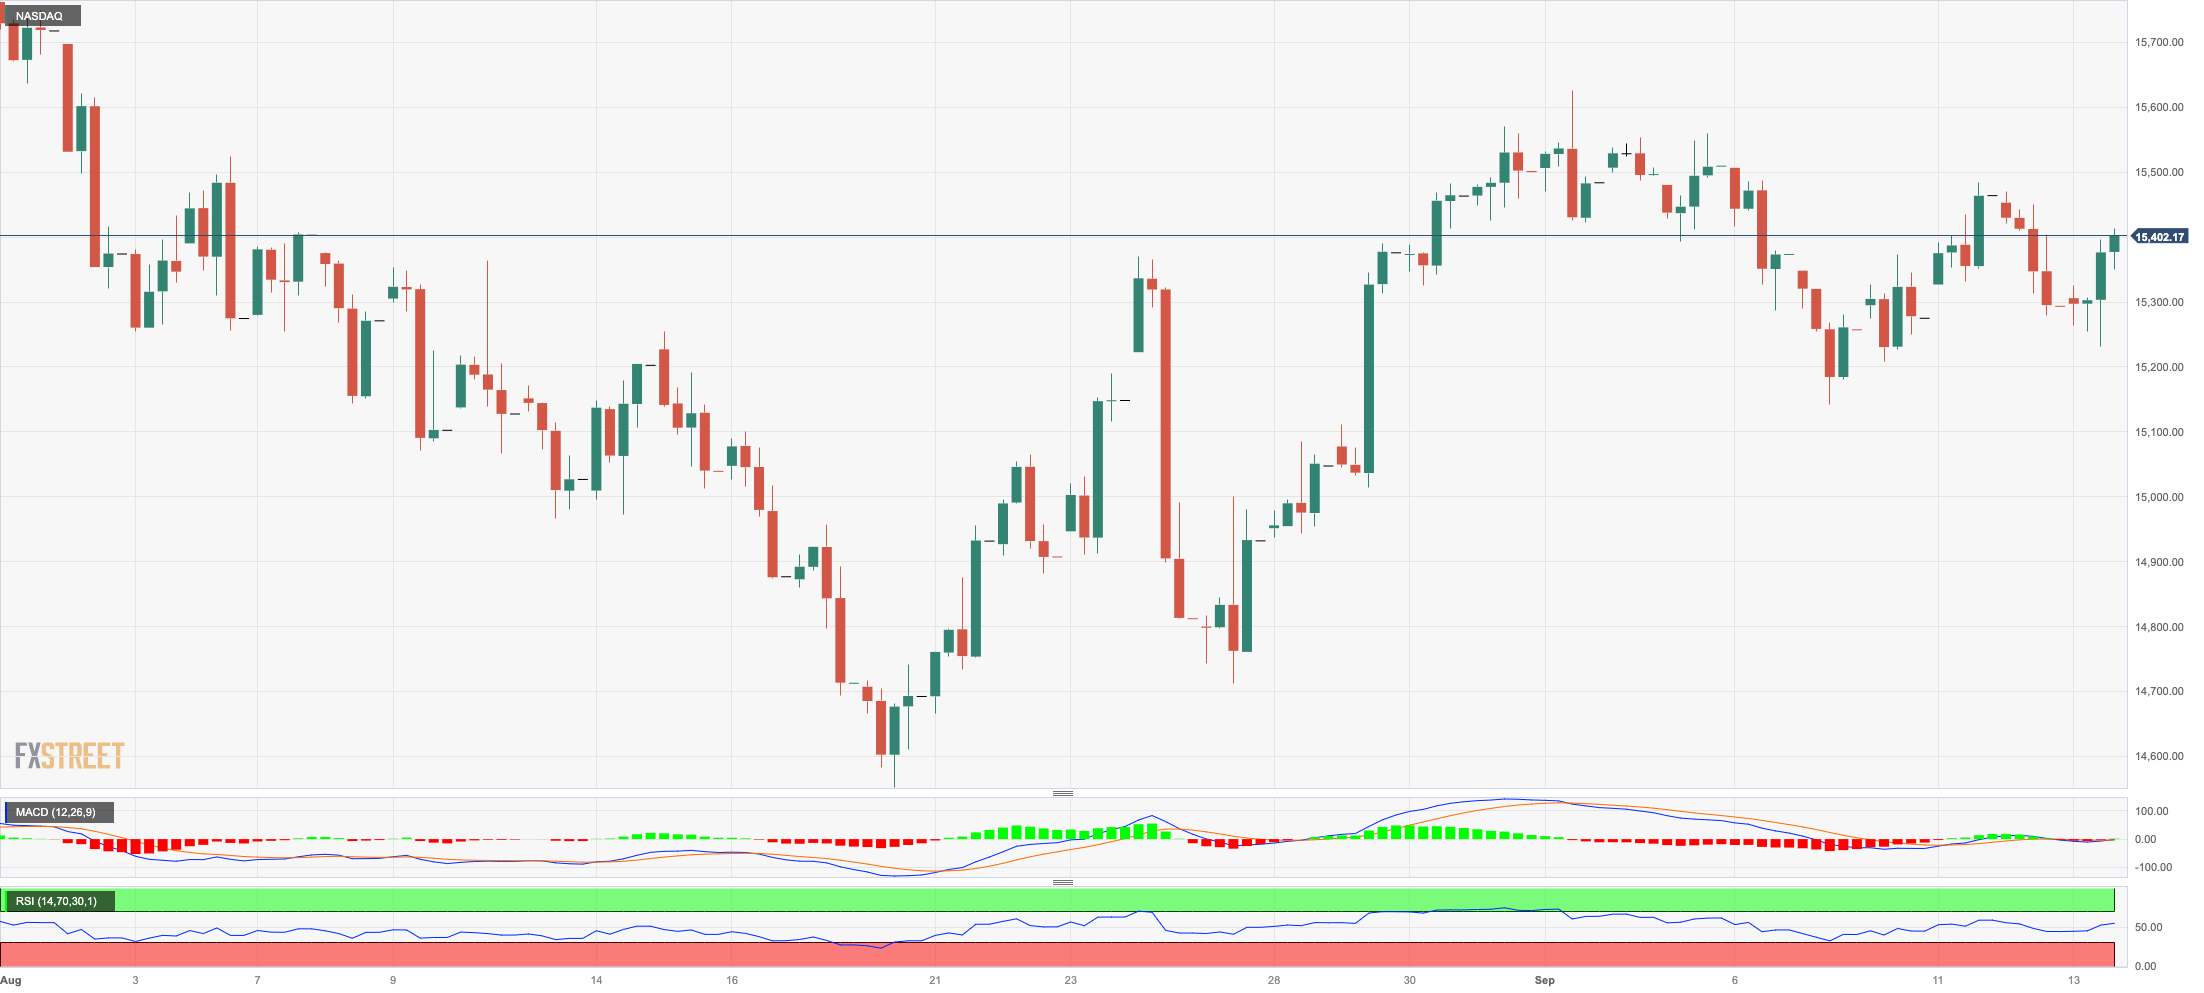
NASDAQ
The US tech sector managed to regain its smile and sponsor the uptick in the Nasdaq 100 on Wednesday, reversing the previous daily drop and refocusing back to the upside.
The late loss of momentum in the greenback in combination with the marked decline in US yields across the curve lent support to tech equities, while firmer speculation that the Fed ended its tightening campaign also benefited the tech index.
If the bulls retake control, the Nasdaq 100 should hit the September high of 15618 (September 1) before the weekly top of 15803 (July 31). To the north, the 2023 top of 15932 (July 19) is followed by the round mark of 16000. On the opposite side, a little weekly bottom has developed around 14715 (August 25), which appears to be supported by the proximity of the 100-day SMA (14674) and comes before the August low of 14557 (August 18). If this level is breached, the weekly lows of 14283 (June 7) and 13520 (May 24) will be reintroduced before the 200-day SMA of 13349. The RSI approached the 55 region.
Top Gainers: AMD, Synopsys, Moderna
Top Losers: Netflix, Enphase, Baker Hughes
Resistance levels: 15482 15618 15803 (4H chart)
Support levels: 15138 14715 14557 (4H chart)
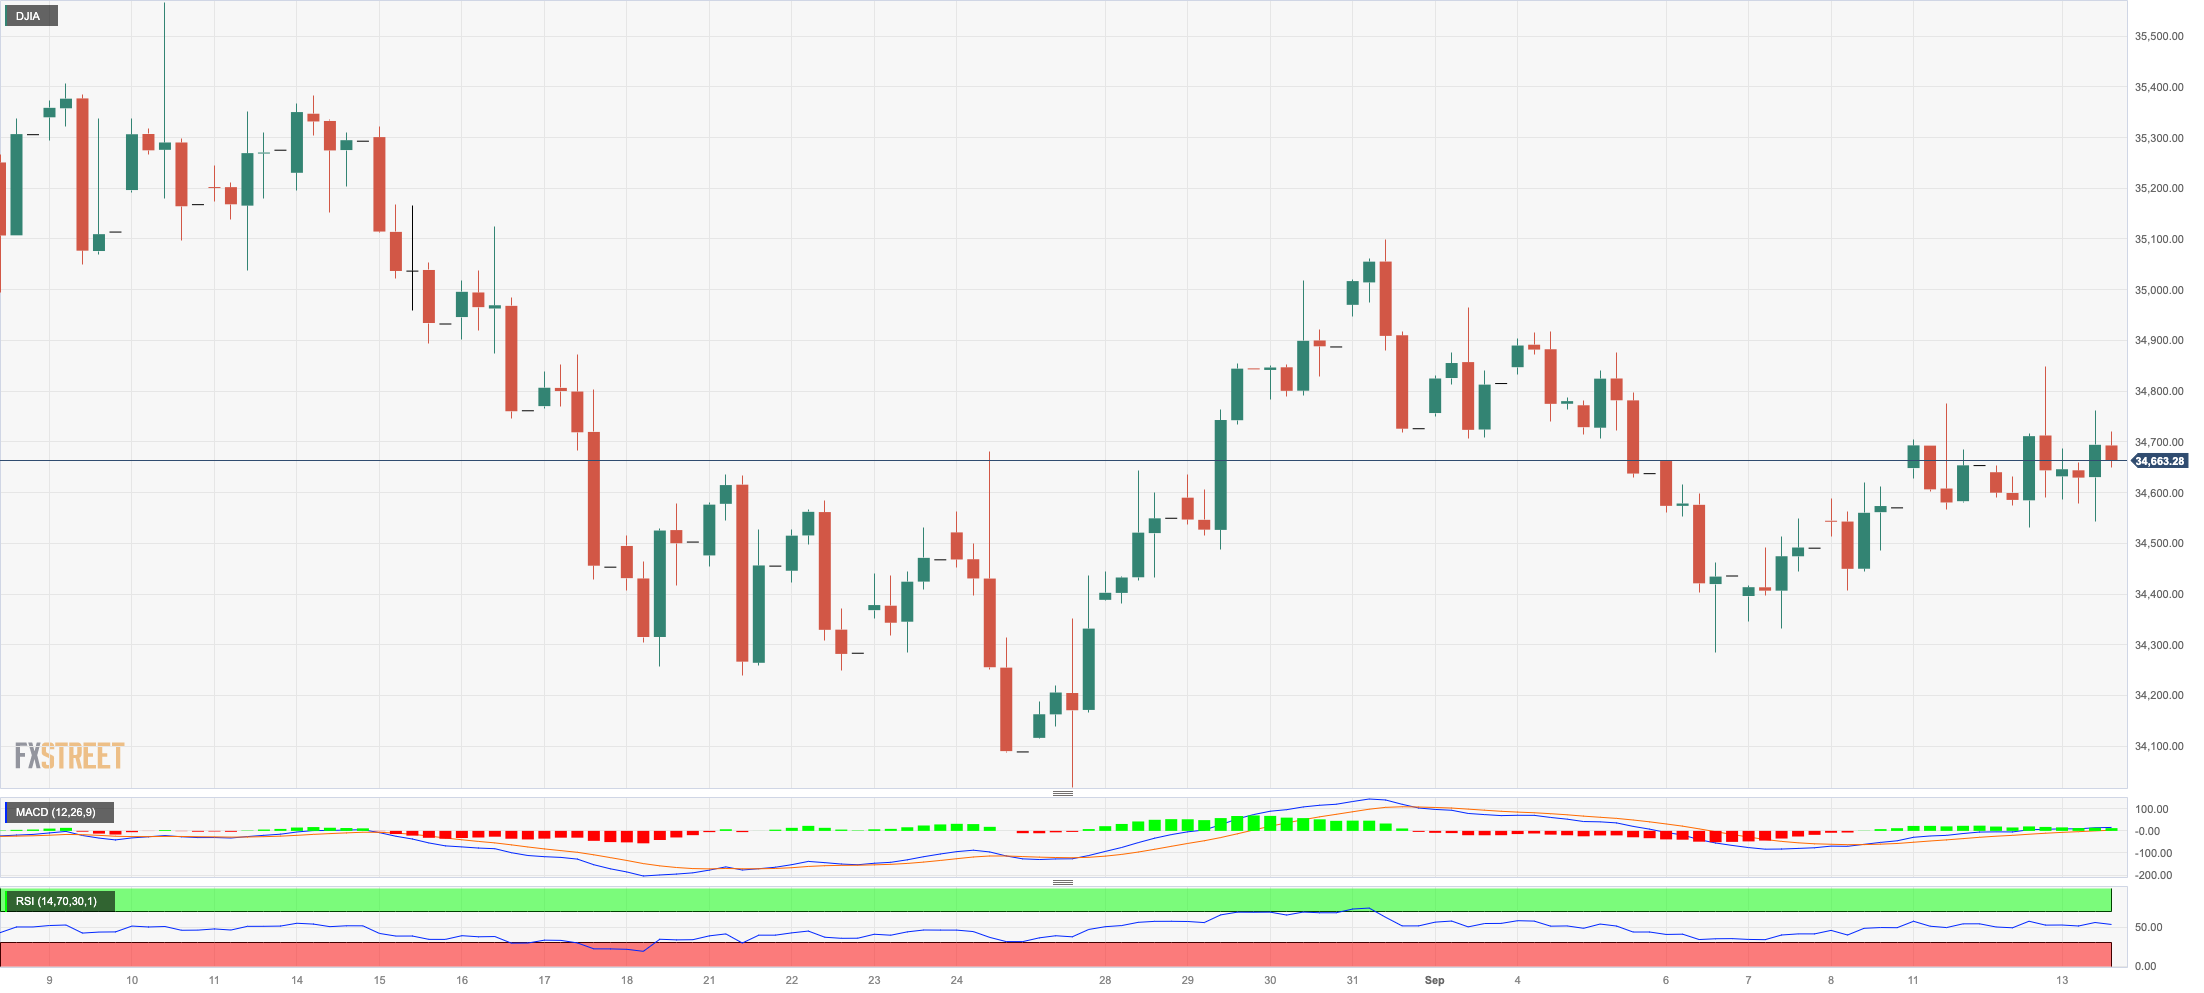
DOW JONES
Equities tracked by the Dow Jones charted an irresolute session and hovered around the 34700 region on Wednesday.
Indeed, the index advanced modestly as market participants digested the release of US inflation figures measured by the CPI for the month of August, which in turn seems to have reinforced the idea that the Fed might be done hiking rates.
On the latter, speculation kept signalling the likely start of interest rate cuts at some point in the second quarter of the next year.
Overall, the Dow Jones gained 0.11% to 34684, the S&P500 advanced 0.35% to 4477, and the tech-focused Nasdaq Composite rose 0.62% to 13859.
The weekly high of 35070 (August 31) for the Dow Jones is immediately to the upside, followed by the 2023 peak of 35679 (August 1) and the February 2022 top of 35824 (February 9). The latter's breakout might result in an all-time high of 36952 (January 5, 2022). Just the opposite, a drop below the August low of 34029 (August 25), it may return to the 200-day SMA of 33799, slightly ahead of the July low of 33705 (July 10). South from here, the May low of 32586 (May 25) is aligned with the 2023 low of 31429 (March 15). The daily RSI settled around the 50 threshold.
Top Performers: Honeywell, Goldman Sachs, Microsoft
Worst Performers: 3M, Dow, Caterpillar
Resistance levels: 34852 35070 35578 (4H chart)
Support levels: 34291 34029 33705 (4H chart)
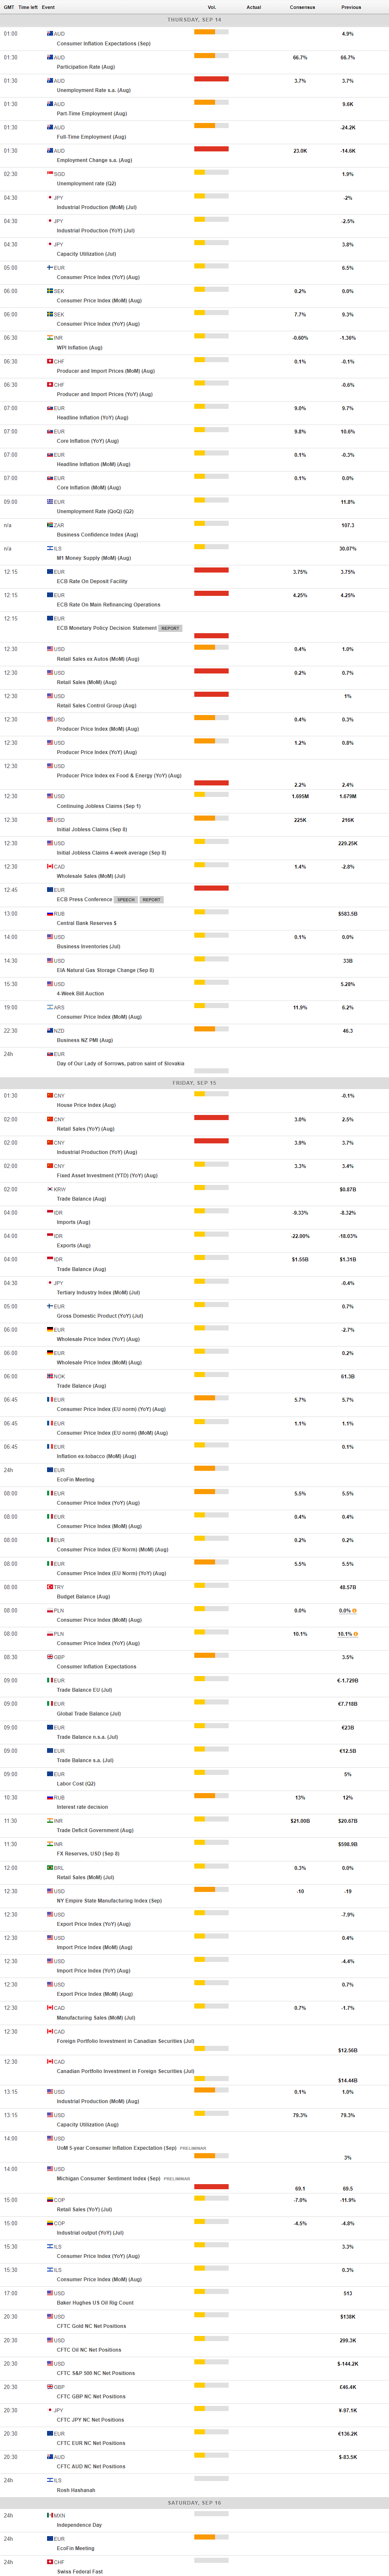
MACROECONOMIC EVENTS
All Information & Updates provided by:

All information relating to the financial markets available on this page has been prepared and issued by FXStreet (Forexstreet SL, Spain, Reg: B62498233) on the basis of publicly available information and all information believed to be reliable and does not conflict with Kuwaiti local laws, and all necessary care has been taken to before the company to ensure that the facts mentioned are correct from the source.
NCM Investment nor any of its directors or employees shall in any way be held responsible for the contents of this news, and the information contained on this page is intended only to provide clients with publicly available information and should not be construed as investment advice, report or analysis and/or constitute an offer or invitation to buy or sell financial instruments of any kind.
RISK WARNING: Forex and CFDs are highly risky leveraged products, as losses can exceed deposits. Please ensure you understand all the risks and take independent advice if necessary. NCM will segregate the clients based on the criteria of the regulator and its bylaws. NCM does not provide any advisory service; the material published does not constitute advice or a recommendation for a transaction in any financial instrument. NCM accepts no responsibility for any use of the content presented and any consequences of that use. Anyone acting on the information provided does so at their own risk.