
- Contact Us:
-

-

-

-


Daily Market Updates
15 Sep 2023
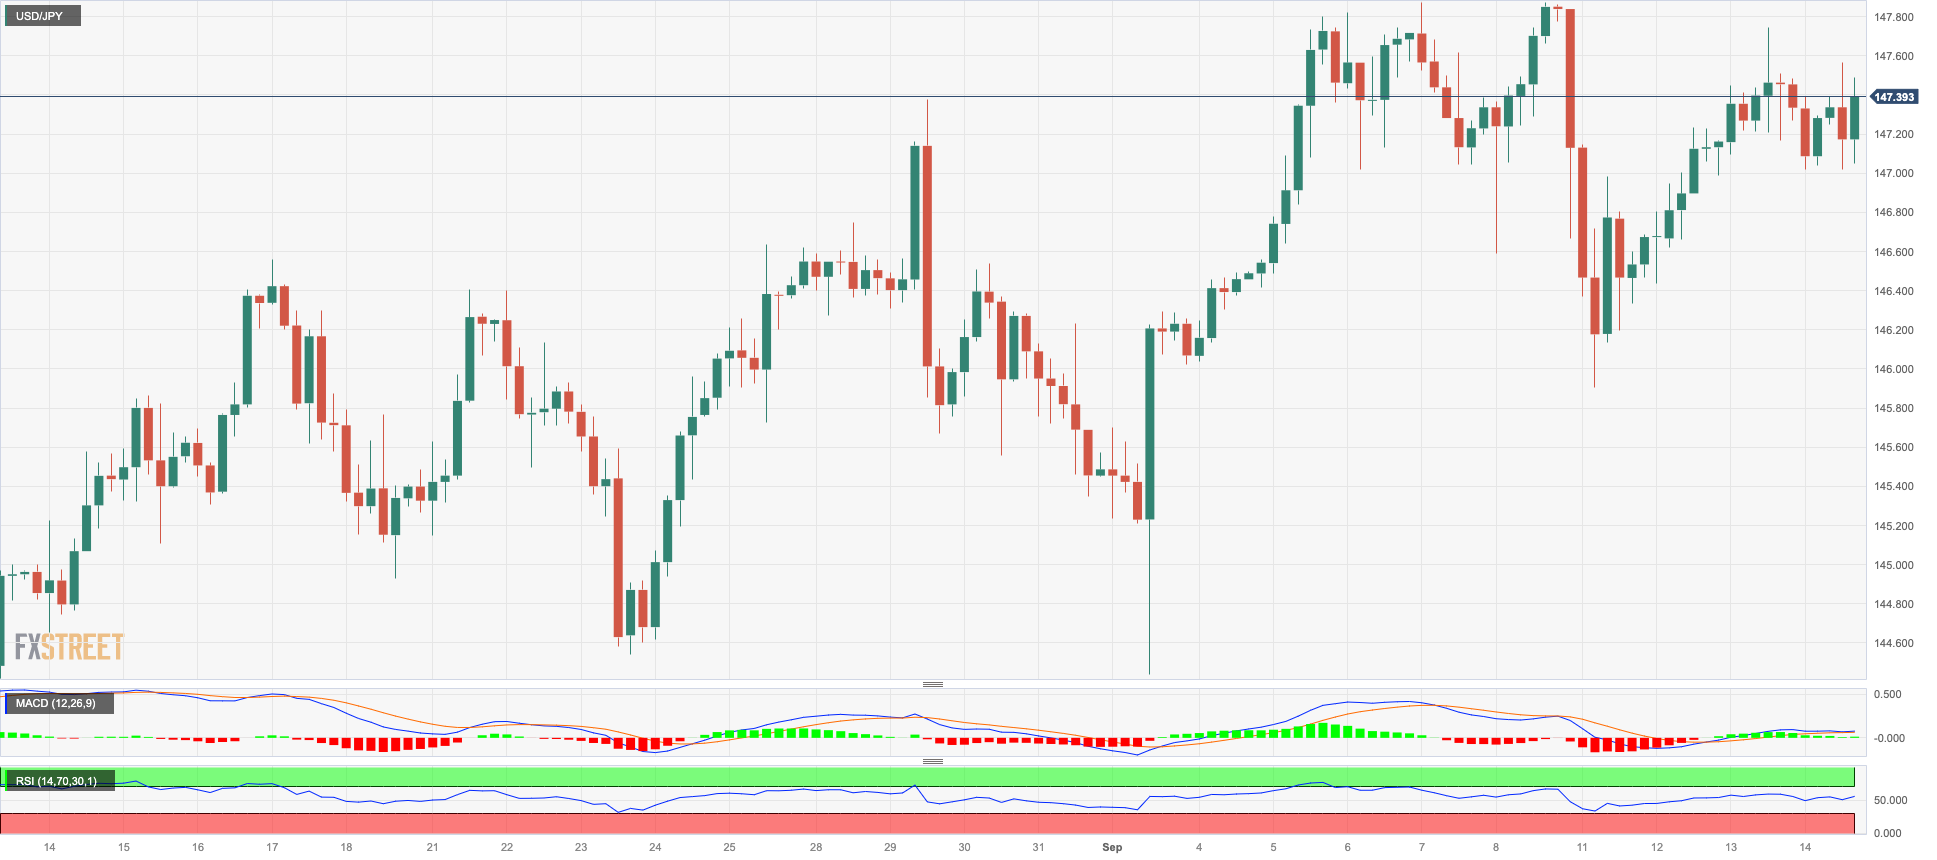
USDJPY
The pronounced advance in the dollar coupled with the moderated rebound in US yields across many maturities vs. further consolidation in JGB 10-year yields appears to have sponsored the rebound in USD/JPY from daily lows near 147.00 to the 147.40 region towards the end of the NA session.
In the Japanese docket, Foreign Bond Investment increased to ¥3631.9B in the week to September 9. Additionally, Machinery Orders contracted 13% YoY in July, and Industrial Production dropped 2.3% YoY in the same month.
If the USD/JPY moves over the 2023 high of 147.87 (September 7), it will very certainly meet the 2022 top of 151.95 (October 21). On the opposite side, the September low of 144.43 (September 1) takes priority over the 55-day SMA of 143.79 prior to the August low of 141.50 (August 7). If this level is violated, the pair might target the weekly low of 138.05 (July 28), which is propped up by the 200-day SMA at 137.27. A lower retracement might endanger the weekly low of 133.01 (April 26), as well as the lower levels of 132.01 (April 13) and 130.62 (April 5). On the daily chart, the RSI settled around the 60 zone.
Resistance levels: 147.74 147.87 148.45 (4H chart)
Support levels: 145.89 145.39 144.43 (4H chart)
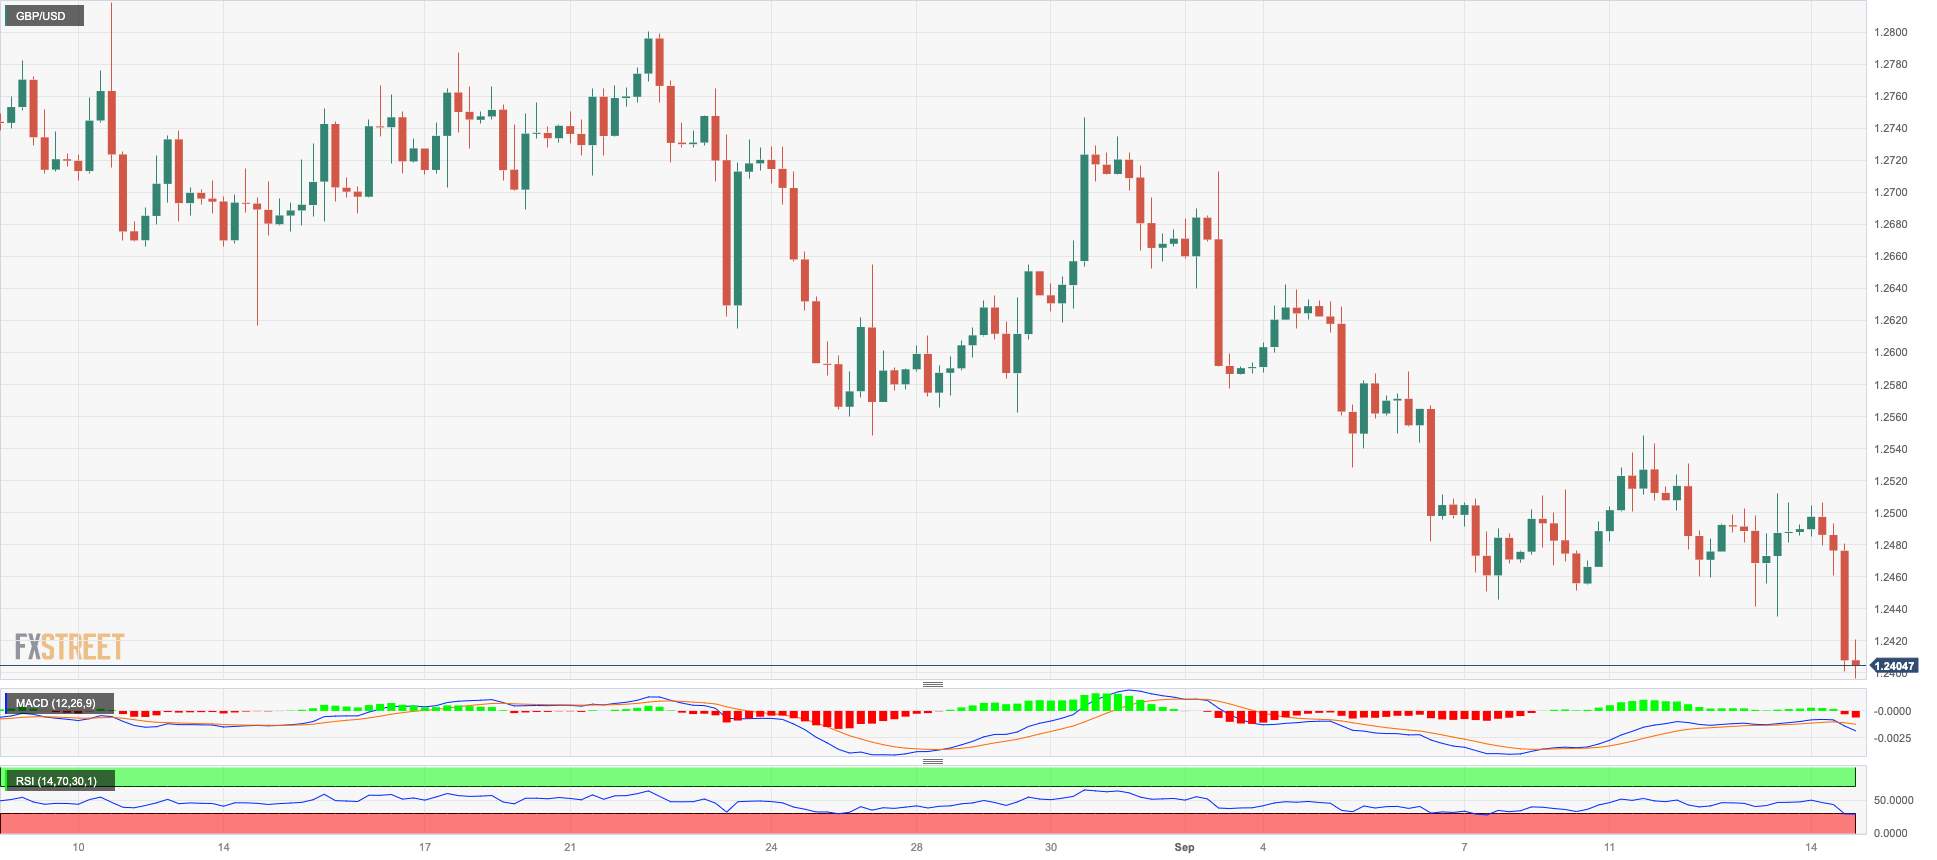
GBPUSD
In line with the rest of the risk-linked galaxy, the British pound succumbed to the strong rebound in the greenback and encouraged bears to push GBP/USD to three-month lows just below the 1.2400 support on Thursday.
In the meantime, the greenback advanced to fresh multi-month peaks on the back of firmer results from the US calendar and a decent rebound in US yields across the curve.
Returning to the realm of monetary policy, there is approximately a 73% likelihood that the Bank of England will implement a quarter-point interest rate hike during its meeting on September 21, with a probable pause in early November.
In the UK, the RICS House Price Balance dropped to 68% in August, which was the sole release on the calendar.
GBP/USD broke below the key 200-day SMA at 1.2430, opening the door to extra losses in the short-term horizon. Against that, the immediate contention zone appears around 1.2400, where the 2021-2023 trendline sits and also coincides with the September low (1.2396). If this zone is breached, the June low at 1.2368 (June 5) could be reached before the May low at 1.2308 (May 25). Instead, Cable has the opportunity to recapture the temporary 100-day SMA at 1.2653 ahead of the weekly high at 1.2746 (August 30), which seems to be supported by the transitory 55-day SMA (1.2737). Weekly tops north of this are at 1.2818 (August 10) and 1.2995 (July 27), just a few pips short of the psychological threshold of 1.3000. The RSI on the daily chart dropped to the proximity of 31.
Resistance levels: 1.2548 1.2587 1.2642 (4H chart)
Support levels: 1.2396 1.2368 1.2308 (4H chart)
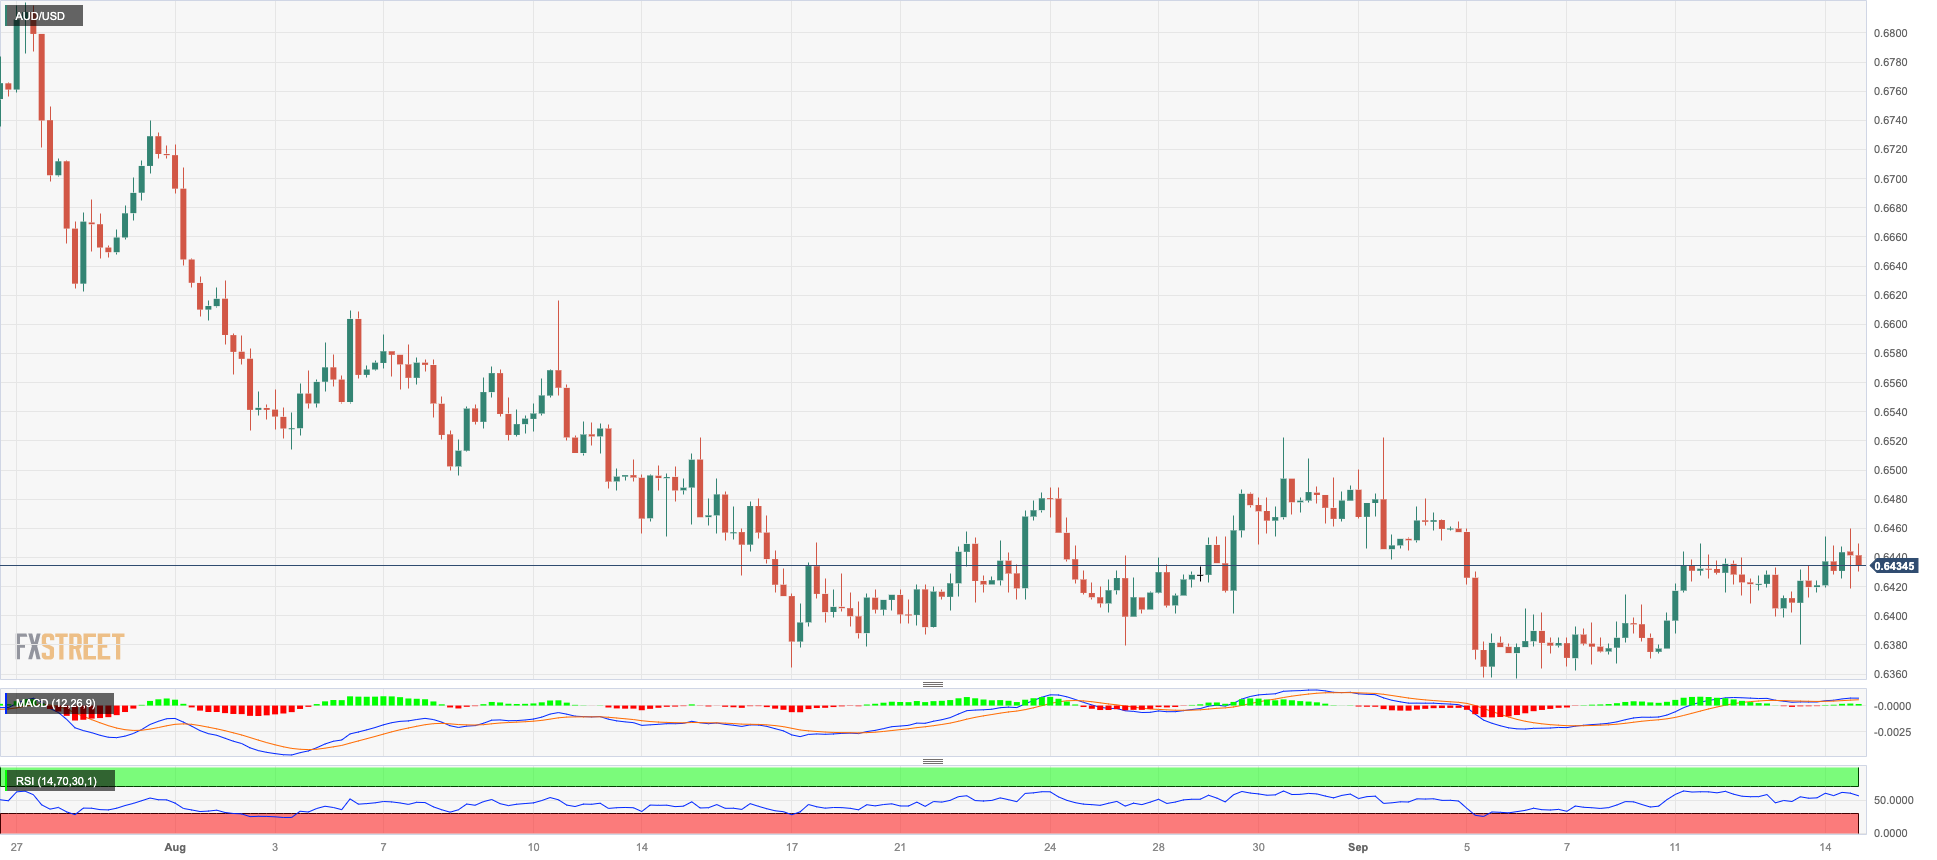
AUDUSD
AUD/USD rose to multi-day highs near 0.6460 before easing a tad and concluding Thursday’s session with decent gains above the 0.6400 hurdle.
The positive performance of the Aussie dollar came in contrast to the intense move higher in the greenback, which appears to have been bolstered instead by the firm session in the commodity universe and news that the PBoC could boost liquidity amidst further efforts to ignite the economic recovery.
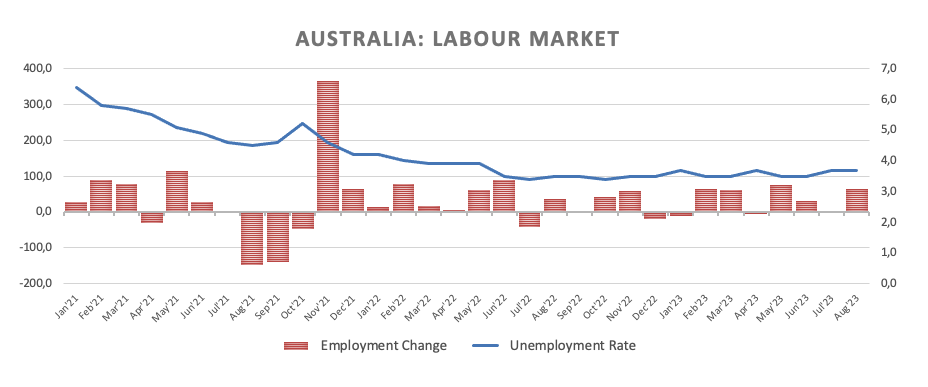
Extra support for the Australian currency also came from the domestic docket, where an upbeat jobs report showed the Employment Change increased by 64.9K individuals in August and the jobless rate held steady at 3.7%. In addition, Consumer Inflation Expectations eased to 4.6% for the current month (from 4.9%), according to the Melbourne Institute.
The 2023 low at 0.6357 (September 5) is immediately down for AUD /USD, followed by the November 2022 low at 0.6272 (November 7) and the 2022 low at 0.6179 (October 13). Immediate resistance, however, is found at the weekly high of 0.6522 (August 30), ahead of another weekly top of 0.6616 (August 10) and the 200-day SMA at 0.6705. Further gains could see the pair regain the July high of 0.6894 (July 14), before the June peak of 0.6899. (16 June) and the critical milestone of 0.7000. Further north aligns the weekly top of 0.7029 (February 14) and the 2023 high of 0.7157 (February 2). The RSI on the daily chart ticked higher to the 46 area.
Resistance levels: 0.6459 0.6521 0.6616 (4H chart)
Support levels: 0.6380 0.6357 0.6272 (4H chart)
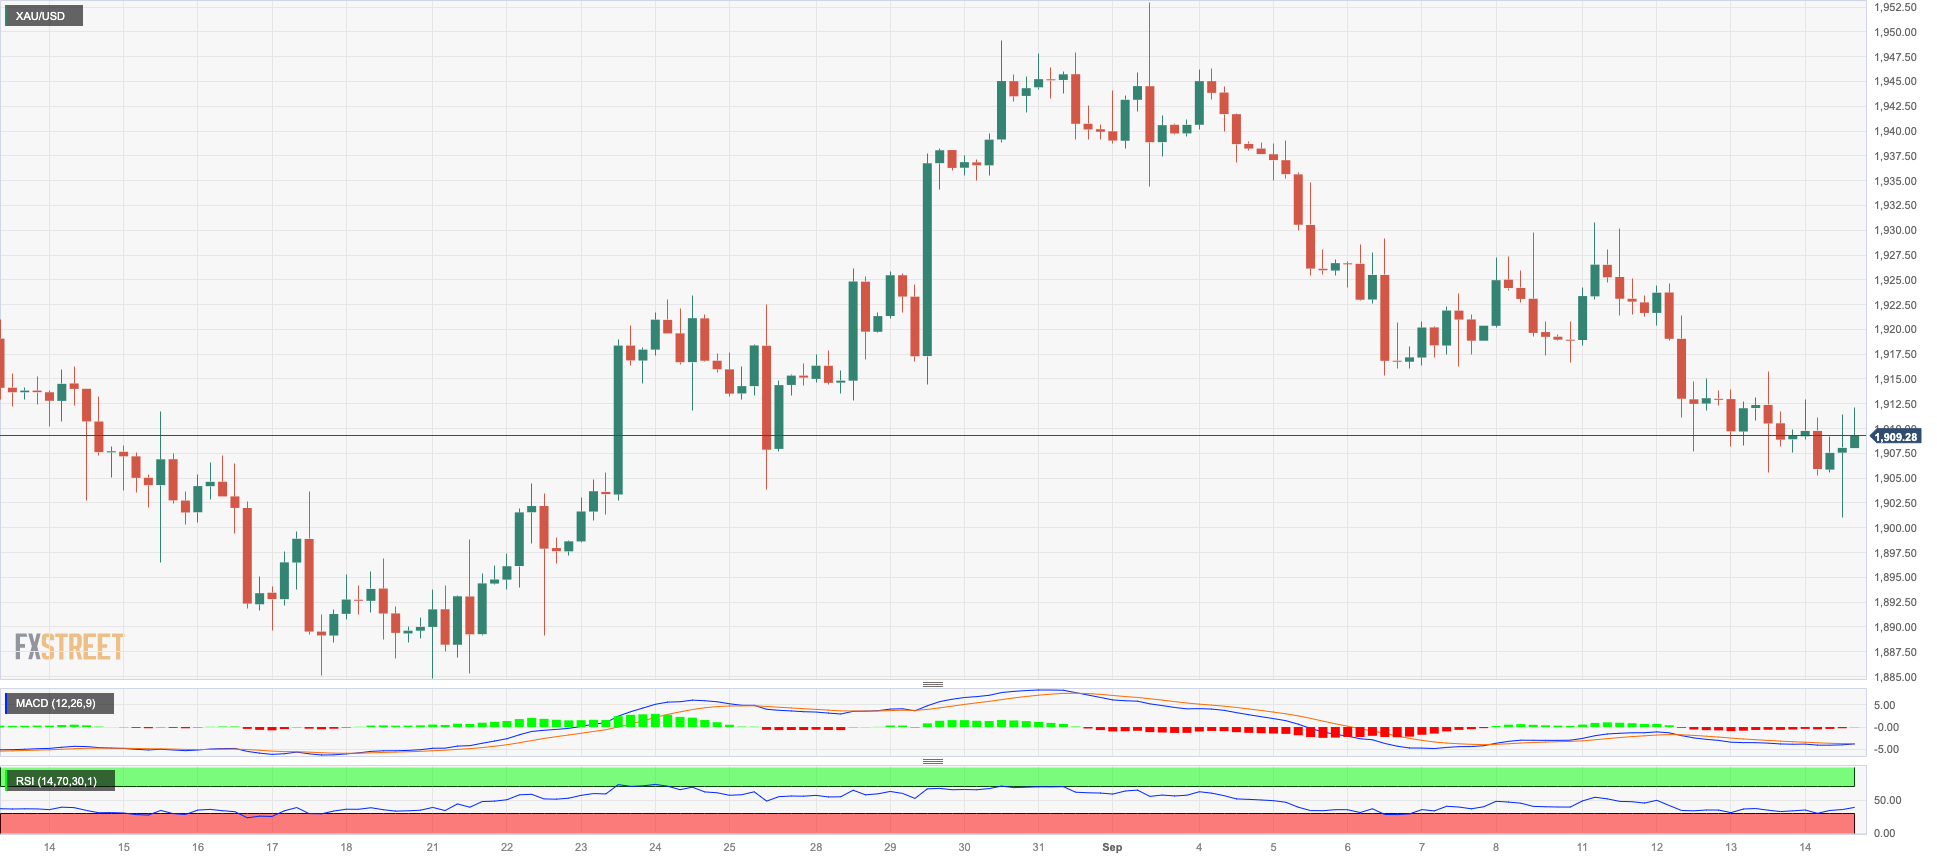
GOLD
Gold prices unexpectedly charted a positive session and set aside two daily pullbacks in a row on Thursday.
The surprising uptick in the precious metal came despite the pronounced upside momentum in the greenback, which lifted the USD Index (DXY) to new multi-month tops, and the marked bounce in US yields across the curve.
The upcoming potential source of uncertainty for bullion is the scheduled FOMC meeting on September 20, during which the Federal Reserve is widely expected to maintain the status quo with regard to the Fed Funds Target Range (FFTR).
A further slide may send gold back to $1900 before reaching the August low of $1885 (August 17) and the 2023 bottom of $1804 (February 28), all of which are ahead of the important $1800 support. Aside from that, the 100-day SMA ($1947) appears to be keeping the September high of $1953 in place (September 1). A breakout of this zone might take us to the July high of $1987 (July 20), which is just below the psychological $2000 barrier. Further up from this region might pave the way for a challenge to the 2023 peak of $2067 (May 4), the 2022 top of $2070 (March 8), and the all-time high of $2075 (August 7, 2020).
Resistance levels: $1921 $1930 $1953 (4H chart)
Support levels: $1901 $1884 $1804 (4H chart)
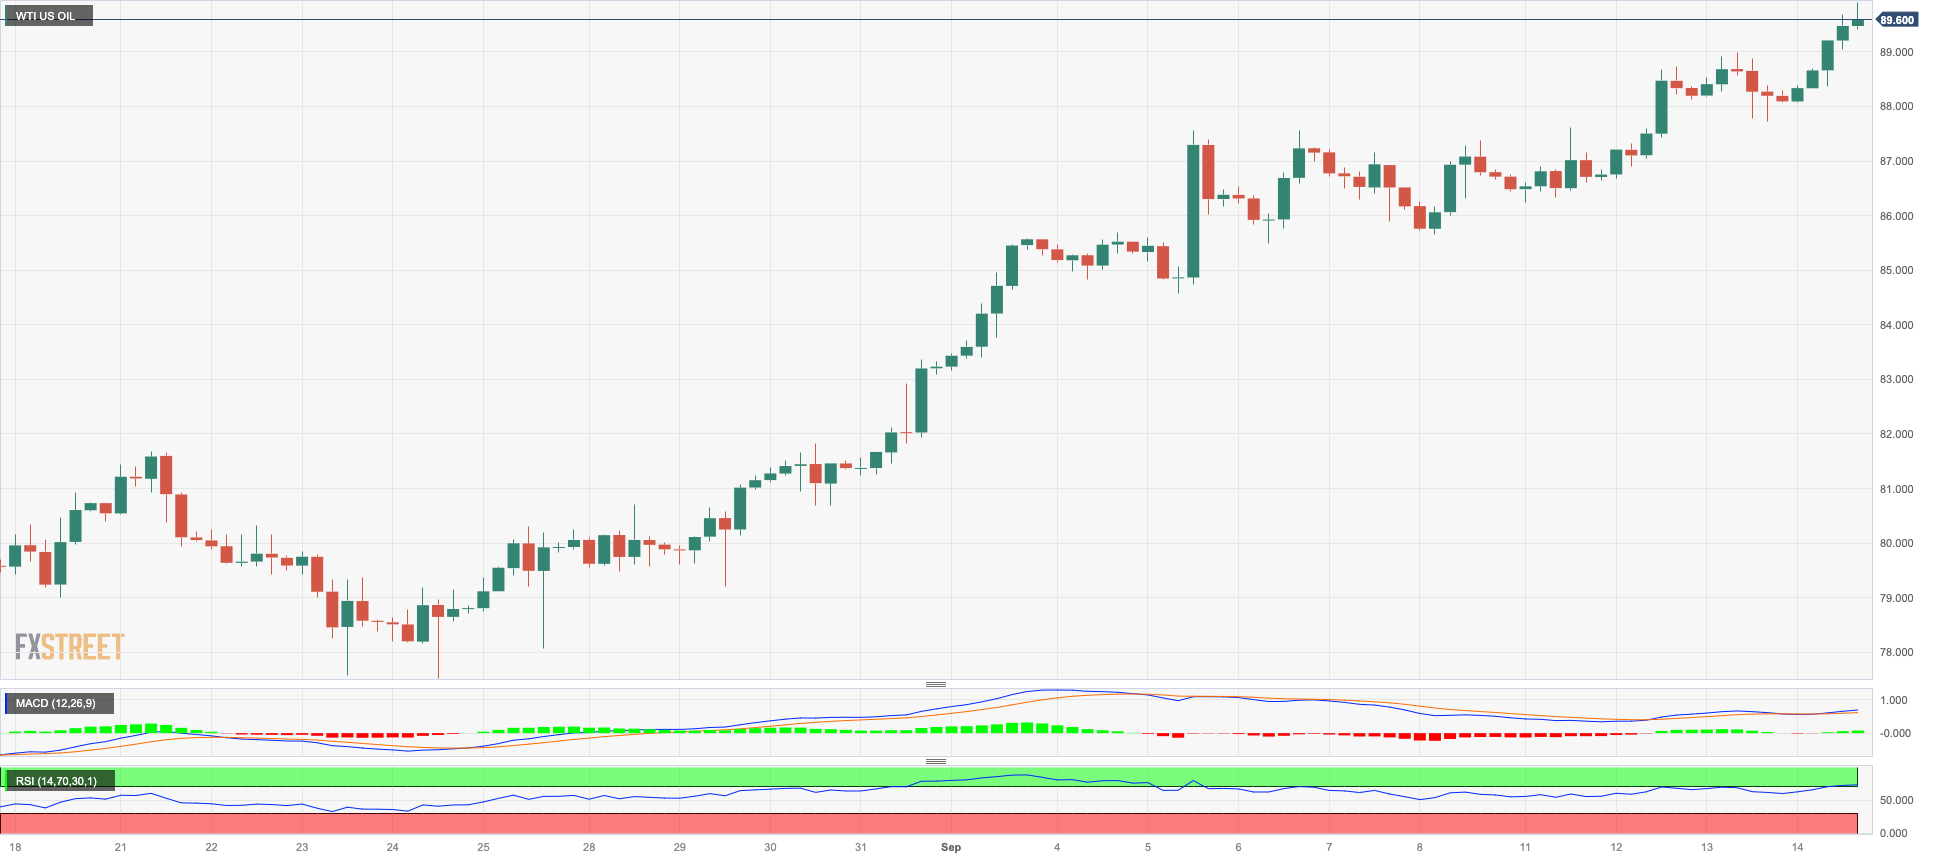
CRUDE WTI
The rally in WTI prices remained unabated on Thursday, advancing to levels last traded in early October 2022, north of the $90.00 mark per barrel.
The intense upside bias in prices of crude oil remained well supported by the tight supply narrative once again, which in turn was further underpinned by the IEA’s report projecting a deficit in the market in the next few months.
The above seems to have been enough to offset some mild selling pressure that could have emerged in response to the unexpected build in US crude oil supplies last week, as reported by the EIA on Wednesday.
Considering recent developments in WTI price movements, the immediate obstacle to the upward trend now appears to be the peak of November 2022 at $93.73 (November 7) ahead of the weekly top of $97.65 (August 30, 2022) and the crucial milestone of $100.00 per barrel. Conversely, the initial support is evident at the 55-day SMA at $80.10, followed by the August low of $77.64 (August 24) and the significant 200-day SMA at $76.41. A breach of this zone could prompt a re-evaluation of the weekly lows at $73.89 (July 17) and $66.86 (June 12), both coming before the 2023 low of $63.61 (May 4). Just above the pivotal $60.00 level is the December 2021 low at $62.46 (December 2).
Resistance levels: $90.38 $93.73 $97.65 (4H chart)
Support levels: $87.31 $84.99 $82.12 (4H chart)
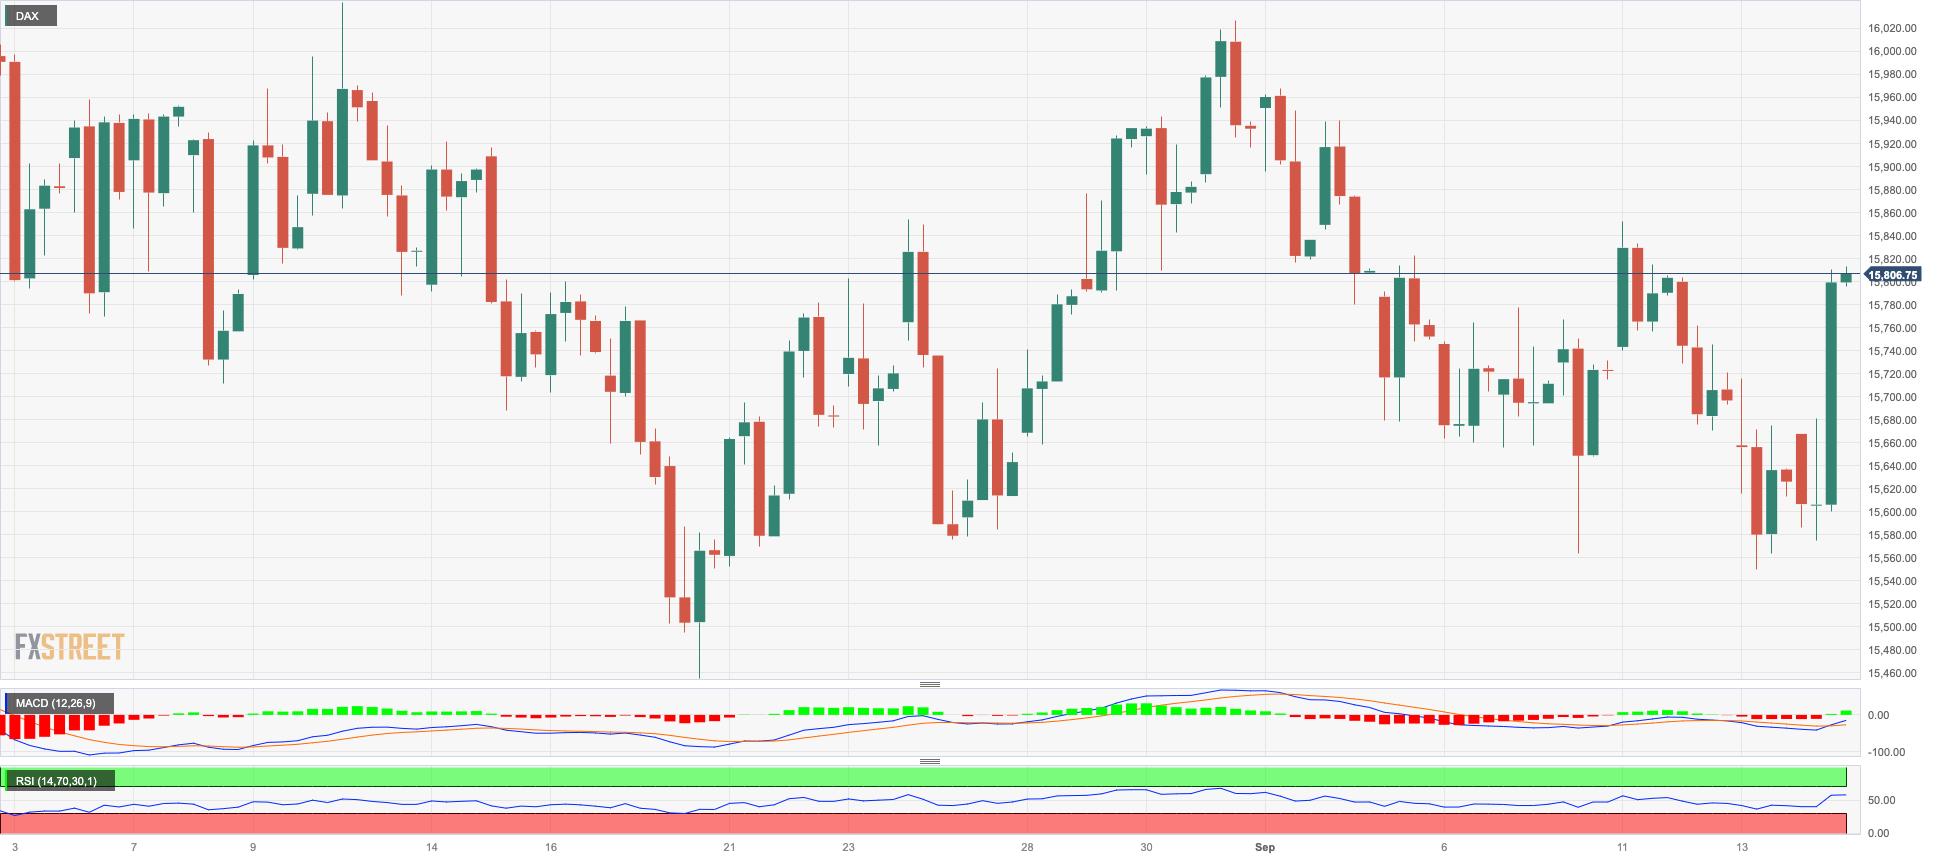
GER40
The German stock benchmark DAX40 rose to three-day highs before receding to the 15800 region and closing Thursday’s session with noticeable gains after two daily pullbacks in a row.
Investors reacted positively to the ECB’s dovish hike after it raised the Deposit Facility Rate for the 10th meeting in a row, this time to 4.00%, and particularly after the central bank seems to have hinted at the idea that it might be done hiking rates.
The sharp uptick in equities contrasted with the 10 bps drop in 10-year bund yields in the last couple of days.
In case the rebound in the DAX40 gathers more serious traction, it could then revisit the temporary resistance barrier at the 55-day SMA at 15914, before encountering the weekly highs of 16042 (August 31) and 16060 (August 10). Should a breakout occur above the latter level, it could redirect investors' focus towards a potential challenge of the all-time high of 16528 (July 31). On the flip side, there is immediate contention at the August low of 15468 (August 18), which appears to have support from the 200-day SMA at 15508 and is above the July low of 15456 (July 7). If the index drops below this level, it could then potentially challenge the March low of 14458 (March 20), followed by the December 2022 low of 13791 (December 20) and the 2022 low of 11862 (September 28). The daily RSI climbed to the boundaries of the 50 threshold.
Best Performers: Vonovia, Siemens Energy AG, Merck
Worst Performers: Dr Ing hc F Porsche Prf, Henkel VZO, BMW ST
Resistance levels: 15867 16042 16060 (4H chart)
Support levels: 15564 15468 15456 (4H chart)
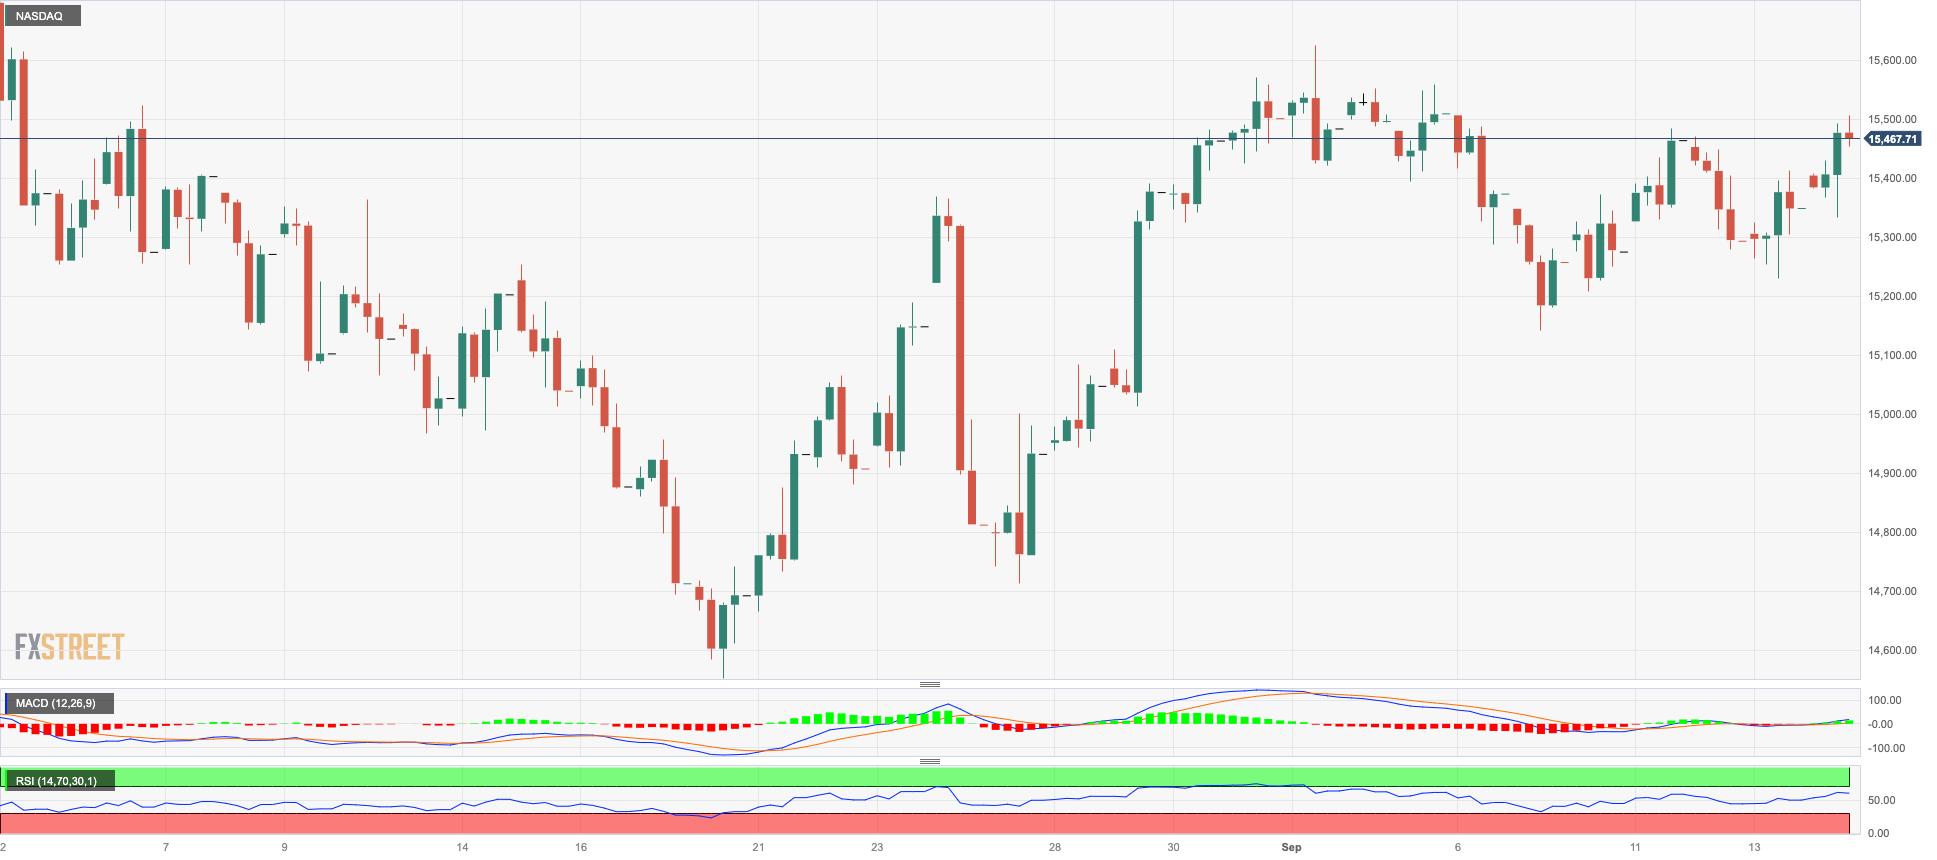
NASDAQ
The key tech index Nasdaq 100 added to Wednesday’s gains and advanced to multi-session peaks around the 15500 region on Thursday.
Indeed, the positive price action in the index fell in line with their US peers and derived extra support from the solid performance of British chip-maker Arm Holdings in its debut following its IPO.
If the bulls regain control, the Nasdaq 100 should reach the September high of 15618 (September 1) prior to the weekly top of 15803 (July 31). To the north, the 2023 peak at 15932 (July 19) is followed by the round 16000 level. On the opposite side, a small weekly bottom has formed around 14715 (August 25), which seems to be supported by the proximity of the 100-day SMA (14696) and lies ahead of the August low of 14557 (August 18). If this level is breached, the weekly lows of 14283 (June 7) and 13520 (May 24) will be regained ahead of the 200-day SMA of 13385. The RSI improved to the 57 zone.
Top Gainers: Moderna, Sirius XM, Align
Top Losers: Netflix, Old Dominion Freight Line, DexCom
Resistance levels: 15506 15618 15803 (4H chart)
Support levels: 15138 14715 14557 (4H chart)
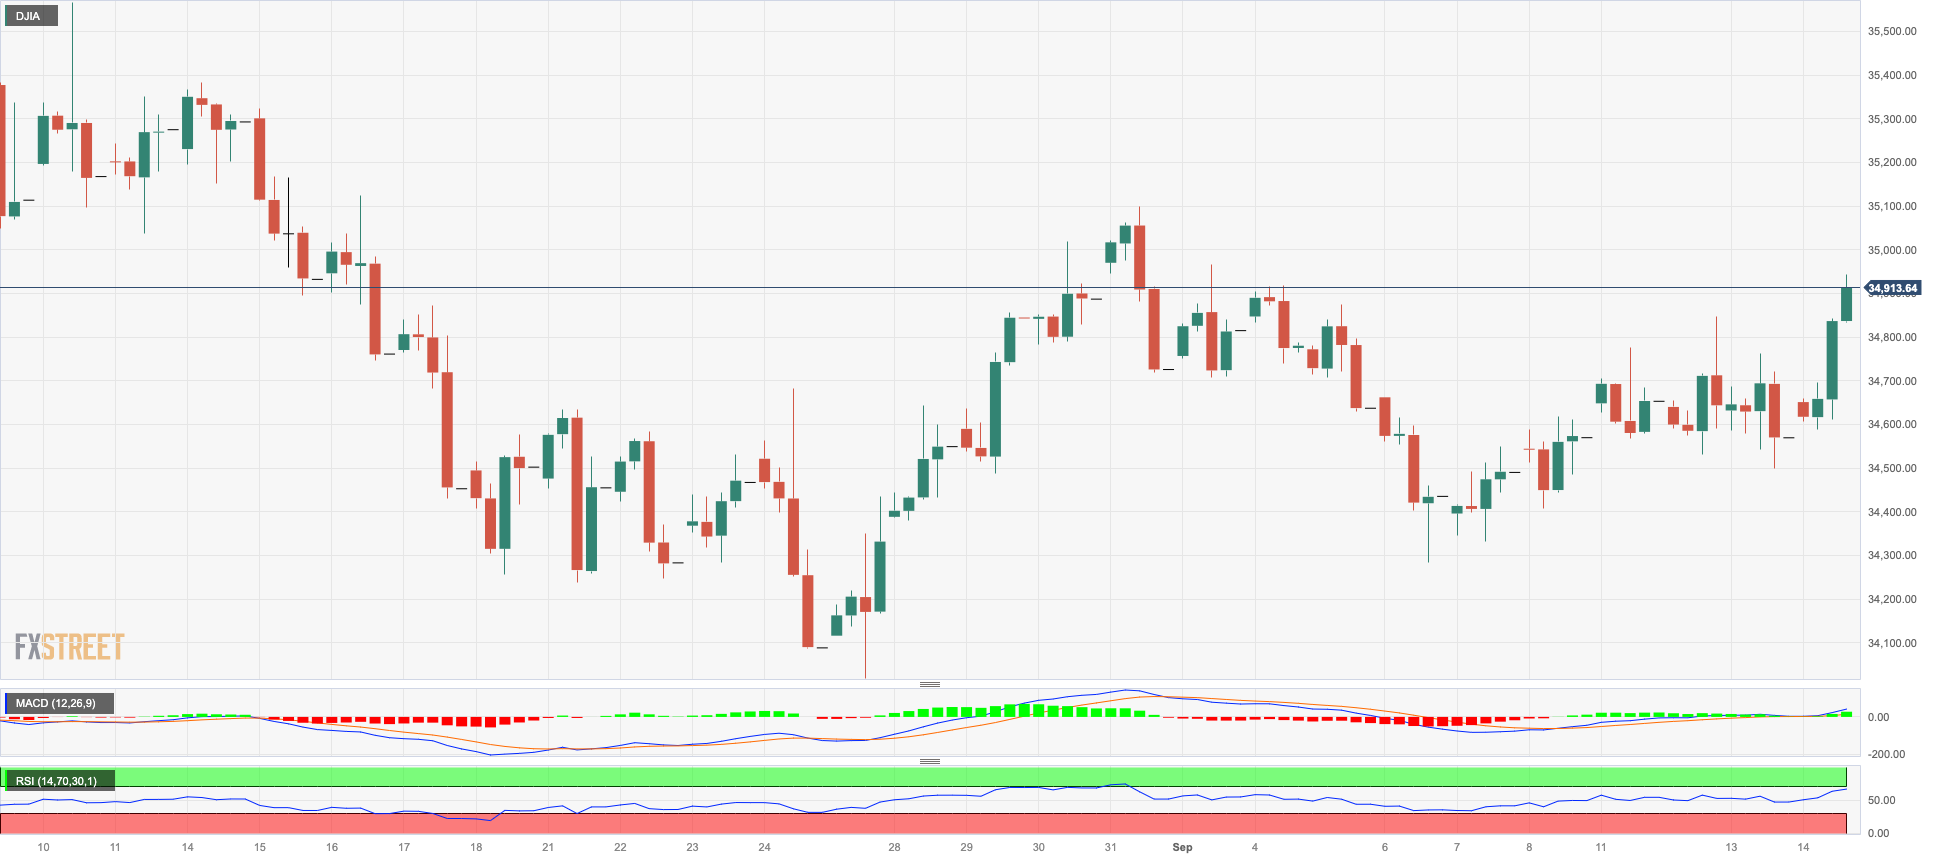
DOW JONES
The US blue-chip reference Dow Jones reversed two straight sessions of losses and gathered strong upside traction on Thursday, approaching the key 35000 threshold, or multi-day tops.
Investors’ optimism stemmed mostly from the firmer-than-expected data releases from the US docket, namely Producer Prices and Retail Sales, while weekly jobless claims also reminded market participants that the labour market remains healthy.
Adding to the above emerged the persevering speculation that the Fed might have ended its tightening cycle back in July and could start cutting rates at any point starting in March 2024.
Meanwhile, the Dow Jones rose 0.98% to 34913, the S&P500 gained 0.89% to 4507, and the tech-benchmark Nasdaq Composite advanced 0.93% to 13942.
The Dow Jones weekly high of 35070 (August 31) is immediately to the upside, seconded by the 2023 top of 35679 (August 1) and the February 2022 peak of 35824 (February 9). The surpass of the latter could lead to an all-time high of 36952 (January 5, 2022). By contrast, a fall below the August low of 34029 (August 25) could lead to a return to the 200-day SMA of 33802, just ahead of the July low of 33705 (July 10). South of here, the May low of 32586 (May 25) is in line with the 2023 low of 31429 (March 15). The everyday RSI leapt past the 55 yardstick.
Top Performers: Goldman Sachs, Caterpillar, Dow
Worst Performers: Visa A, Walt Disney, Salesforce Inc
Resistance levels: 34938 35070 35578 (4H chart)
Support levels: 34291 34029 33705 (4H chart)
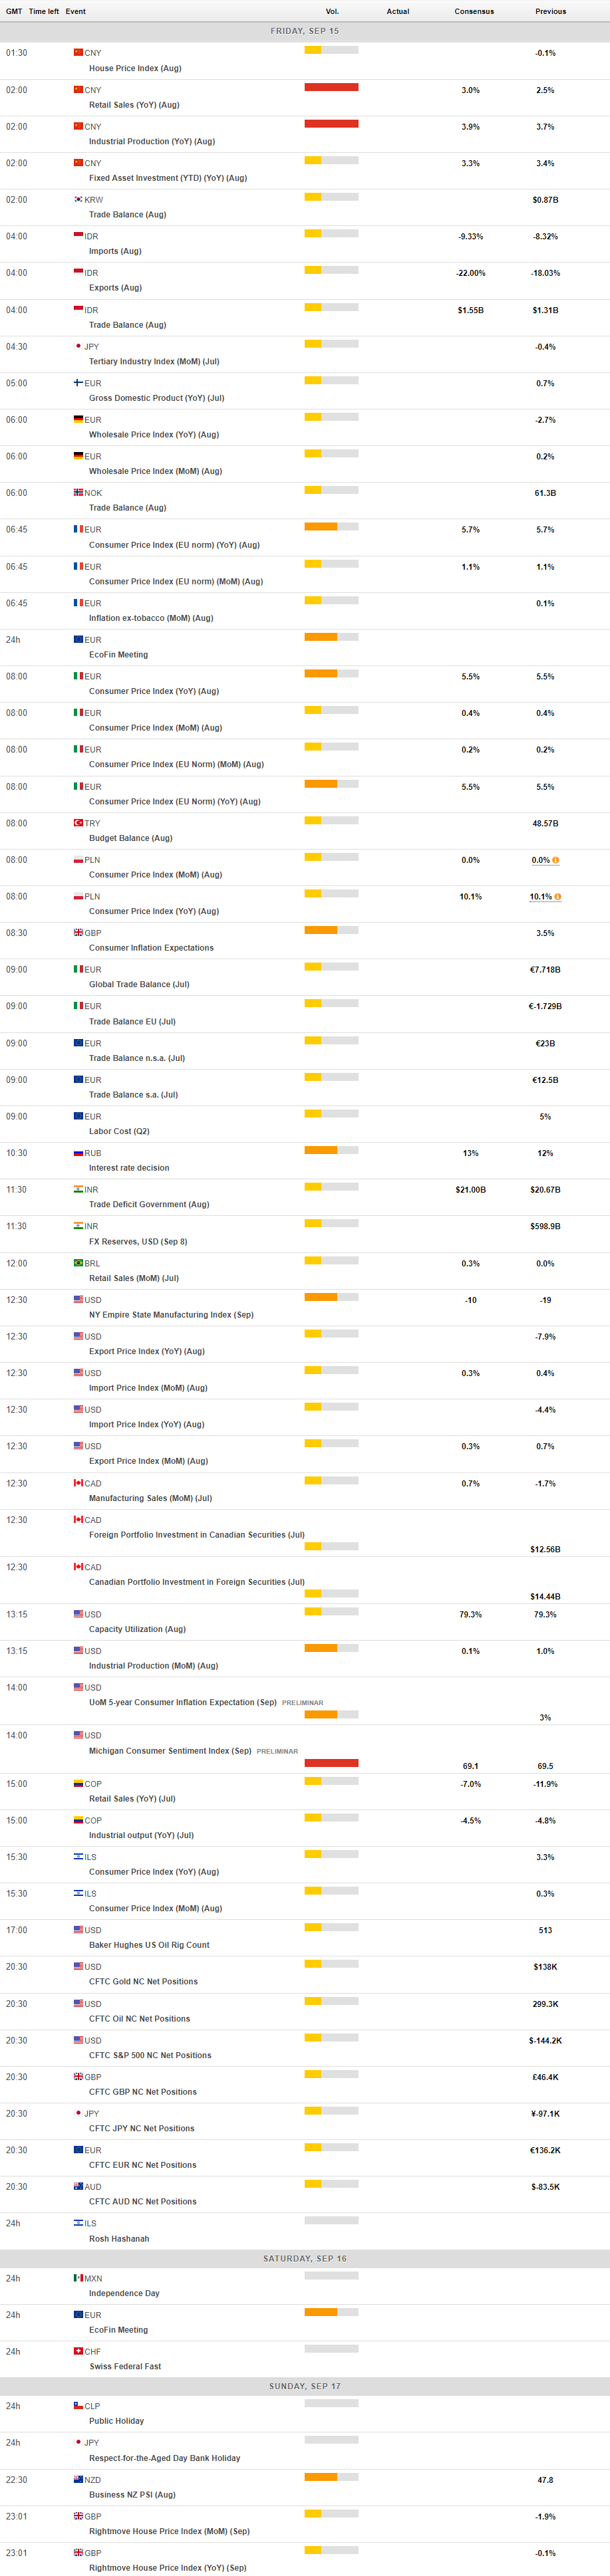
MACROECONOMIC EVENTS
All Information & Updates provided by:

All information relating to the financial markets available on this page has been prepared and issued by FXStreet (Forexstreet SL, Spain, Reg: B62498233) on the basis of publicly available information and all information believed to be reliable and does not conflict with Kuwaiti local laws, and all necessary care has been taken to before the company to ensure that the facts mentioned are correct from the source.
NCM Investment nor any of its directors or employees shall in any way be held responsible for the contents of this news, and the information contained on this page is intended only to provide clients with publicly available information and should not be construed as investment advice, report or analysis and/or constitute an offer or invitation to buy or sell financial instruments of any kind.
RISK WARNING: Forex and CFDs are highly risky leveraged products, as losses can exceed deposits. Please ensure you understand all the risks and take independent advice if necessary. NCM will segregate the clients based on the criteria of the regulator and its bylaws. NCM does not provide any advisory service; the material published does not constitute advice or a recommendation for a transaction in any financial instrument. NCM accepts no responsibility for any use of the content presented and any consequences of that use. Anyone acting on the information provided does so at their own risk.