
- Contact Us:
-

-

-

-


Daily Market Updates
18 Sep 2023
USDJPY
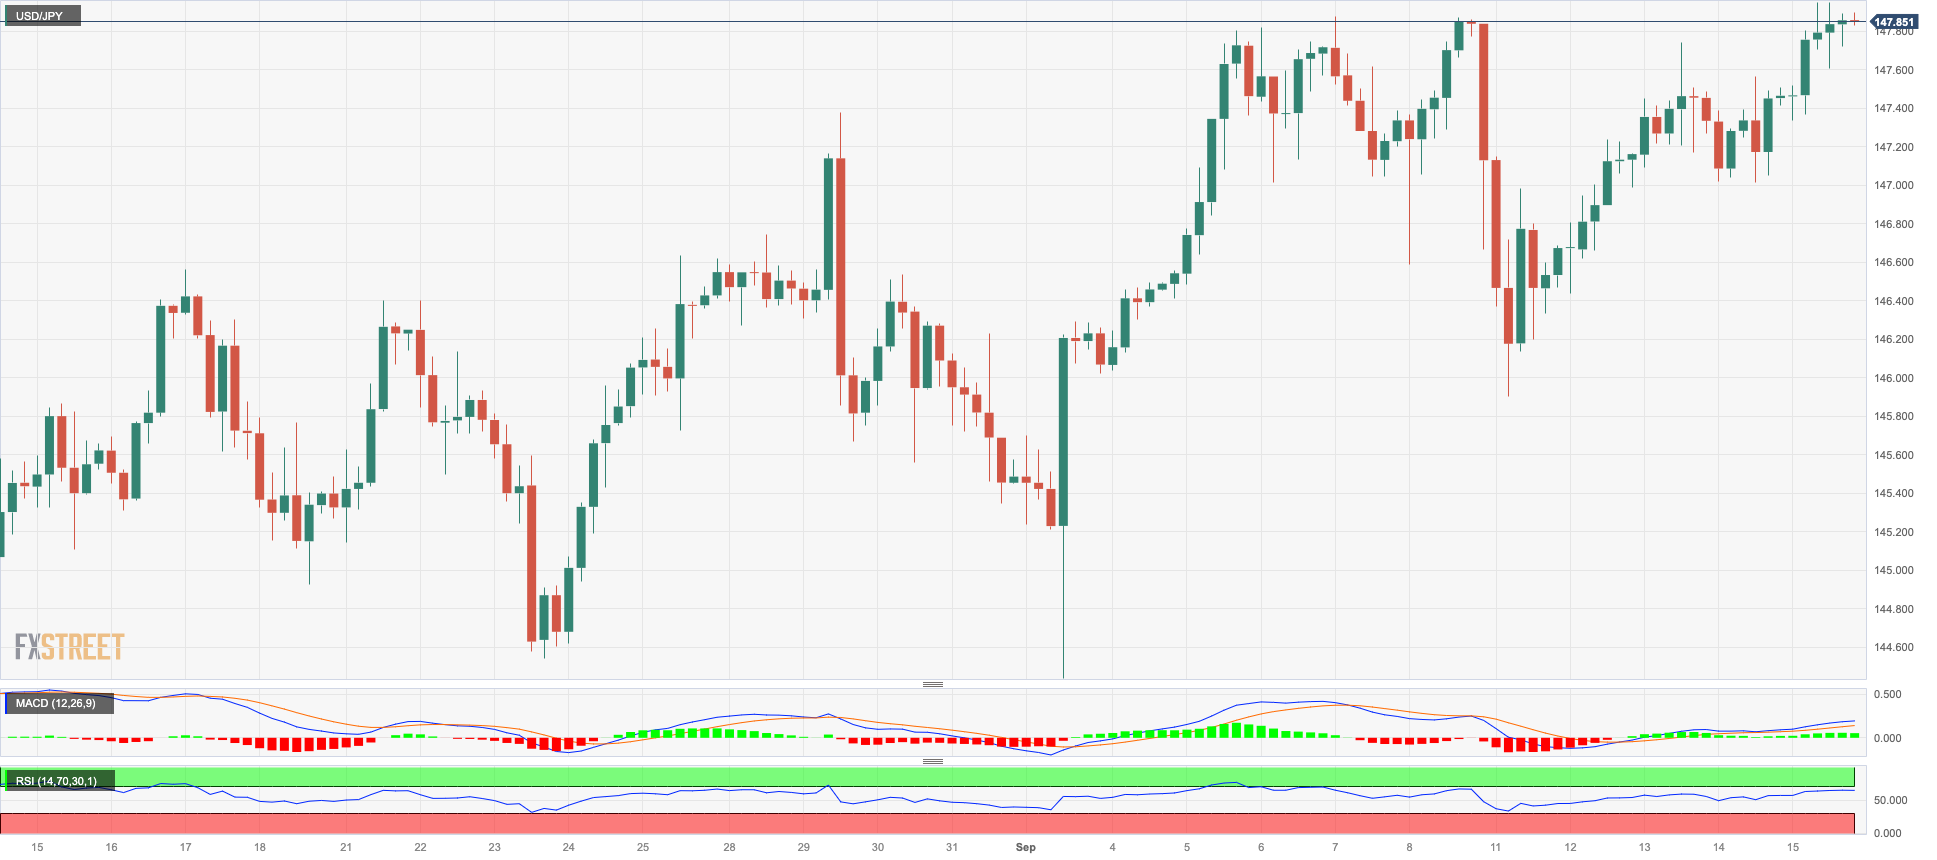
Further upside momentum lifted USD/JPY to a fresh 2023 high of 147.95 on Friday.
The fourth consecutive daily advance in spot appeared underpinned by the bounce in the dollar in the latter part of Friday’s session as well as the continuation of the weekly rebound in US yields across the curve.
Additionally, the Tertiary Industry Index rebounded at a monthly 0.9% in July, which was the sole release of note in the "Land of the Rising Sun".
If USD/JPY moves above the 2023 high of 147.95 (September 15), it could then embark on a potential test of the 2022 top of 151.95 (October 21). On the flip side, the September low of 144.43 (September 1) takes precedence over the 55-day SMA of 143.86 and the August low of 141.50 (August 7). If this level is breached, the pair could challenge the weekly low of 138.05 (July 28) supported by the 200-day SMA at 137.33. A lower retracement could threaten the weekly low of 133.01 (April 26) and the lower levels of 132.01 (April 13) and 130.62 (April 5). On the daily chart, the RSI climbed beyond the 62 level.
Resistance levels: 147.95 148.45 148.84 (4H chart)
Support levels: 145.89 145.57 144.43 (4H chart)
GBPUSD
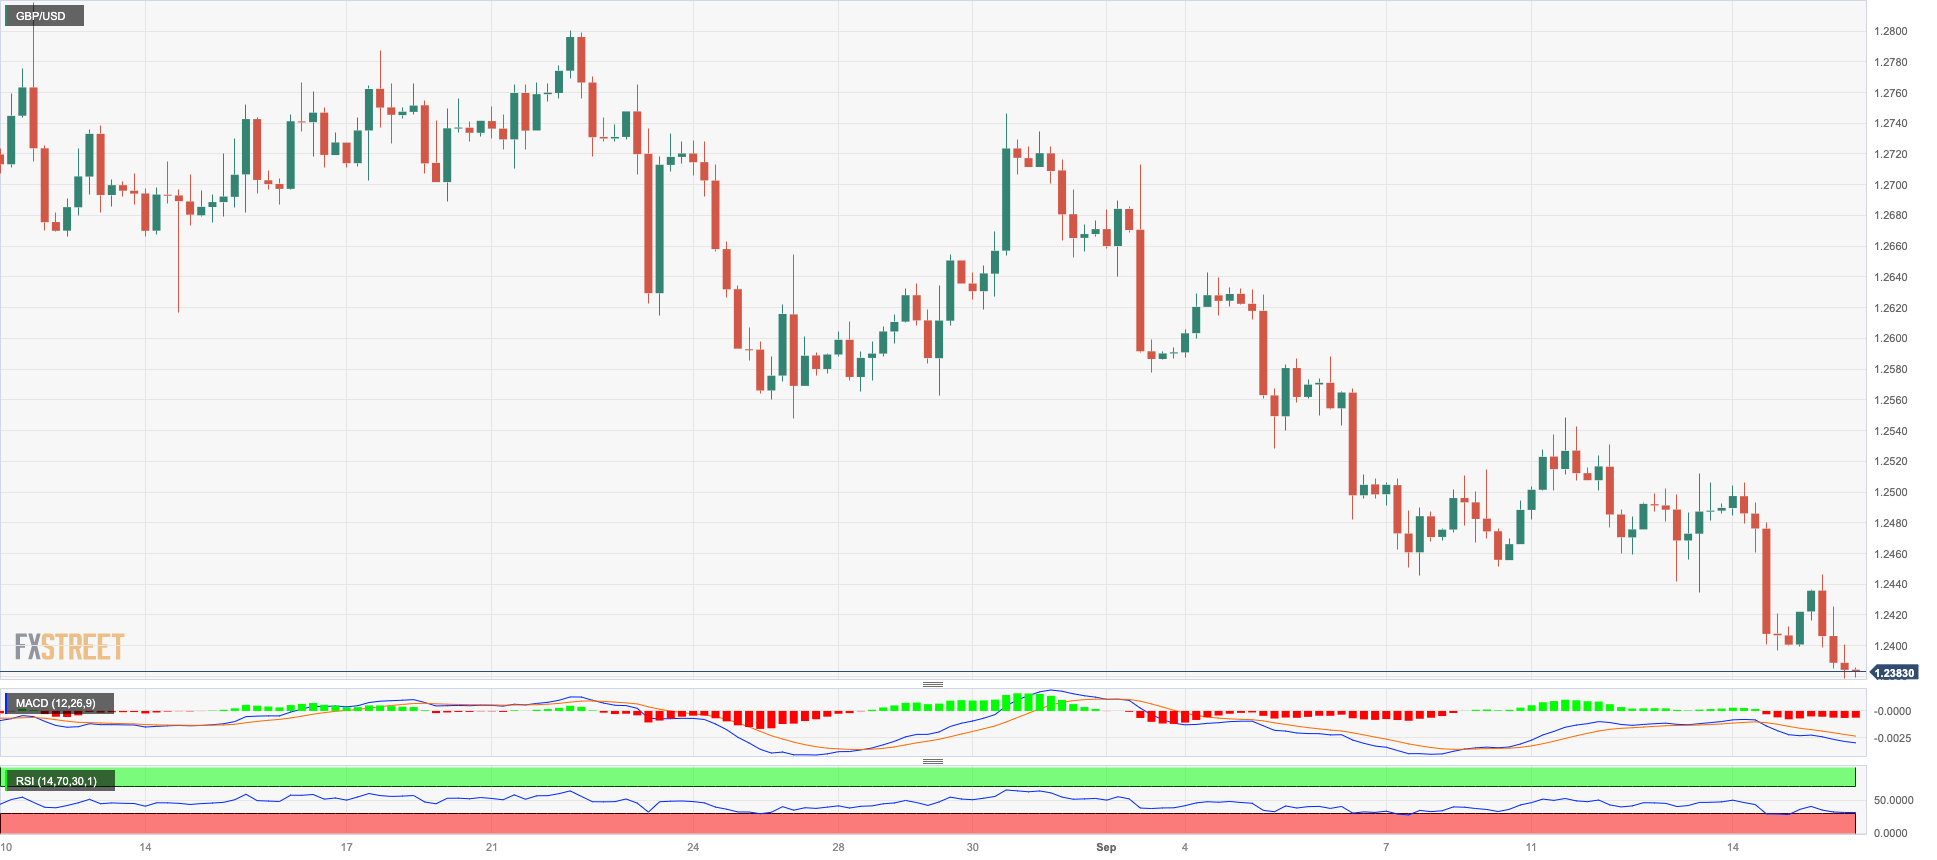
GBP/USD retreated for the second session in a row and dropped to levels last traded in early June in the 1.2380 zone at the end of the week.
In fact, Cable accelerated its losses pari passu with the rebound in the greenback in place since the European midday on Friday in quite an apathetic session and mixed risk appetite trends.
In the meantime, the probability of a 25 bps rate hike by the BoE at its September 21 gathering hovered around 76%, followed by a likely pause at the November event.
There were no data releases scheduled in the UK on Friday.
GBP/USD fell below the crucial 200-day SMA at 1.2430, exposing the likelihood of extra losses in the near term. Indeed, the immediate support emerges at the September low of 1.2378 prior to the June low of 1.2368 (June 5) and the May low of 1.2308 (May 25). Instead, Cable has a chance to reclaim the temporary 100-day and 55-day SMAs at 1.2651 and 1.2731, respectively, before the weekly high at 1.2746 (August 30). Up from here comes the weekly highs at 1.2818 (August 10) and 1.2995 (July 27), only a few pips below the psychological level of 1.3000. The RSI on the daily chart approached the oversold territory near 30.
Resistance levels: 1.2496 1.2548 1.2587 (4H chart)
Support levels: 1.2378 1.2368 1.2308 (4H chart)
AUDUSD
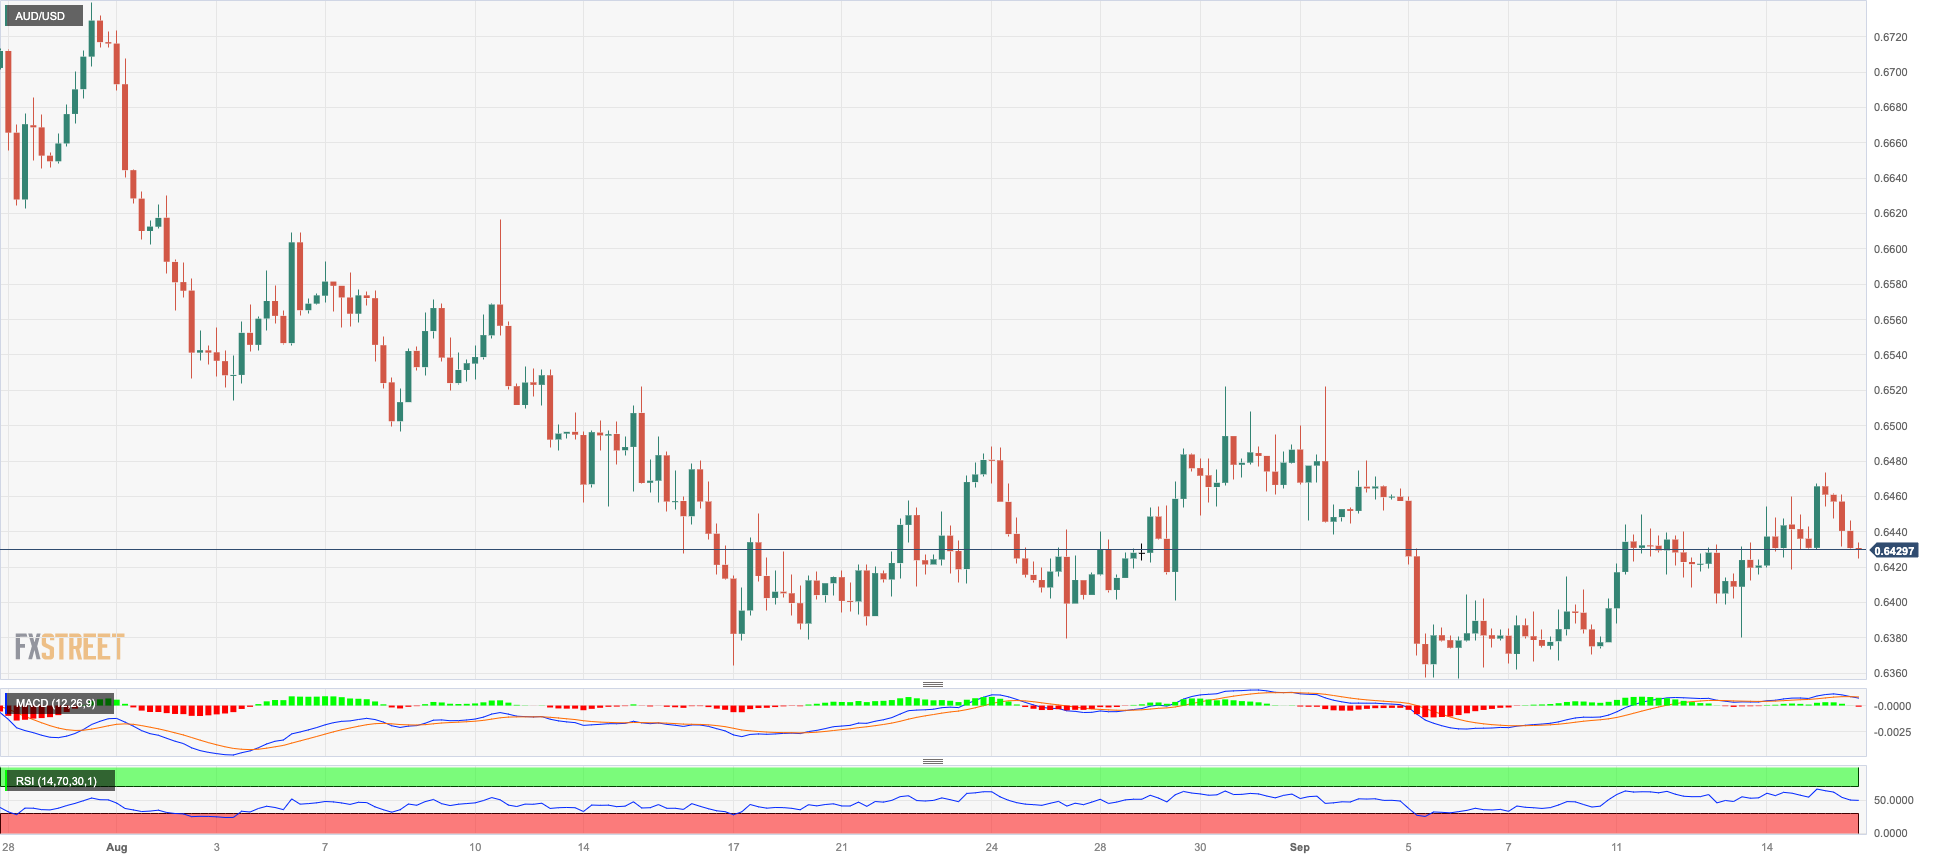
AUD/USD could not sustain the earlier bull run to daily highs past 0.6470 and instead retreated to the 0.6430 zone at the end of the week.
In line with many risk-linked assets, the Aussie dollar succumbed to both the rebound in the greenback and the negative performance of the commodity complex despite the firmer-than-estimated prints from the Chinese calendar seen during early trade.
The Australian docket remained empty on Friday.
The 2023 bottom of 0.6357 (September 5) is immediately lower for the AUD/USD, followed by the November 2022 low of 0.6272 (November 7) and the 2023 low of 0.6179 (October 13). Having said that, immediate resistance is found at the weekly high of 0.6522 (August 30), followed by another weekly top of 0.6616 (August 10) and the 200-day SMA at 0.6703. Further increases might bring the pair back to the July high of 0.6894 (July 14), before the June peak of 0.6899 (16 June) and the key 0.7000 threshold. North from here, the weekly high of 0.7029 (February 14) and the 2023 high of 0.7157 (February 2) are aligned. The day-to-day RSI eased to the 45 area.
Resistance levels: 0.6473 0.6521 0.6616 (4H chart)
Support levels: 0.6380 0.6357 0.6272 (4H chart)
GOLD
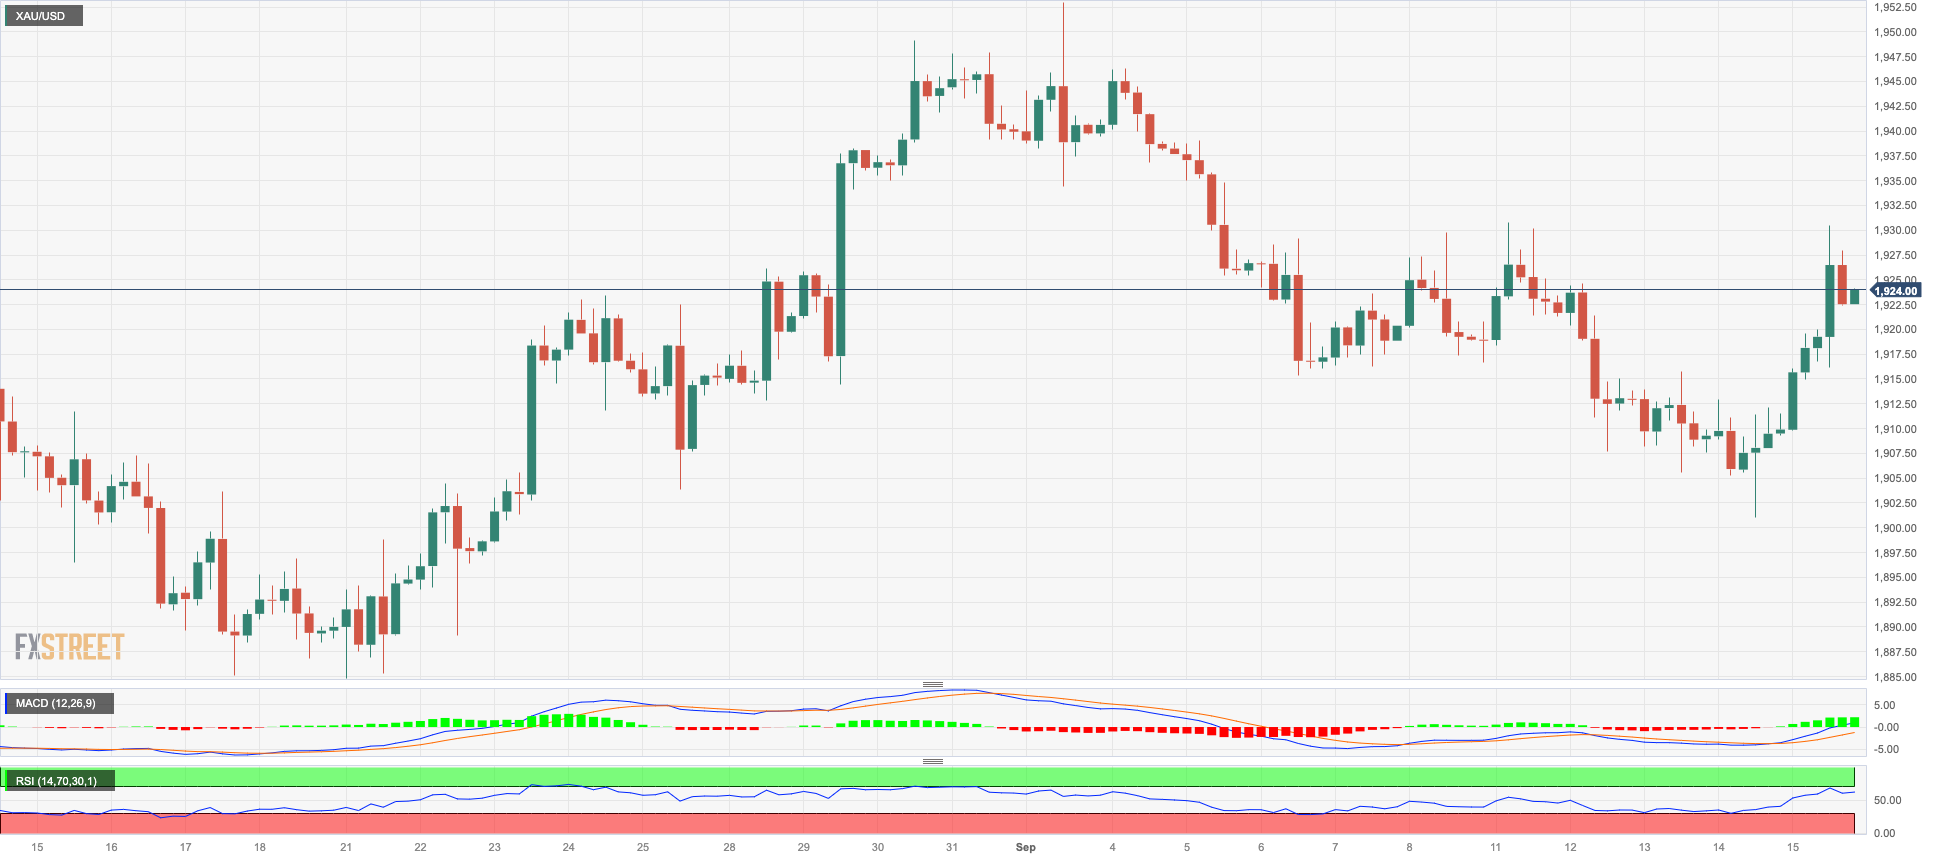
Prices of gold added to Thursday’s uptick and revisited once again the $1930 region per troy ounce on Friday, an area coincident with the temporary 55-day SMA.
Further improvement in the yellow metal came amidst the irresolute price action around the greenback and in spite of the marked advance in US yields across different time frames.
The forthcoming factor that could introduce some uncertainty to the bullion market is the upcoming FOMC gathering on September 20. It is widely anticipated that the Federal Reserve will keep its interest rate unchanged.
Another slide could push gold back to $1900 before reaching the August low of $1885 (August 17) and the 2023 low of $1804 (February 28), all ahead of the key $1800 support. Apart from that, the 100-day SMA at $1946 seems to be keeping the September high of $1953 (September 1) in check. A breakout from this zone could take us to the July high of $1987 (July 20), which is just below the psychological $2000 level. A further rise from this region could pave the way for an assault on the 2023 high of $2067 (May 4), the 2022 top of $2070 (March 8) and the all-time peak of $2075 (August 7, 2020).
Resistance levels: $1930 $1946 $1953 (4H chart)
Support levels: $1901 $1884 $1804 (4H chart)
CRUDE WTI
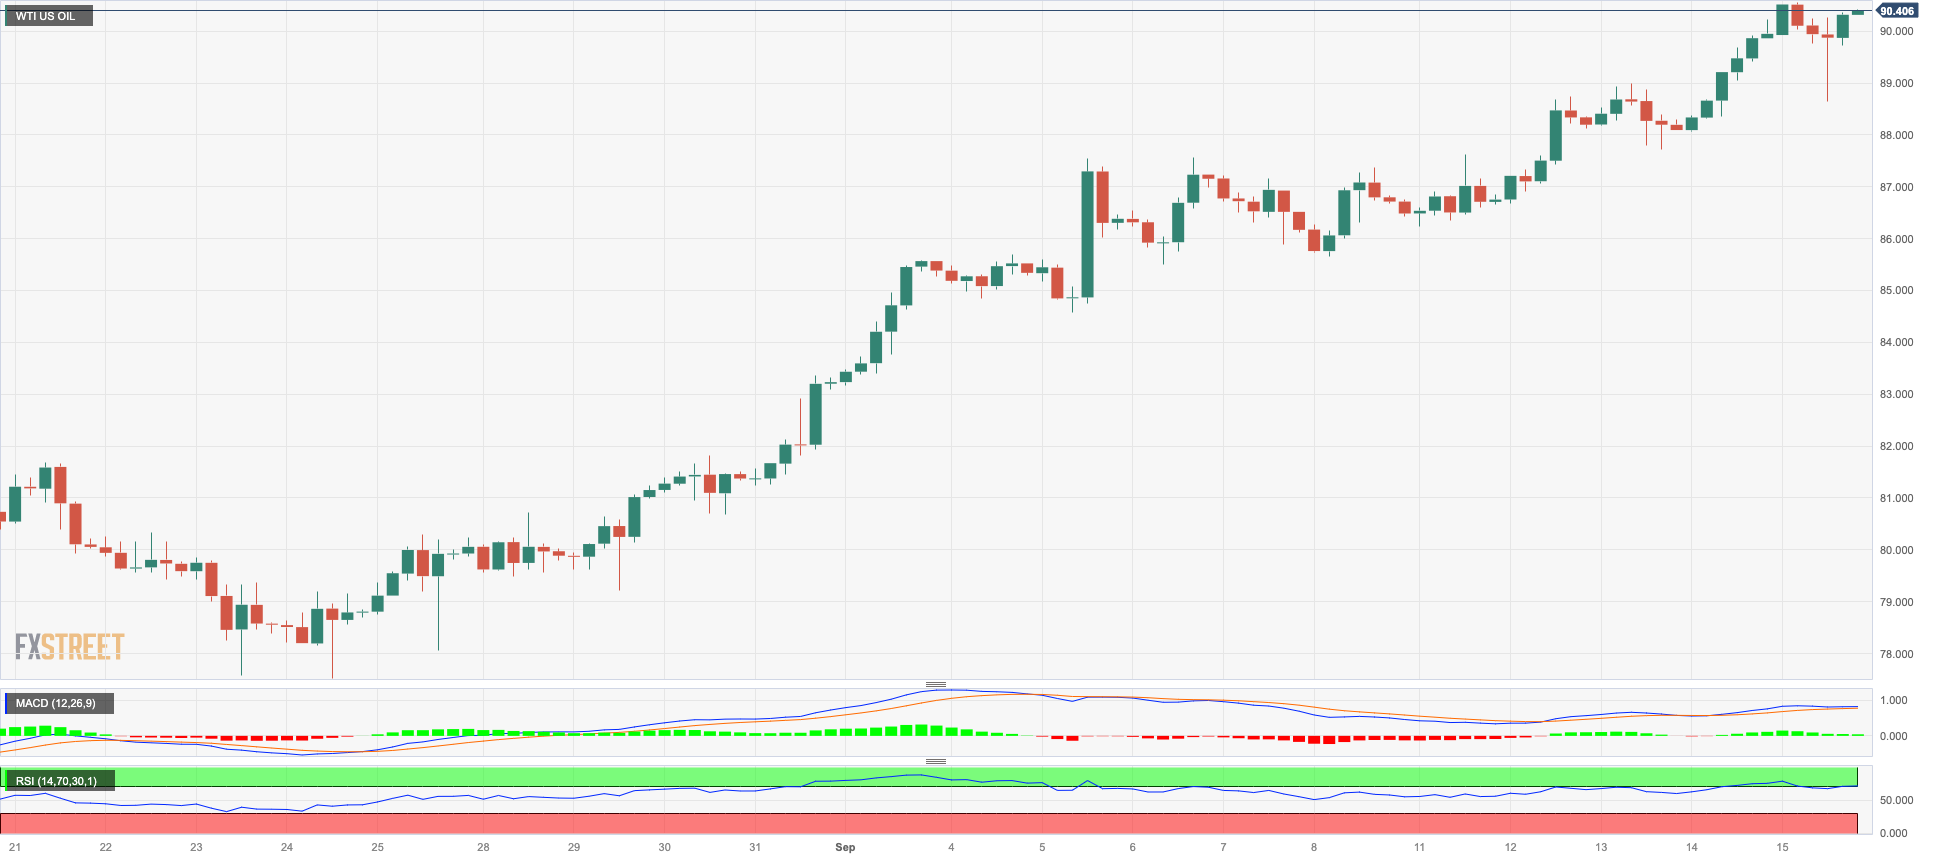
Prices of WTI rose for the sixth consecutive session and reached new 2023 tops past the $91.00 mark per barrel on Friday. Prices of the commodity also closed their third straight week of gains, returning to levels last seen in November 2022.
There were no new catalysts for the continuation of the rally in crude oil prices other than the persistent tight supply narrative and the upbeat mood among traders.
The above remained once again supported by the oil output cut from Saudi Arabia and Russia’s reduction of its crude oil exports, while the latest reports by OPEC and the IEA regarding a stronger demand in the next few months also contributed to the generalized optimism around the commodity.
Closing the weekly calendar, the total number of US oil rigs rose to 515 in the week to September 15, as per the weekly report by driller Baker Hughes.
Given the recent performance of the WTI price, the immediate obstacle to the uptrend now appears to be the November 2022 high of $93.73 (November 7) ahead of the weekly high of $97.65 (August 30, 2022) and the crucial milestone of $100.00 per barrel. Conversely, the first support shows at the 55-day SMA at $80.49, followed by the August low at $77.64 (August 24) and the key 200-day SMA at $76.48. A breakdown of this zone could lead to a reassessment of the weekly lows at $73.89 (July 17) and $66.86 (June 12), both ahead of the 2023 low at $63.61 (May 4). Immediately below appears the December 2021 low at $62.46 (December 2) prior to
the crucial $60.00 mark.
Resistance levels: $91.19 $93.73 $97.65 (4H chart)
Support levels: $89.19 $88.25 $86.12 (4H chart)
GER40
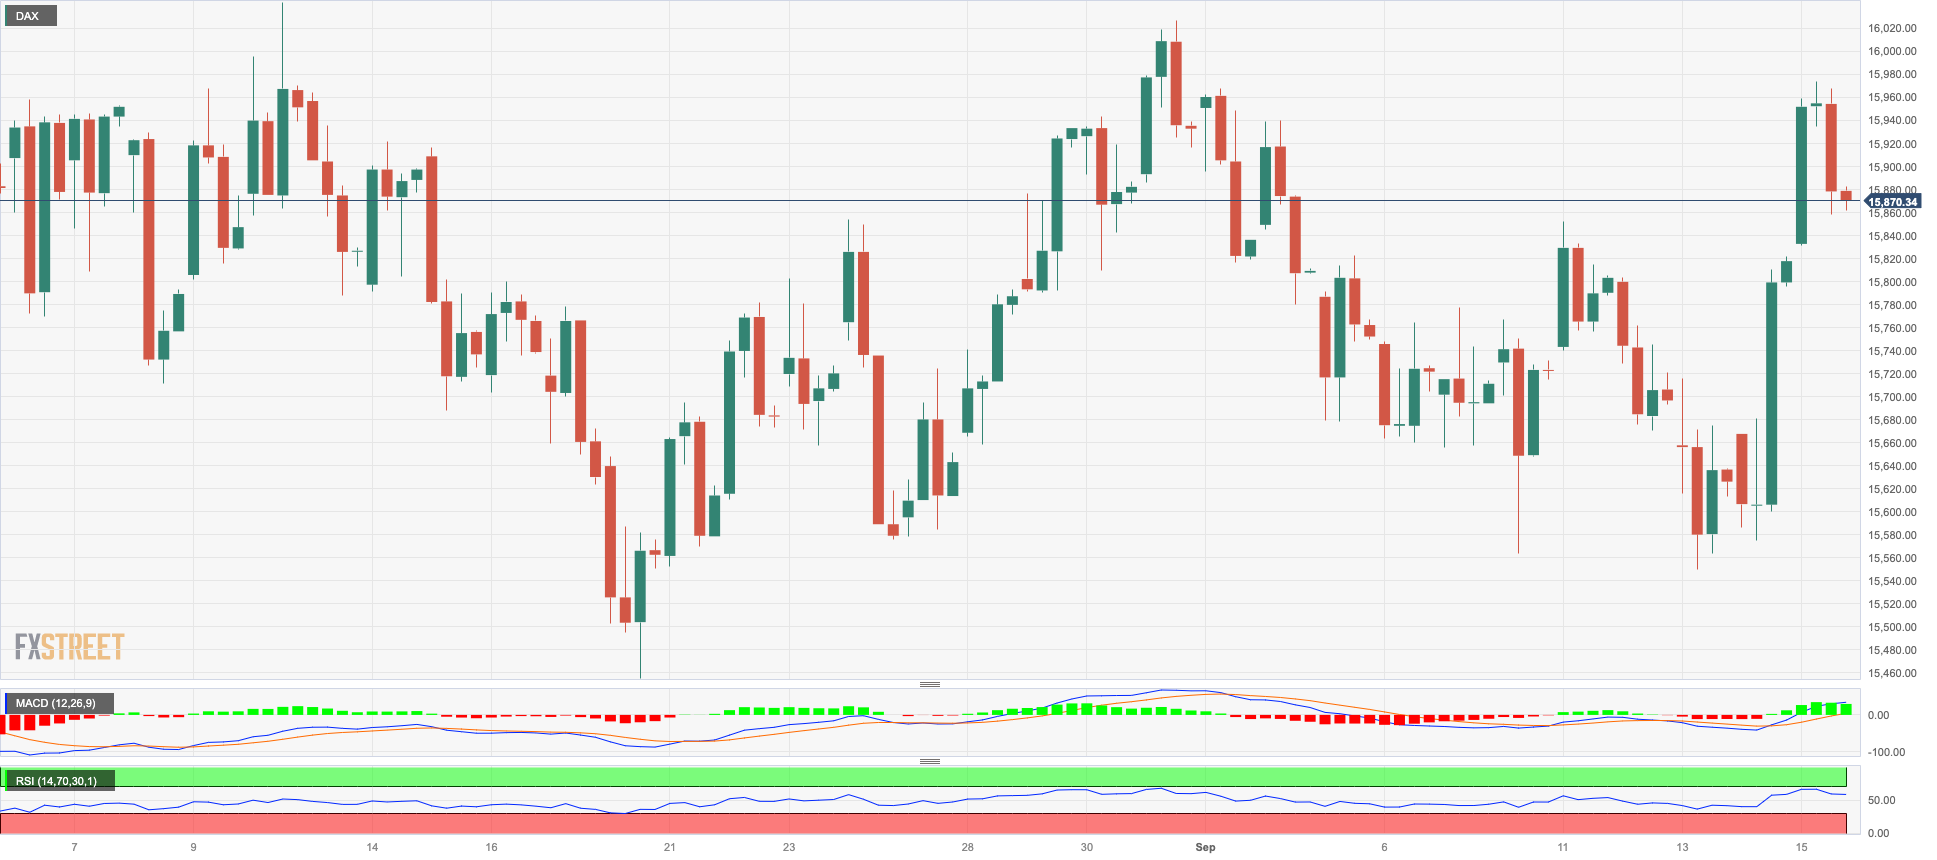
Germany’s key stock index DAX40 extended the weekly recovery to multi-day highs in levels just shy of the key 16000 milestone at the end of the week.
In fact, the index added to Thursday’s advance on the back of increasing optimism among market participants that the ECB could be done hiking rates for the time being.
In addition, auspicious prints from the Chinese calendar also reinforced the idea that an economic rebound in that country could well be in the offing.
The marked advance in the index was in tandem with the equally robust bounce in the 10-year bund yields, which flirted with 2.70% once again.
If the DAX40 rally becomes more serious, it could retest the temporary resistance level at the 55-day line SMA at 15914 before hitting the weekly highs of 16042 (31 August) and 16060 (10 August). If there is a breakout above the latter level, it could draw investors' attention to a possible challenge of the all-time high of 16528 (31 July). On the other hand, the August low of 15468 (18 August) is in immediate contention, which seems to be supported by the 200-day line SMA at 15508 and is above the July low of 15456 (7 July). If the index falls below this level, it could then challenge the March low of 14458 (20 March), followed by the December 2022 low of 13791 (20 December) and the 2022 low of 11862 (28 September). The RSI on the daily chart has climbed to the limits of the 50 threshold.
Best Performers: BASF, Brenntag AG, Dr Ing hc F Porsche Prf
Worst Performers: Vonovia, Infineon, Qiagen
Resistance levels: 15989 16042 16060 (4H chart)
Support levels: 15564 15468 15456 (4H chart)
NASDAQ
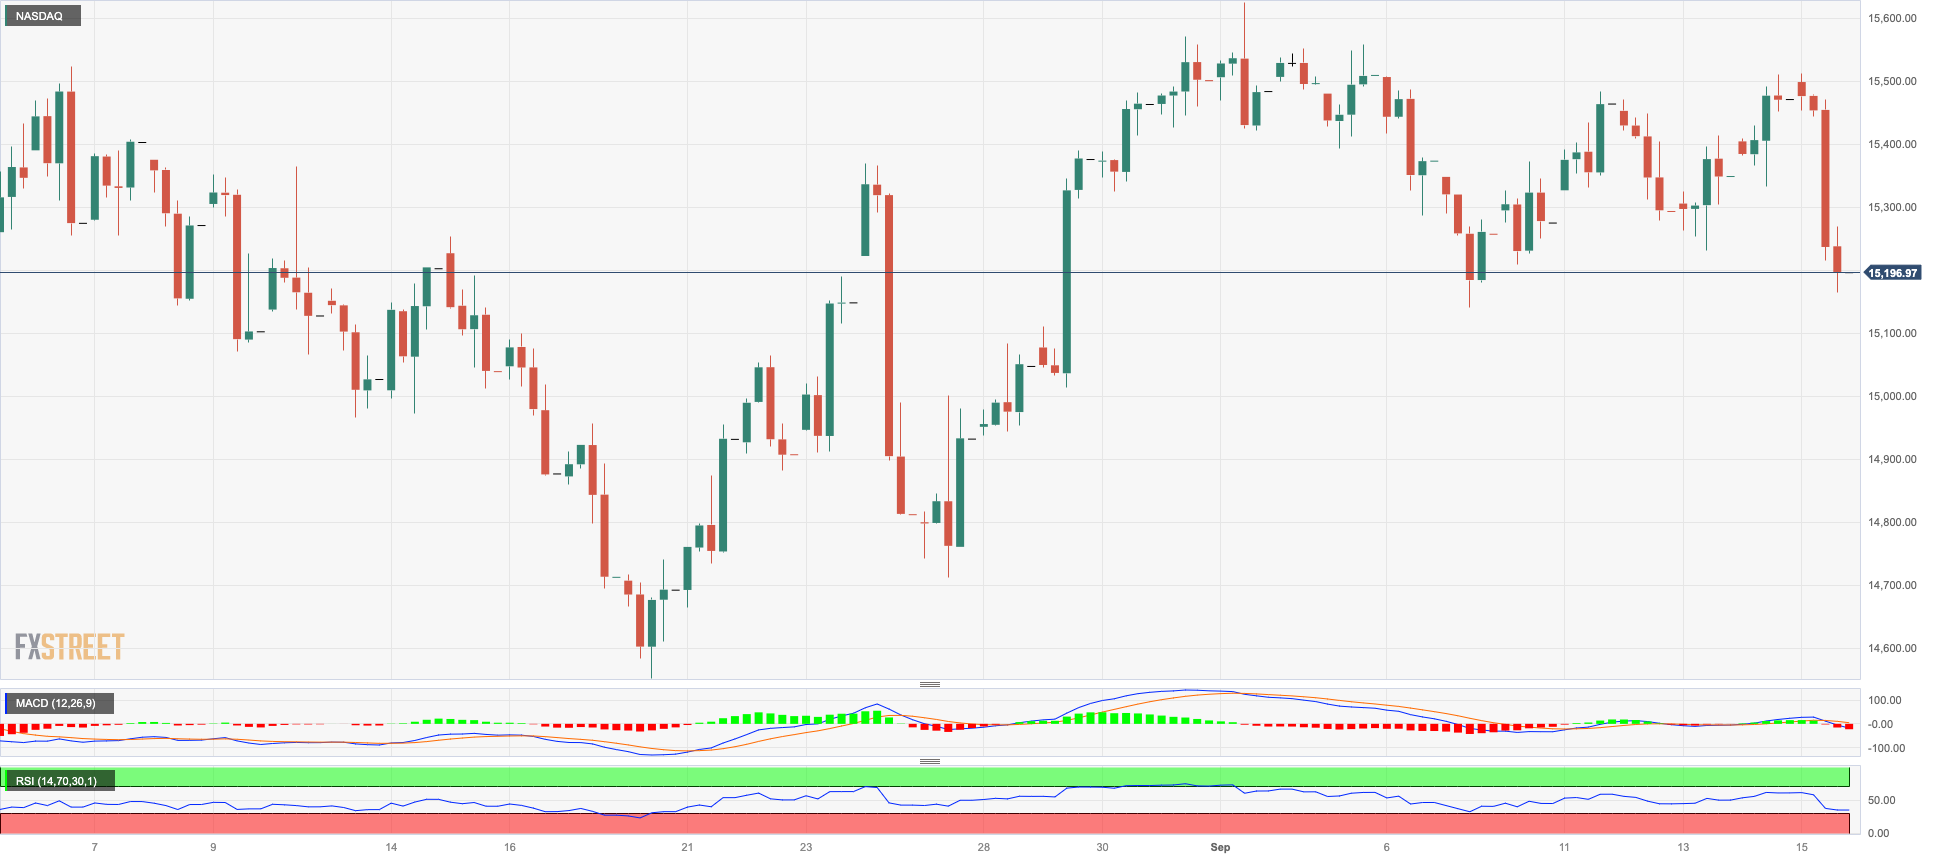
The tech reference Nasdaq 100 came under pressure and set aside two daily advances in a row on Friday, dropping to multi-day lows in the sub-15200 zone.
The late rebound in the greenback, prudence ahead of the interest rate decision by the Fed next week and extra gains in US yields across the curve, all seem to have weighed on the US tech sector towards the end of the week.
If the bulls retake control, the Nasdaq 100 should hit the September high of 15618 (September 1) before reaching the weekly high of 15803 (July 31). The 2023 top at 15932 (July 19) is followed by the round 16000 level to the north. On the other hand, a tiny weekly bottom has developed around 14715 (August 25), which appears to be supported by the vicinity of the 100-day SMA at 14720 and rests ahead of the August low of 14557 (August 18). If this level is broken, the weekly lows of 14283 (June 7) and 13520 (May 24) will be reclaimed, ahead of the 200-day SMA of 13403. The RSI dropped to the 48 region.
Top Gainers: Moderna, MercadoLibre, Warner Bros Discovery
Top Losers: Sirius XM, KLA Corp, DexCom
Resistance levels: 15512 15618 15803 (4H chart)
Support levels: 15138 14712 14557 (4H chart)
DOW JONES
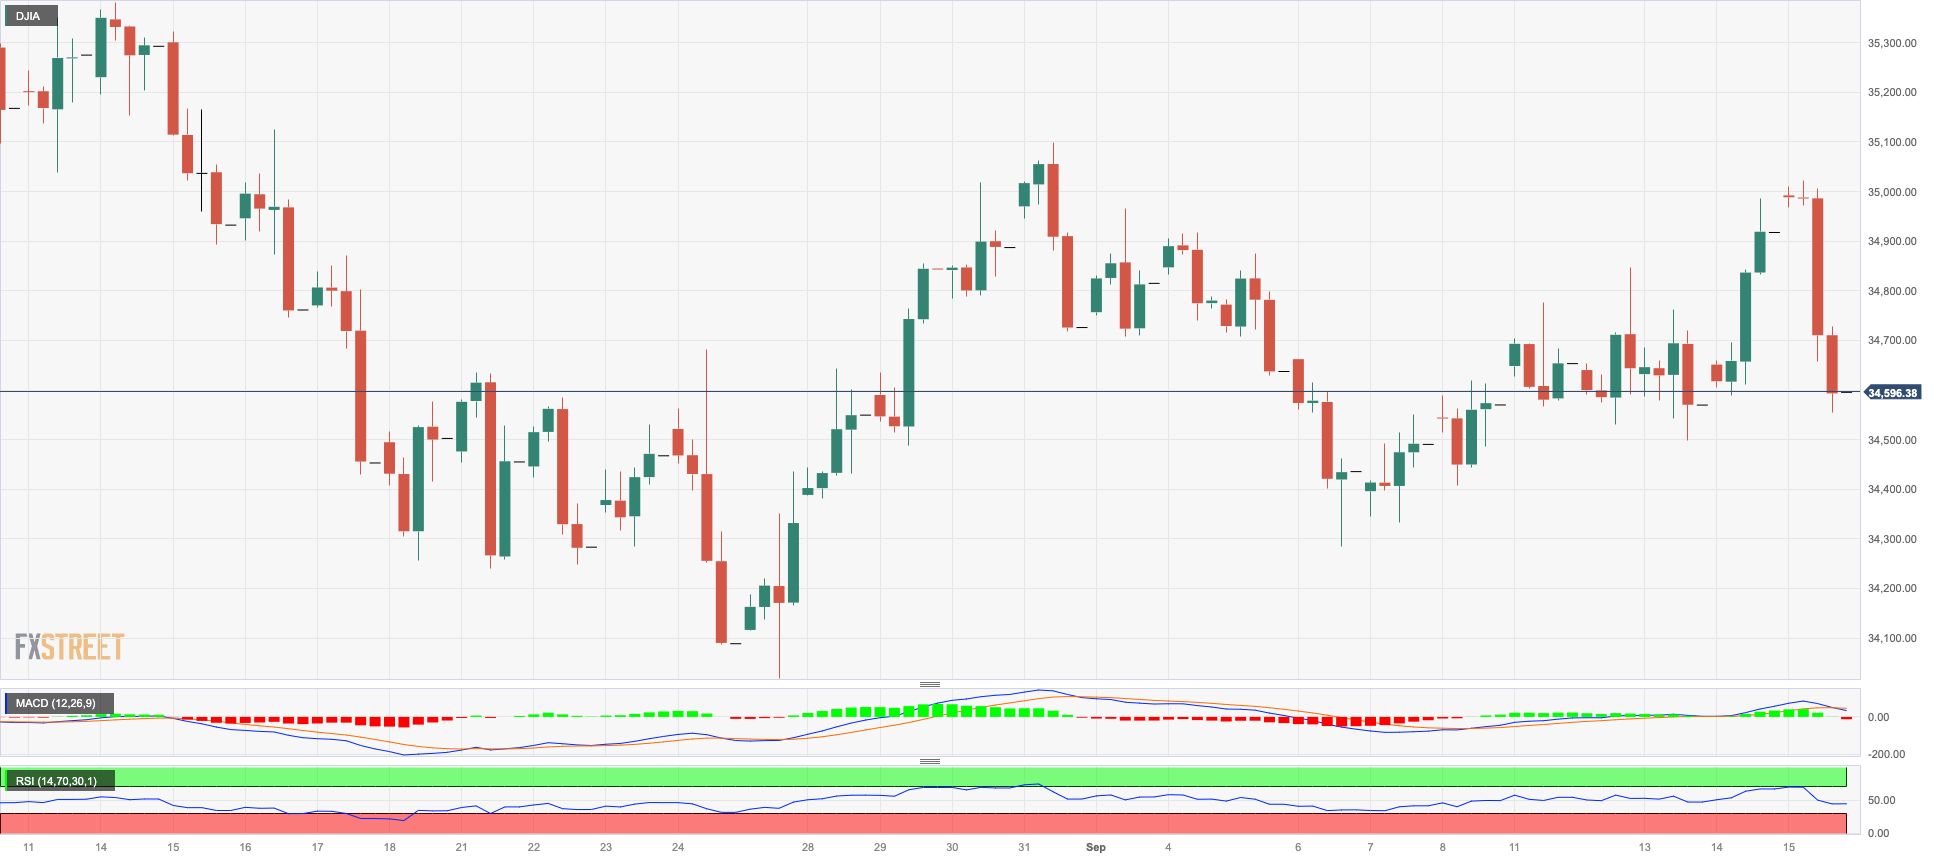
Increasing investors’ cautiousness ahead of the FOMC gathering on September 20 coupled with a profit-taking mood seem to have weighed on the blue-chip reference Dow Jones on Friday.
Indeed, the benchmark index receded to two-day lows near the 34500 zone at the end of the week, although it managed well to keep the weekly performance in positive territory.
At the end of the week, the Dow Jones dropped 0.83% to 34618, the S&P500 retreated 1.22% to 4450, and the tech-focused Nasdaq Composite deflated 1.56% to 13708.
The Dow Jones weekly high of 35070 (August 31) is immediately to the upside, followed by the 2023 peak of 35679 (August 1) and the 2022 high of 35824 (February 9). The latter's breakout might result in an all-time top of 36952 (January 5, 2022). A drop below the September low of 34291 (September 6) could put a test of the August low of 34029 (August 25) back on the radar ahead of the 200-day SMA of 33806. South from here emerges the July low of 33705 (July 10) seconded by the May low of 32586 (May 25) and the 2023 low of 31429 (March 15). The everyday RSI retreated to the vicinity of 48.
Top Performers: Walt Disney, American Express, UnitedHealth
Worst Performers: Home Depot, Microsoft, McDonald’s
Resistance levels: 34977 35070 35578 (4H chart)
Support levels: 34291 34029 33705 (4H chart)
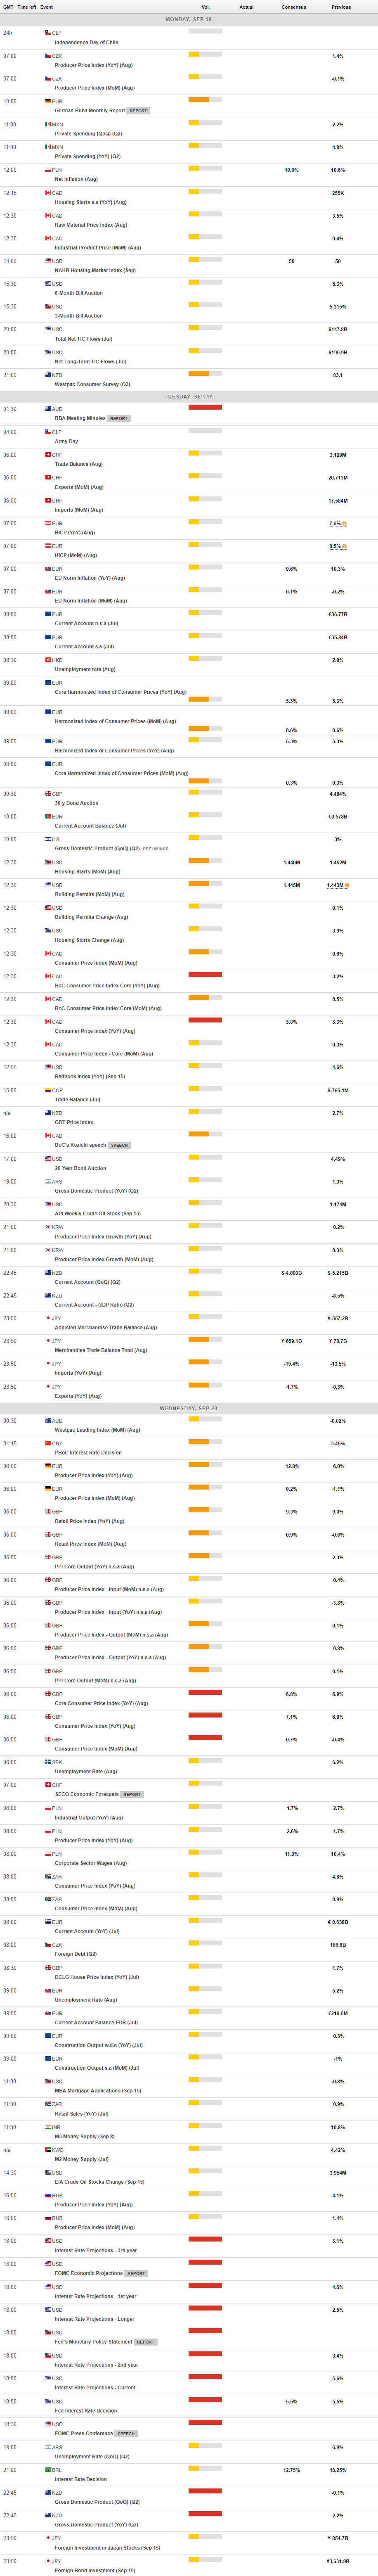
MACROECONOMIC EVENTS
All Information & Updates provided by:

All information relating to the financial markets available on this page has been prepared and issued by FXStreet (Forexstreet SL, Spain, Reg: B62498233) on the basis of publicly available information and all information believed to be reliable and does not conflict with Kuwaiti local laws, and all necessary care has been taken to before the company to ensure that the facts mentioned are correct from the source.
NCM Investment nor any of its directors or employees shall in any way be held responsible for the contents of this news, and the information contained on this page is intended only to provide clients with publicly available information and should not be construed as investment advice, report or analysis and/or constitute an offer or invitation to buy or sell financial instruments of any kind.
RISK WARNING: Forex and CFDs are highly risky leveraged products, as losses can exceed deposits. Please ensure you understand all the risks and take independent advice if necessary. NCM will segregate the clients based on the criteria of the regulator and its bylaws. NCM does not provide any advisory service; the material published does not constitute advice or a recommendation for a transaction in any financial instrument. NCM accepts no responsibility for any use of the content presented and any consequences of that use. Anyone acting on the information provided does so at their own risk.