
- Contact Us:
-

-

-

-


Daily Market Updates
19 Sep 2023
USDJPY
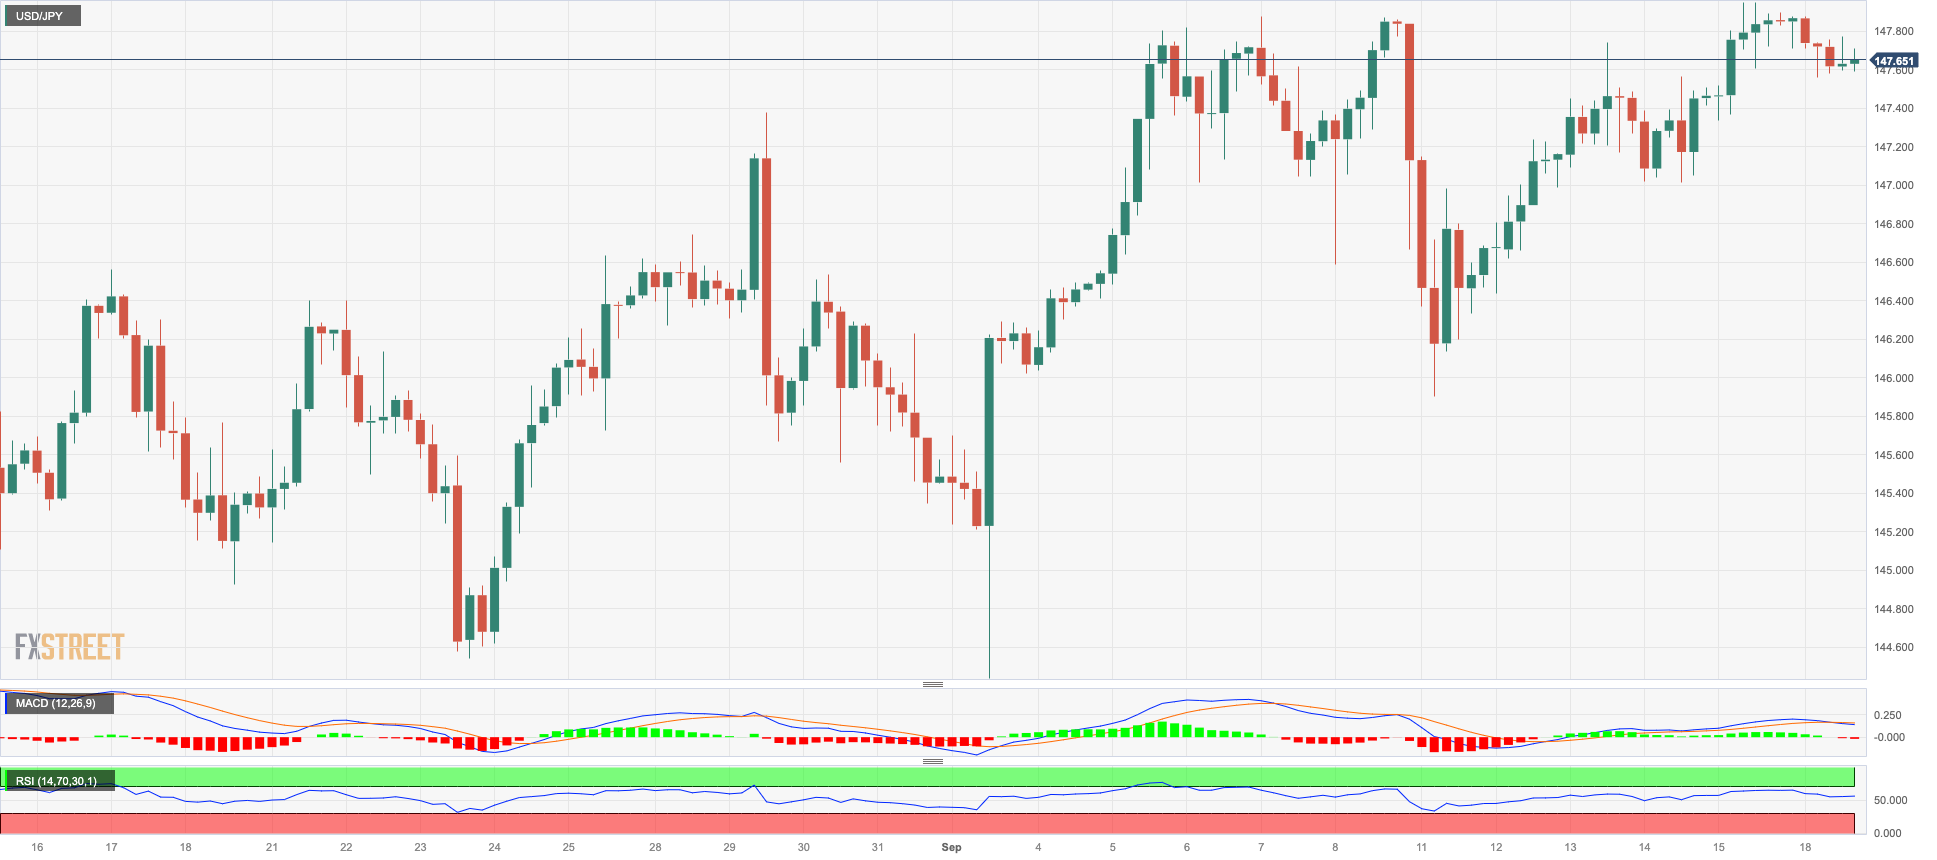
The bearish price action around the greenback seems to have sparked some corrective reaction in USD/JPY at the beginning of the week.
In fact, spot retreated modestly for the first time after four consecutive daily advances and appears to have met an important hurdle near the 148.00 region, while the interruption of the march north in US yields seems to have also contributed to the knee-jerk.
There was nothing to highlight on the Japanese docket on Monday.
If USD/JPY moves above the 2023 high of 147.95 (September 15), there could be a potential test of the 2022 top of 151.95 (October 21). On the other hand, the September low of 144.43 (September 1) come ahead of the transitory 55-day SMA of 143.92 and the August low of 141.50 (August 7). If this level is breached, the pair could challenge the weekly low of 138.05 (July 28), ahead of the 200-day SMA at 137.38. A lower retracement could threaten the weekly low of 133.01 (April 26) and the lower levels of 132.01 (April 13) and 130.62 (April 5). On the daily chart, the RSI eased below the 61 mark.
Resistance levels: 147.95 148.45 148.84 (4H chart)
Support levels: 145.89 145.63 144.43 (4H chart)
GBPUSD
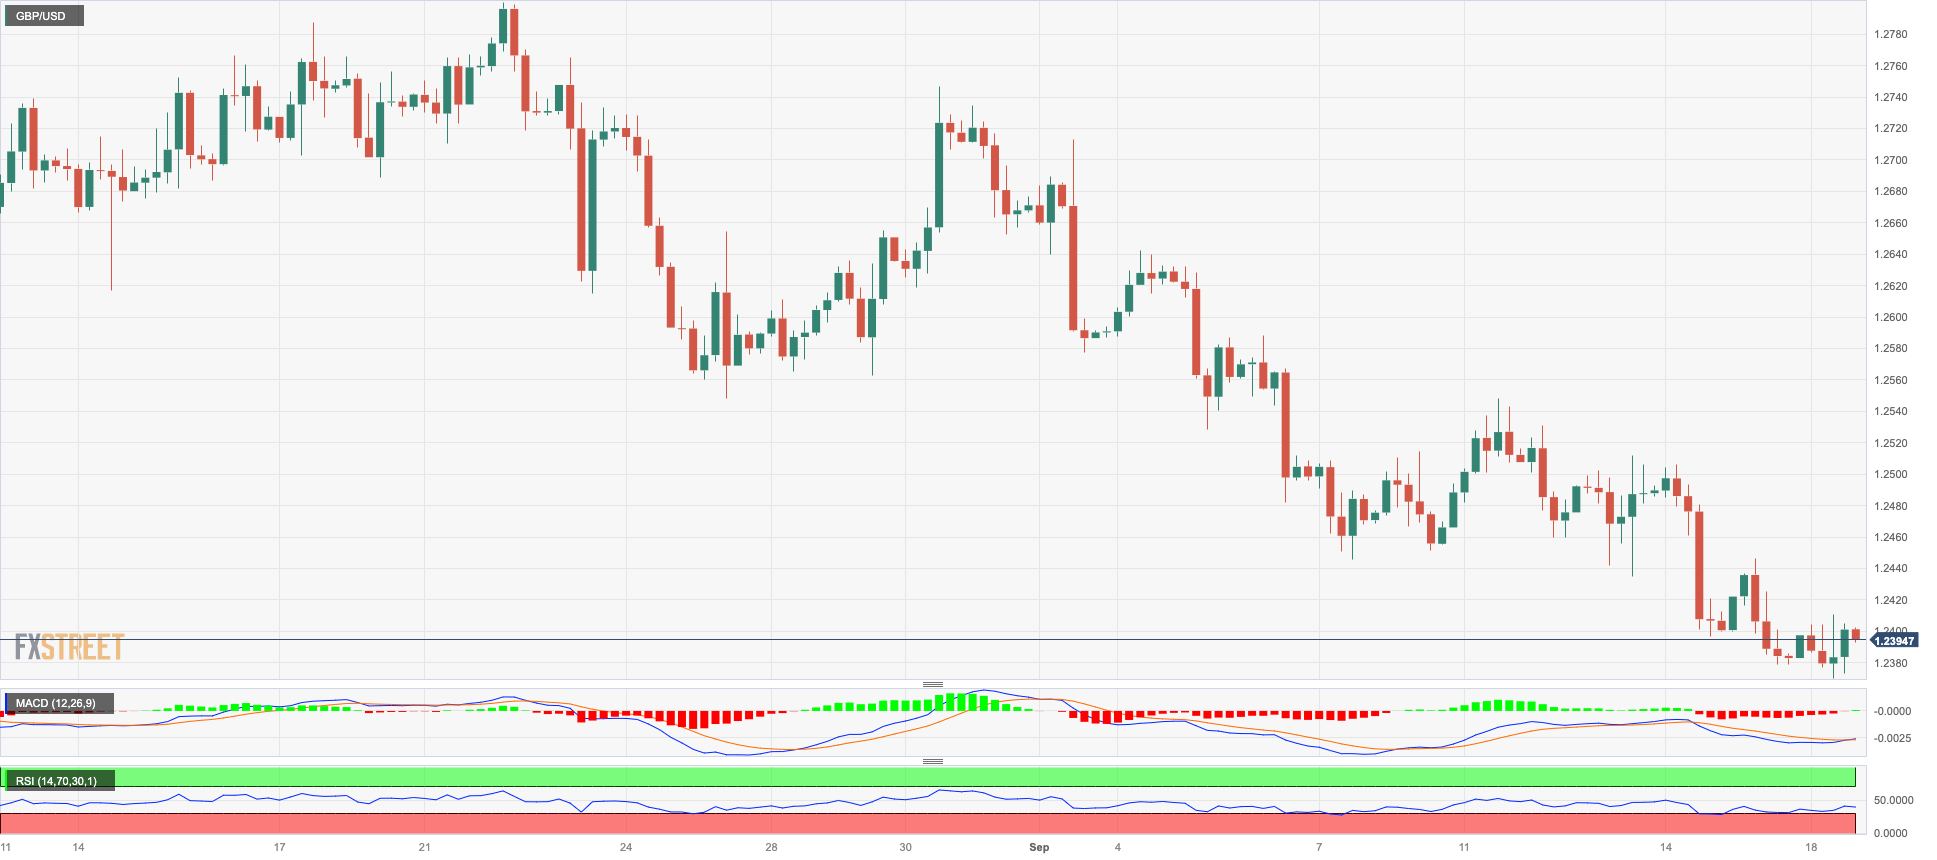
The dollar weakened across the board and encouraged GBP/USD to reclaim the 1.2400 yardstick and beyond at the beginning of the week.
In fact, Cable reversed two consecutive daily pullbacks and managed to bounce off Friday’s three-month lows in the 1.2380/75 band on the back of a better tone in the risk-linked galaxy.
Moving forward, the British pound is expected to remain under the microscope later in the week as the BoE meets on September 21. On this, the probability of a 25 bps rate raise surpasses the 80% ahead of a probable impasse at the November 2 gathering.
The UK calendar remained empty on Monday.
GBP/USD remains in the area below the 200-day SMA and keeps the door open to further weakness in the near term. Indeed, immediate support appears around the September low of 1.2378 (September 15), which precedes the June low of 1.2368 (June 5) and the May low of 1.2308 (May 25). Instead, there is an initial up-barrier at the weekly high at 1.2548 (September 11) followed by interim hurdles at the 100-day and 55-day SMAs at 1.2650 and 1.2726, respectively. The surpass of this region exposes another weekly top at 1.2746, ahead of the weekly highs of 1.2818 (August 10) and 1.2995 (July 27), all prior to the psychological milestone of 1.3000. On the daily chart, the RSI rebounded to the 32 region.
Resistance levels: 1.2548 1.2636 1.2746 (4H chart)
Support levels: 1.2378 1.2368 1.2308 (4H chart)
AUDUSD
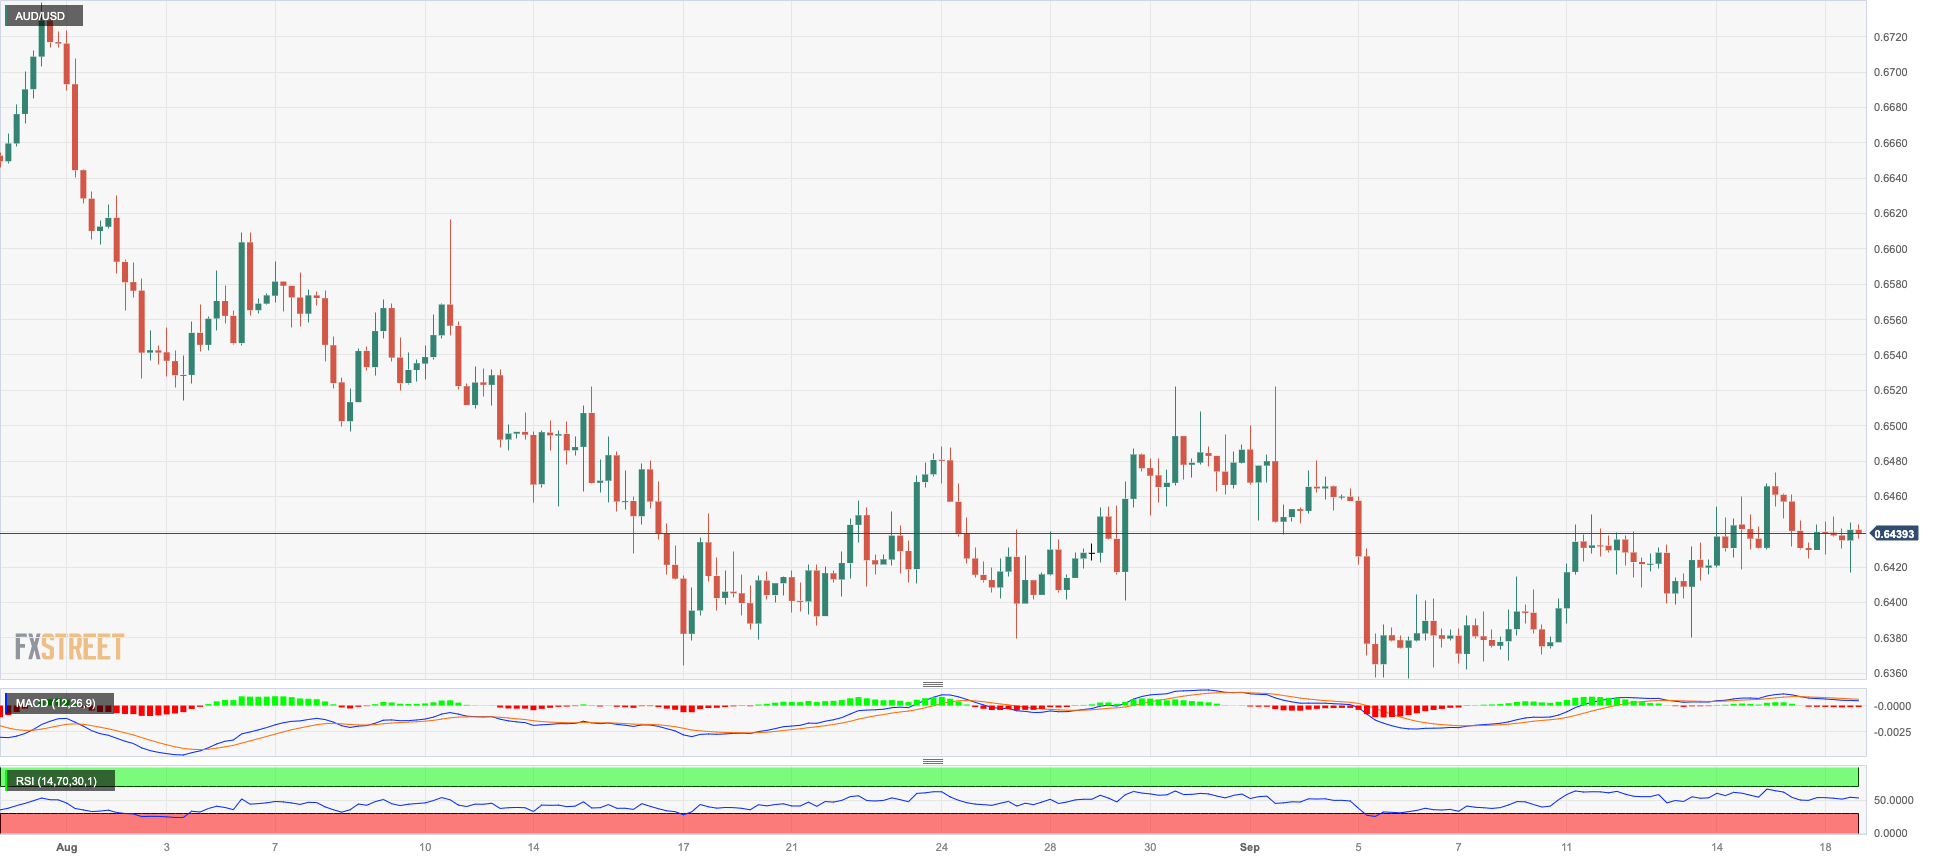
AUD/USD kicked off the new trading week with a humble advance to the 0.6450 region, partially reversing Friday’s pullback.
In fact, the dollar’s inconclusive price action at the beginning of the week helped the Aussie dollar regain some balance, while the mixed performance of the commodity universe also seems to have lent some support to the pair.
There were no data releases in Oz on Monday, although investors are expected to closely follow the release of the RBA’s Minutes of the September meeting early on Tuesday.
For the AUD/USD, the 2023 bottom of 0.6357 (September 5) is immediately below, followed by the November 2022 low of 0.6272 (November 7) and the 2022 low of 0.6179 (October 13). Instead, immediate hurdle may be found at the weekly high of 0.6522 (August 30), followed by another weekly top of 0.6616 (August 10) and the 200-day SMA at 0.6702. Further gains might push the pair back to the July peak of 0.6894 (July 14), before the June high of 0.6899 (16 June) and the critical 0.7000 level. The weekly top of 0.7029 (February 14) and the 2023 peak of 0.7157 (February 2) are both oriented north of here. The day-to-day RSI improved marginally past 46.
Resistance levels: 0.6473 0.6521 0.6616 (4H chart)
Support levels: 0.6380 0.6357 0.6272 (4H chart)
GOLD
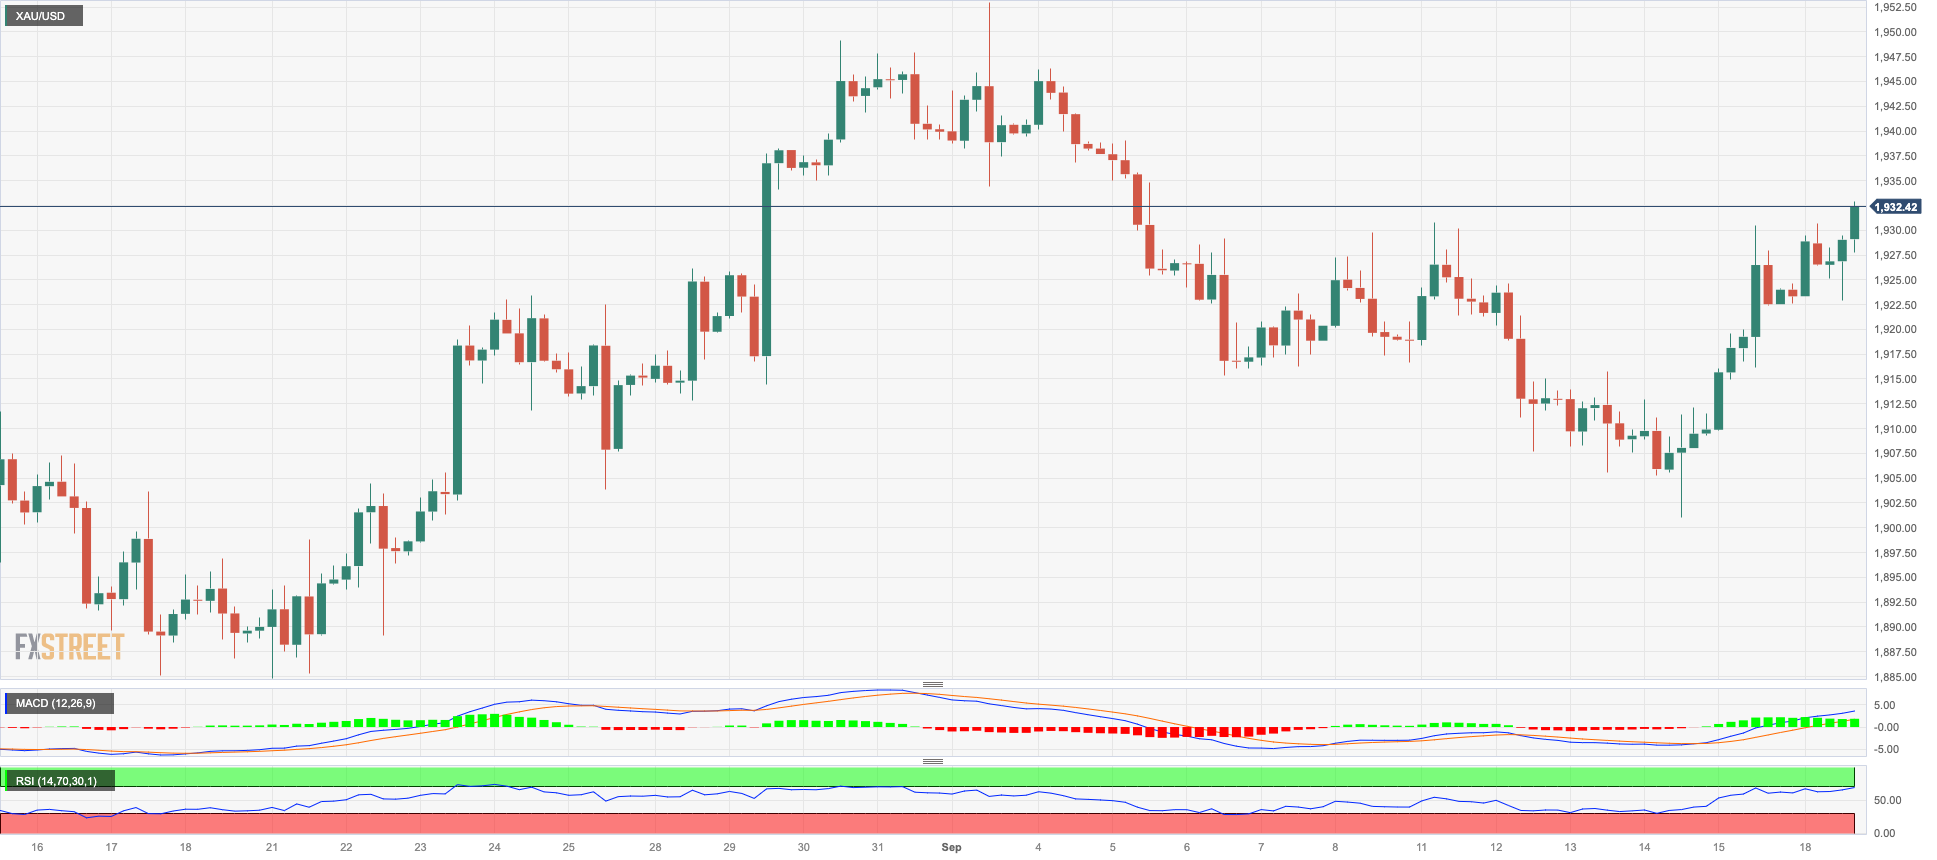
Gold prices edged further up and flirted once again with the $1930 region per troy ounce at the beginning of the week, an area also coincident with the provisional 55-day SMA.
The second session in a row of dollar losses fuelled the recovery in the precious metal, which advanced for the third consecutive session. This was also propped up by the tepid decline in US yields across the curve.
The impending event that might bring some unpredictability to the gold market is the forthcoming FOMC meeting scheduled for September 20. The general expectation is that the Federal Reserve will maintain its current interest rate, although the Committee’s forward guidance will also be under the microscope.
The continuation of the recovery now targets the interim 100-day SMA at $1946 ahead of the September high of $1953 (September 1). A breakout from this zone could take us to the July top of $1987 (July 20), which is just below the psychological $2000 level. A further rise from this region could pave the way for an assault on the 2023 peak of $2067 (May 4), the 2022 top of $2070 (March 8) and the all-time high of $2075 (August 7, 2020). On the flip side, there is immediate support at the September low of $1901 (September), which coincides with the key contention area at $1900 and precedes the August low of $1885 (August 17) and the 2023 low of $1804 (February 28), all ahead of the key $1800 region.
Resistance levels: $1930 $1946 $1953 (4H chart)
Support levels: $1919 $1901 $1884 (4H chart)
CRUDE WTI
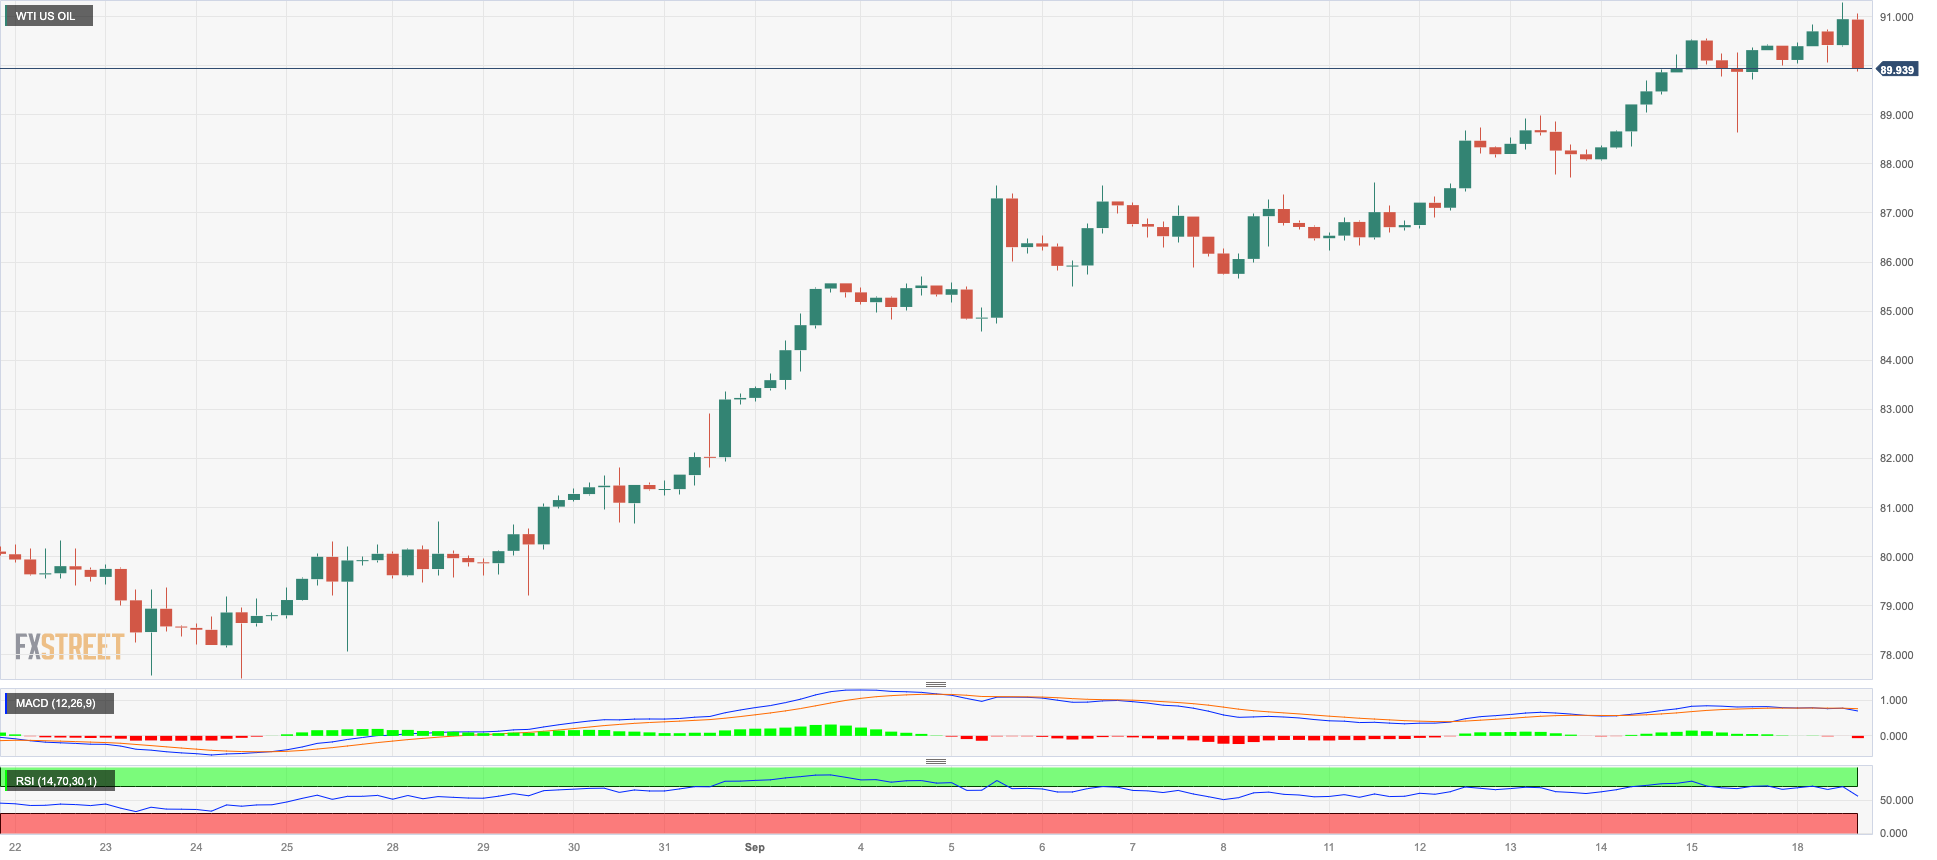
The rally in crude oil prices remained unabated on Monday.
This time, prices of the barrel of the American reference for sweet light crude oil climbed to levels last seen in early November 2022, past the $92.00 mark.
The reasoning behind the extra upside in prices of the commodity hovered around the tight supply narrative (of course), which appears further propped up by recent projections by the OPEC and the IEA of a stronger demand into year-end.
As usual, the API and the EIA will report on weekly US crude oil supplies for the week ended on September 15 on Tuesday and Wednesday, respectively.
Given the recent performance of the WTI price, the immediate obstacle to the uptrend now appears to be the November 2022 high of $93.73 (November 7) ahead of the weekly high of $97.65 (August 30, 2022) and the crucial milestone of $100.00 per barrel. Conversely, the first support shows at the 55-day SMA at $80.88, seconded by the August low at $77.64 (August 24) and the key 200-day SMA at $76.56. A breakdown of this zone could lead to a reassessment of the weekly lows at $73.89 (July 17) and $66.86 (June 12), both ahead of the 2023 low at $63.61 (May 4). Immediately below appears the December 2021 low at $62.46 (December 2) prior to
the crucial $60.00 mark.
Resistance levels: $92.29 $93.73 $97.65 (4H chart)
Support levels: $89.19 $88.25 $86.12 (4H chart)
GER40
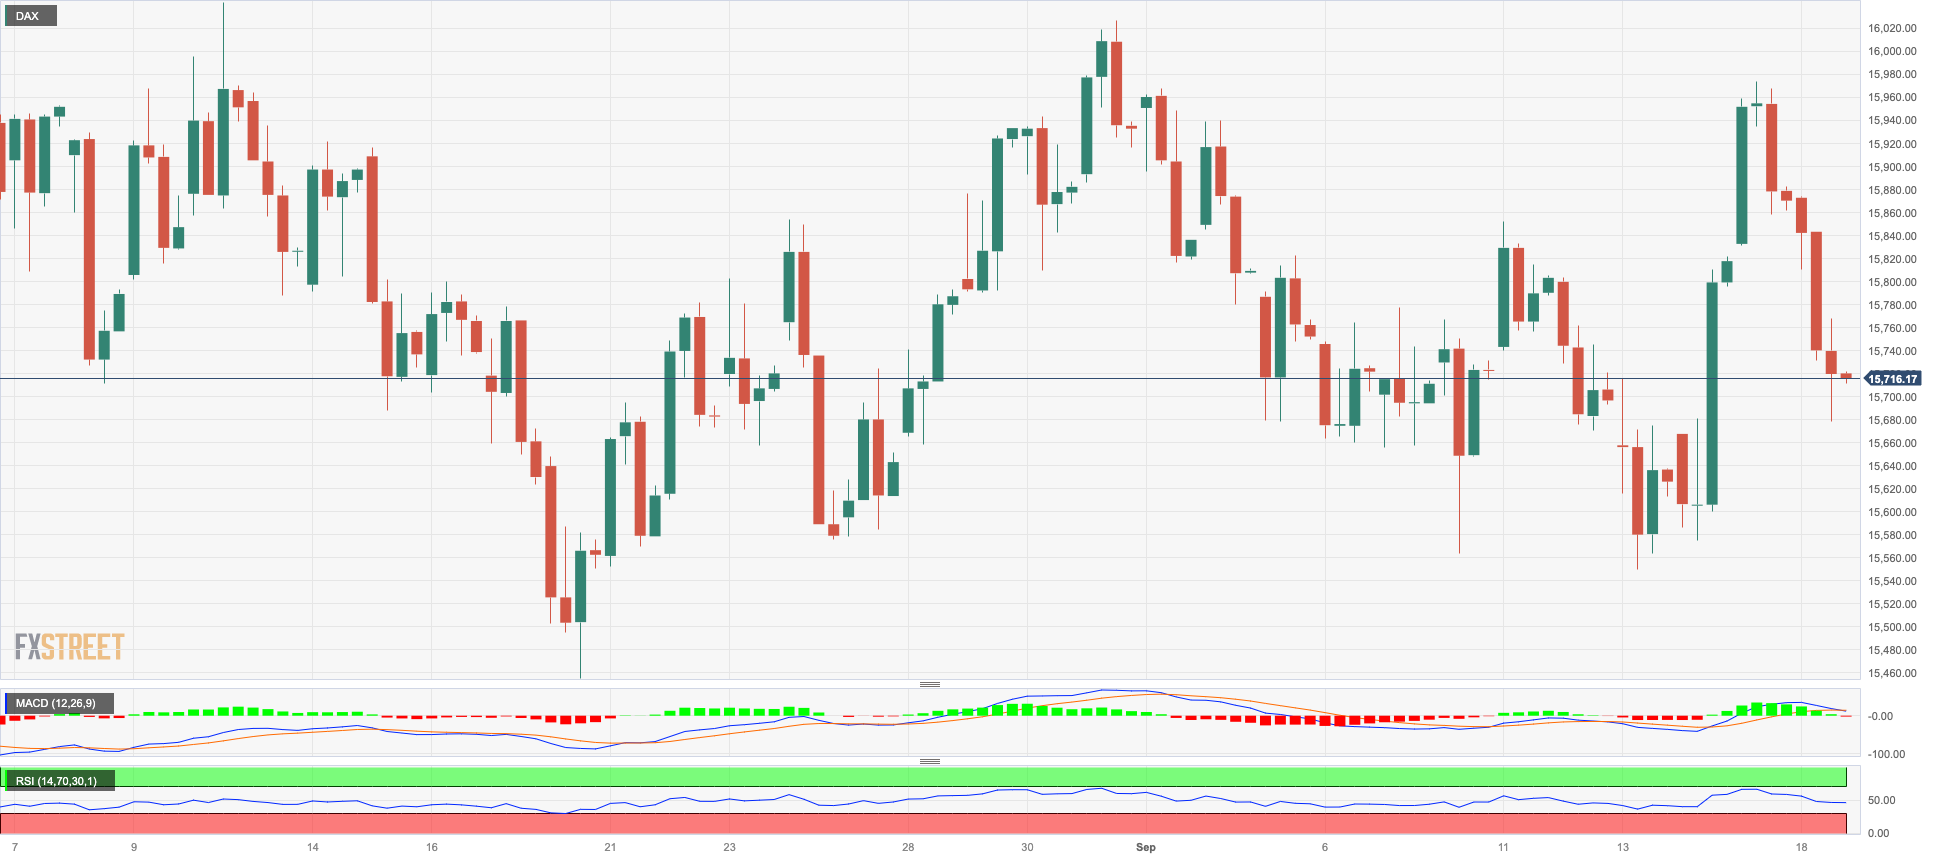
German stocks measured by the key DAX40 sank to two-day lows on Monday, reversing at the same time two consecutive daily advances.
In fact, the benchmark index revisited the 15700 zone after trading in levels just shy of the key 16000 barrier during the previous session in response to renewed concerns over a potential stagflation in the regions, a downward revision to the German economy by the Bundesbank, and prudence prior to the FOMC and BoE gatherings later in the week.
Additionally, the 10-year bund yields rose to multi-week tops past 2.72% following comments from ECB rate-setters, who hinted at the likelihood that rate hikes could be resuming in Q1 2024.
If the DAX40 rally becomes more serious, it could retest the initial resistance at the September peak at 15989 (September 14) prior to the weekly highs of 16042 (August 31) and 16060 (August 10). If there is a breakout above the latter level, it could draw investors' attention to a possible challenge of the all-time high of 16528 (July 31). On the other hand, the August low of 15468 (August 18) emerges as an immediate contention, which seems to be supported by the 200-day SMA at 15522 and is above the July low of 15456 (July 7). If the index falls below this level, it could then challenge the March low of 14458 (March 20), followed by the December 2022 low of 13791 (December 20) and the 2022 low of 11862 (September 28). The RSI on the daily chart dropped to the vicinity of 46.
Best Performers: Rheinmetall AG, Fresenius SE, Daimler Truck Holding
Worst Performers: MTU Aero, Sartorius AG VZO, Infineon
Resistance levels: 15989 16042 16060 (4H chart)
Support levels: 15564 15468 15456 (4H chart)
NASDAQ
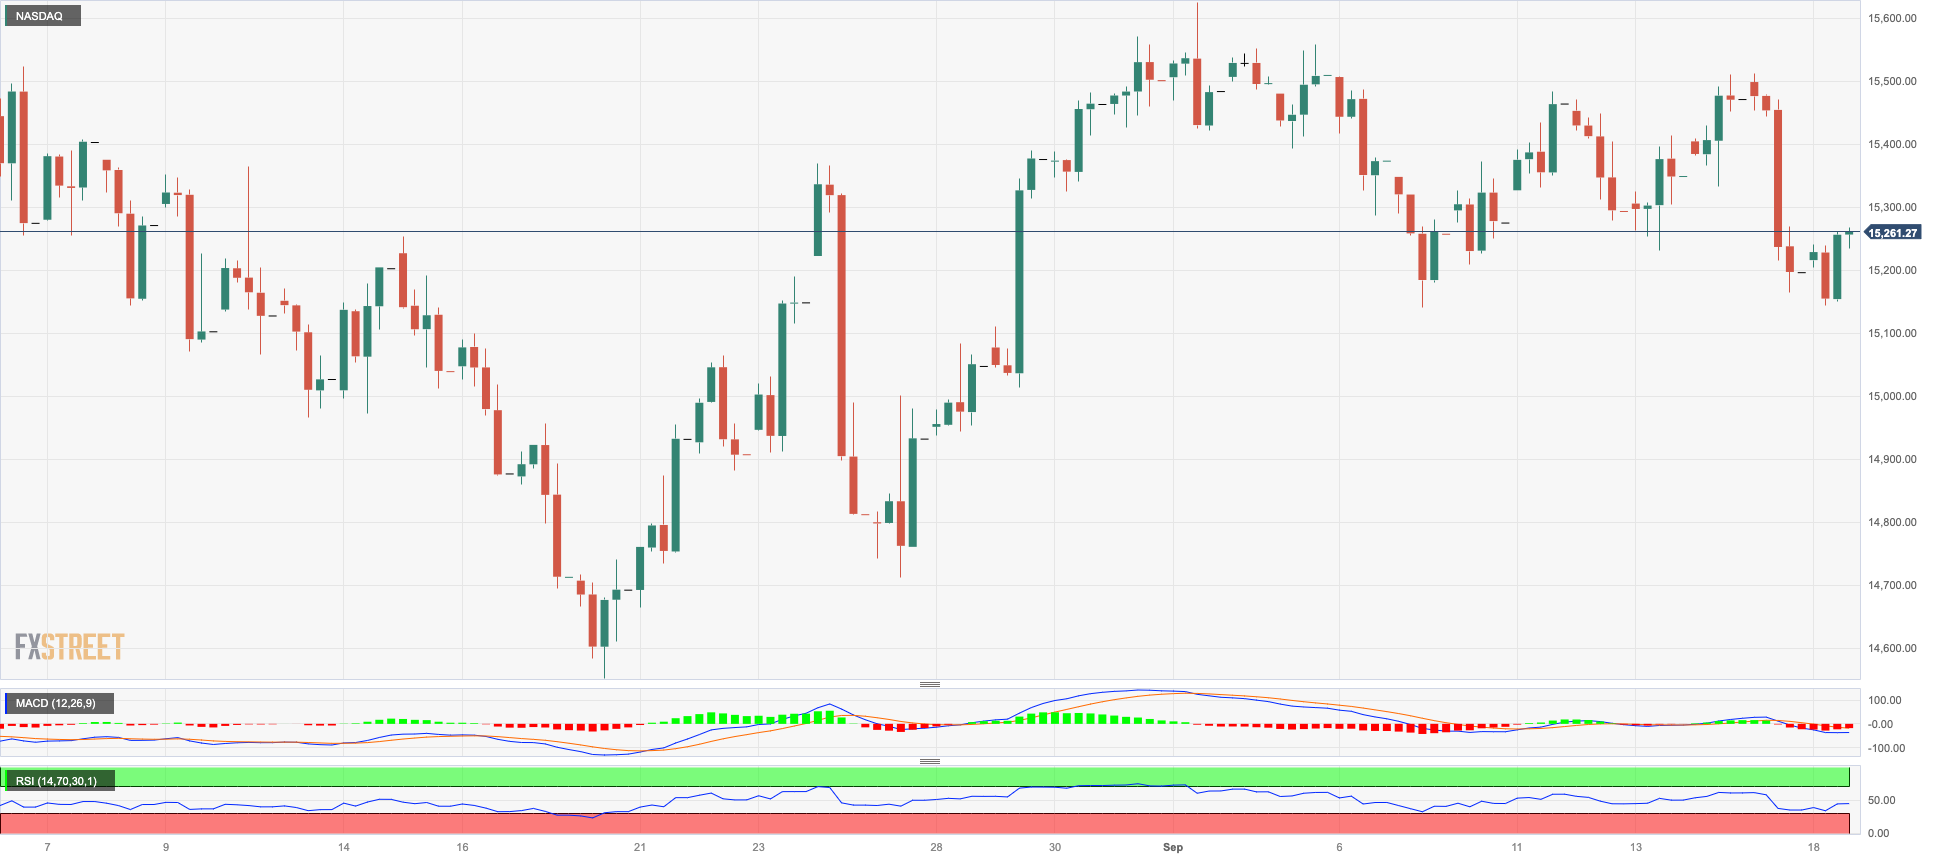
The Nasdaq 100 followed its US peers and reversed part of Friday’s pullback at the beginning of the week.
Indeed, the tech reference regained composure after an initial dip to multi-session lows, helped by the second retracement in a row of the greenback, mixed US yields, and investors’ optimism ahead of the key FOMC gathering later in the week.
If the bulls retake control, the Nasdaq 100 should hit the September high of 15618 (September 1) before reaching the weekly top of 15803 (July 31). The 2023 peak at 15932 (July 19) is followed by the round 16000 level to the north. On the other hand, a tiny weekly bottom has developed around 14715 (August 25), which appears to be supported by the vicinity of the interim 100-day SMA at 14745 and rests ahead of the August low of 14557 (August 18). If this level is broken, the weekly lows of 14283 (June 7) and 13520 (May 24) will be reclaimed, ahead of the 200-day SMA of 13422. The RSI improved to the proximity of the 50 threshold.
Top Gainers: Sirius XM, Apple, Atlassian Corp Plc
Top Losers: Moderna, Lucid Group, Tesla
Resistance levels: 15512 15618 15803 (4H chart)
Support levels: 15138 14715 14557 (4H chart)
DOW JONES
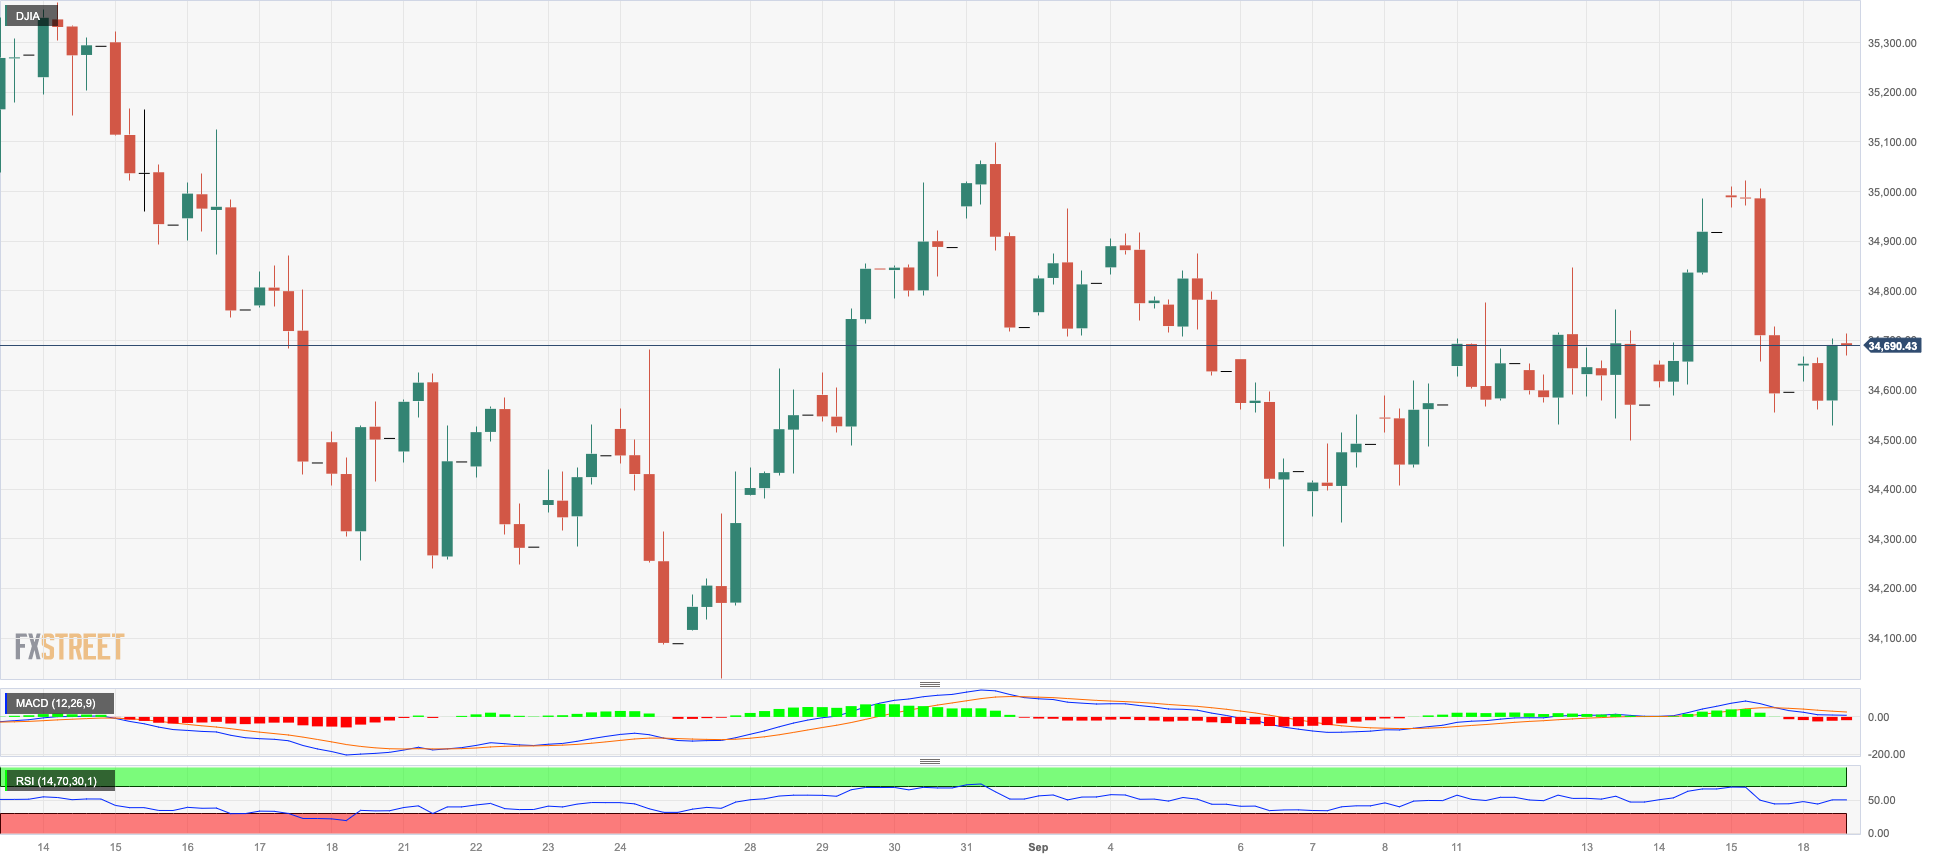
US equities tracked by the Dow Jones added to Friday’s gains and rose past the 34700 level on Monday, flirting at the same time with the temporary 55-day SMA.
In fact, market participants started the new trading week in an upbeat mood ahead of the key FOMC gathering on September 20, when the Federal Reserve is largely anticipated to keep rates unchanged.
Furthermore, the Federal Reserve's forward guidance, given its current data-dependent approach, is anticipated to take the spotlight during the Powell press conference and be the subject of much debate.
All in all, the Dow Jones gained 0.27% to 34710, the S&P500 rose 0.28% to 4462, and the tech-heavy Nasdaq Composite advanced 0.21% to 13736.
The Dow Jones weekly high of 35070 (August 31) is immediately to the upside, followed by the 2023 peak of 35679 (August 1) and the 2022 top of 35824 (February 9). The latter's breakout might result in an all-time high of 36952 (January 5, 2022). A drop below the September low of 34291 (September 6) could put a test of the August low of 34029 (August 25) back on the radar ahead of the 200-day SMA of 33810. South from here emerges the July low of 33705 (July 10) seconded by the May low of 32586 (May 25) and the 2023 low of 31429 (March 15). The everyday RSI advanced to the 50 area.
Top Performers: Apple, Visa A, Travelers
Worst Performers: American Express, Walgreen Boots
Resistance levels: 34977 35070 35578 (4H chart)
Support levels: 34291 34029 33705 (4H chart)
MACROECONOMIC EVENTS
All Information & Updates provided by:

All information relating to the financial markets available on this page has been prepared and issued by FXStreet (Forexstreet SL, Spain, Reg: B62498233) on the basis of publicly available information and all information believed to be reliable and does not conflict with Kuwaiti local laws, and all necessary care has been taken to before the company to ensure that the facts mentioned are correct from the source.
NCM Investment nor any of its directors or employees shall in any way be held responsible for the contents of this news, and the information contained on this page is intended only to provide clients with publicly available information and should not be construed as investment advice, report or analysis and/or constitute an offer or invitation to buy or sell financial instruments of any kind.
RISK WARNING: Forex and CFDs are highly risky leveraged products, as losses can exceed deposits. Please ensure you understand all the risks and take independent advice if necessary. NCM will segregate the clients based on the criteria of the regulator and its bylaws. NCM does not provide any advisory service; the material published does not constitute advice or a recommendation for a transaction in any financial instrument. NCM accepts no responsibility for any use of the content presented and any consequences of that use. Anyone acting on the information provided does so at their own risk.