
- Contact Us:
-

-

-

-


Daily Market Updates
21 Sep 2023
USDJPY
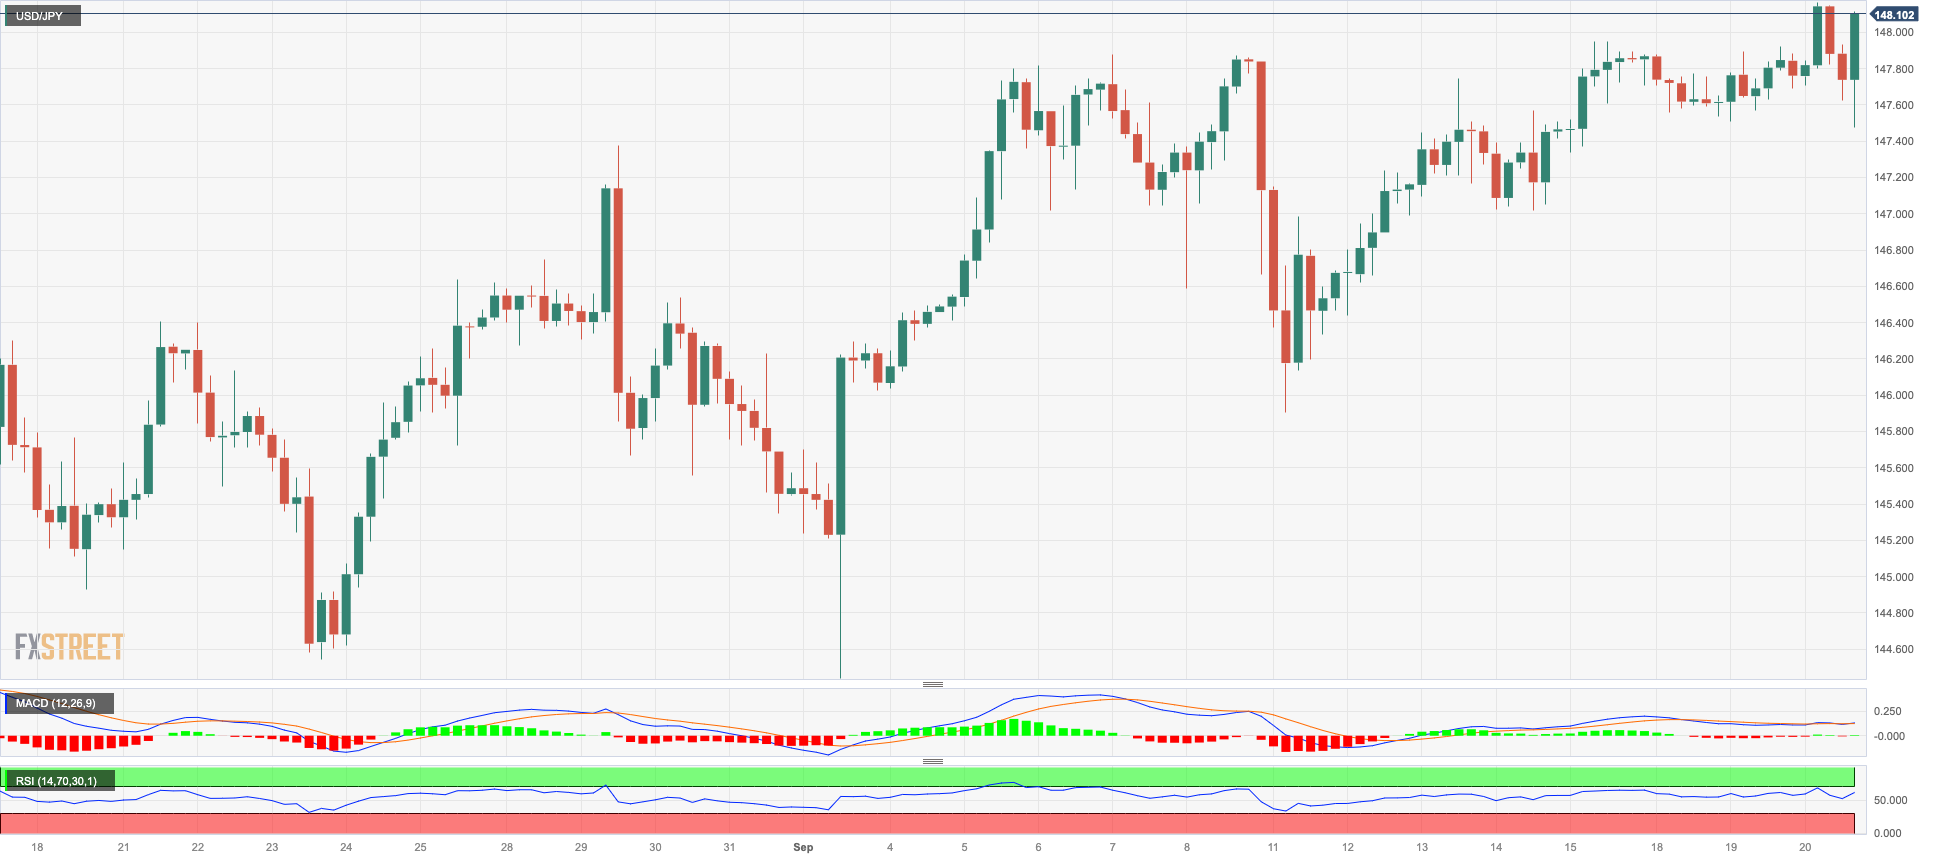
USD/JPY rose to a new 2023 high in the 148.15/20 band on Wednesday, helped by the late rebound in the greenback, particularly following the hawkish hold by the Federal Reserve.
In fact, spot managed to leave behind the initial pessimism stemming from some weakness in US yields in the 10-year/30-year tranche, which was also propped up by renewed concerns over a potential intervention in the FX markets by Japanese authorities.
On the latter, Japan’s Top Currency Diplomat Kanda, reiterated that FX moves are being closely watched with a high sense of urgency.
According to Japanese Balance of Trade results, the trade deficit widened to ¥930.5B for the month of August, with exports down 0.8% YoY and imports down 17.8% YoY.
If USD/JPY rises over the 2023 peak of 148.16 (September 20), it may test the 2022 high of 151.95 (October 21). However, there is little support at the weekly low of 145.89 (September 11), ahead of the September low of 144.43 (September 1), all before the transitory 55-day SMA of 144.04. The August low of 141.50 (August 7) appears south of here, followed by the weekly low of 138.05 (July 28), which is barely above the 200-day SMA at 137.50. A lower retracement might jeopardise the weekly low of 133.01 (April 26), as well as lower levels of 132.01 (April 13) and 130.62 (April 5). The RSI looked stable near 61.
Resistance levels: 148.16 148.45 148.84 (4H chart)
Support levels: 147.50 147.01 145.89 144.43 (4H chart)
GBPUSD
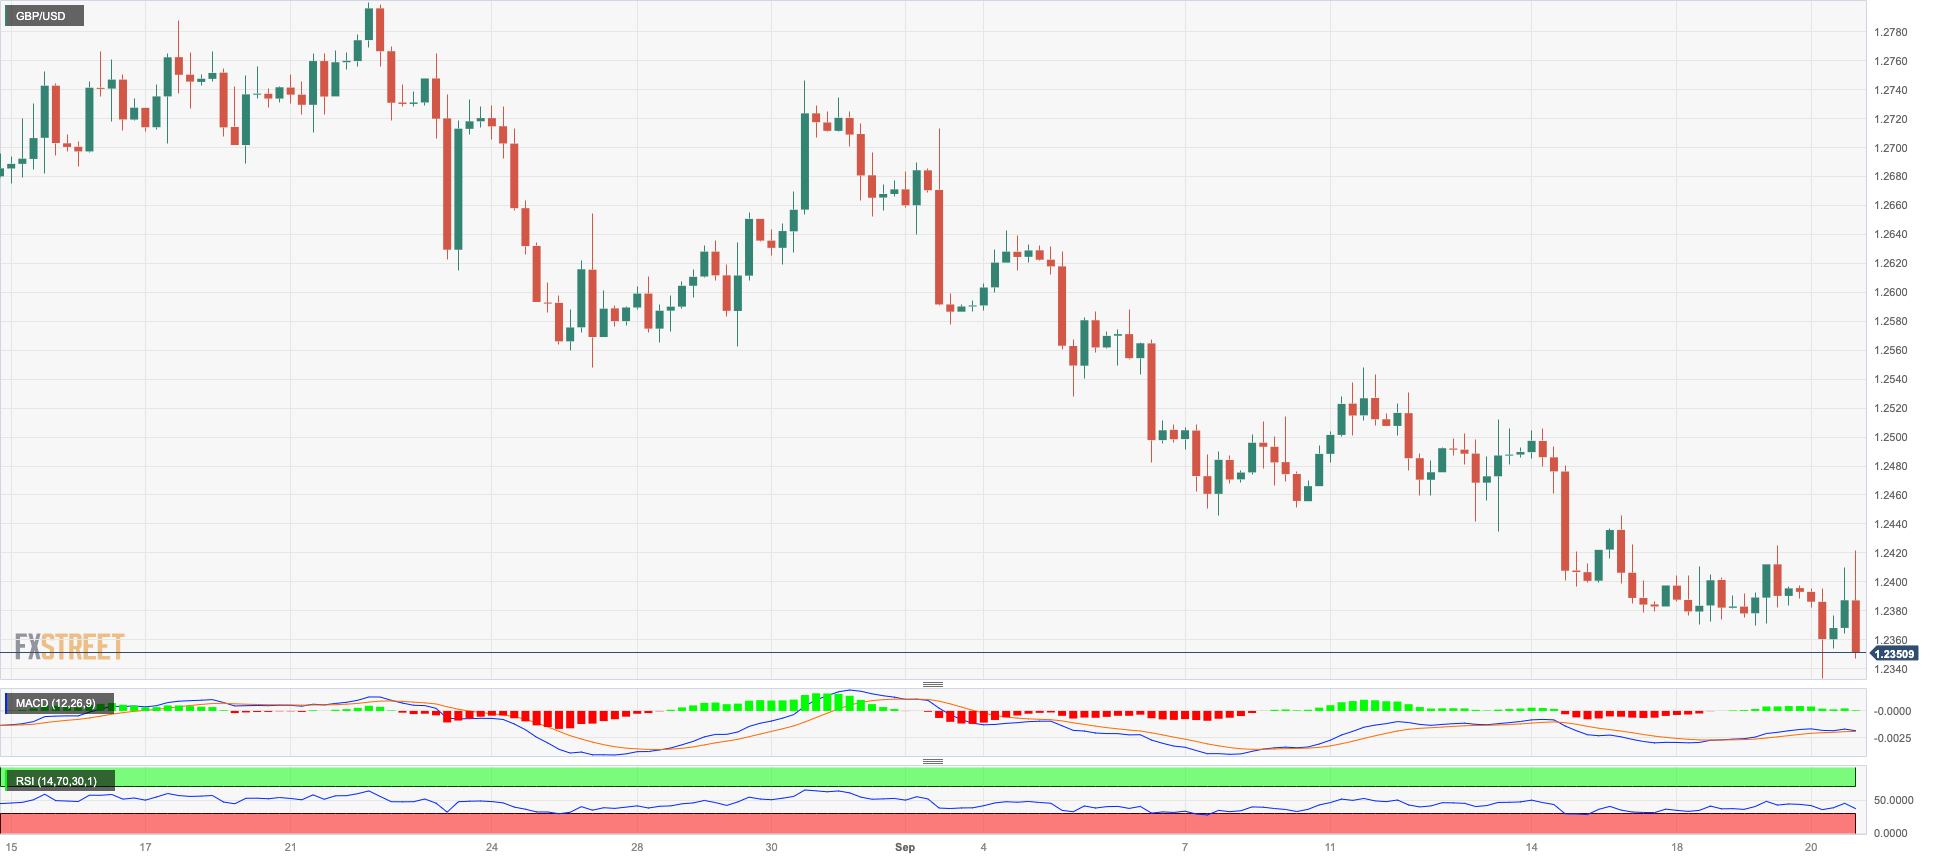
The Fed-driven bounce in the greenback weighed on the risk complex and sponsored another negative session for the British pound, pushing GBP/USD to the mid-1.2300s towards the closing bell in Wall Street on Wednesday.
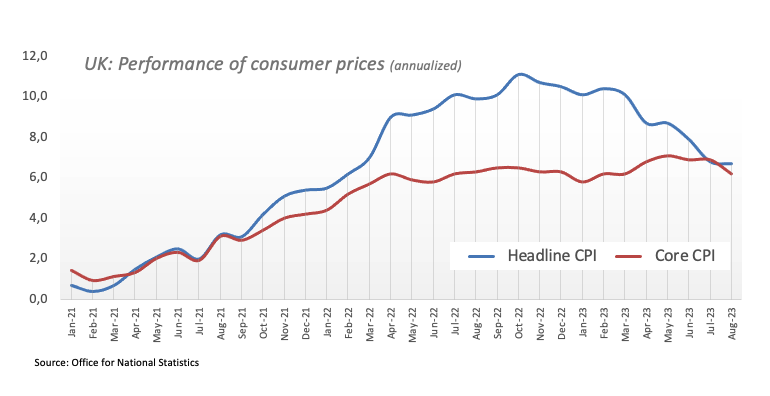
Against that backdrop, Cable could not sustain the rebound from fresh three-month lows near 1.2330 after the quid suffered investors’ repricing of further tightening by the BoE after the UK headline CPI rose 6.7% in the year to August and 6.2% over the last twelve months when excluding food and energy costs (Core CPI).
On this, the probability of a rate hike by the BoE at the September 21 meeting is now at 35%, down from more than 80% the previous day.
If GBP/USD breaches the September low at 1.12332 (September 20), it could then revisit the May low of 1.2308 (25 May). The breakdown of the latter could motivate the pair to embark on a probable move to the key round level at 1.2000 ahead of the 2023 low of 1.1802 (March 8). Instead, there is a first upside barrier at the 200-day SMA at 1.2431 seconded by the weekly high of 1.2548 (September 11). Up from here comes intermediate hurdles at the 100-day and 55-day SMAs at 1.2648 and 1.2714, respectively, prior to another weekly tops at 1.2746, 1.2818 (August 10) and 1.2995 (July 27), all ahead of the psychological milestone of 1.3000. On the daily chart, the RSI droped modestly below 30.
Resistance levels: 1.2424 1.2548 1.2613 (4H chart)
Support levels: 1.2332 1.2308 1.2274 (4H chart)
AUDUSD
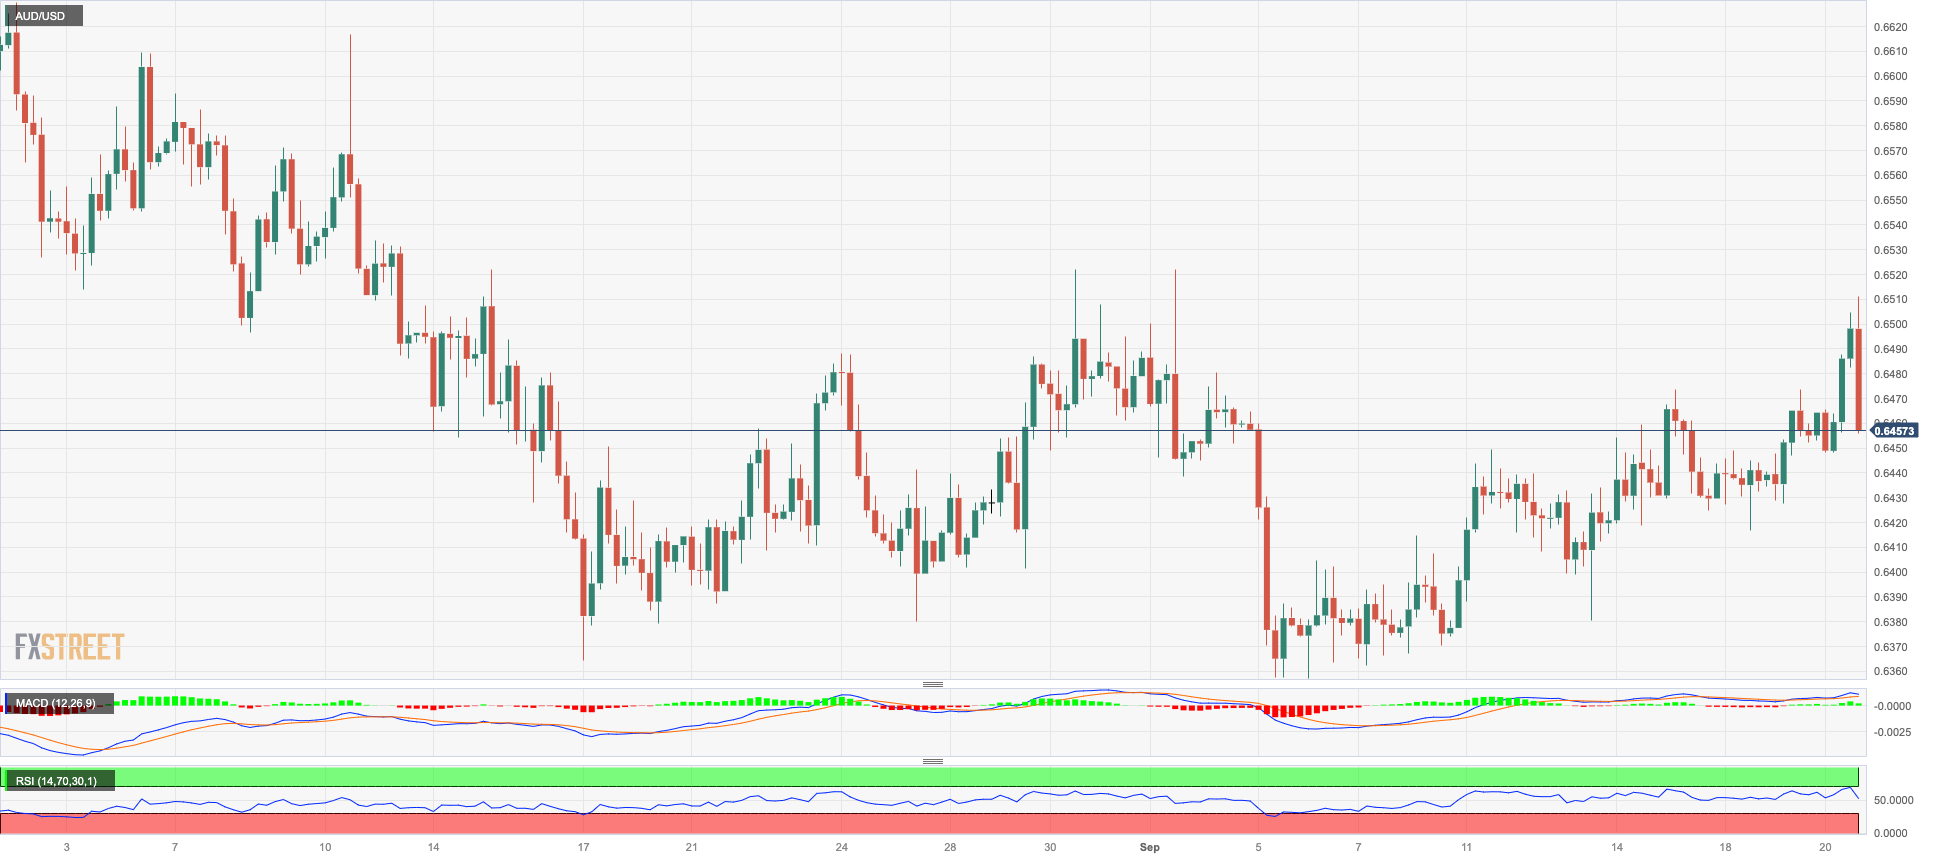
AUD/USD extended the recovery to new three-week highs just past the key 0.6500 the figure on Wednesday.
The positive price action in the Aussie dollar was also underpinned by the upbeat session in the commodity space and the generalized improvement in the risk-associated universe.
Data-wise Down Under, the Westpac Leading Index dropped to a monthly 0.04% in August.
For the AUD /USD, the 2023 low at 0.6357 (September 5) is immediately below, followed by the November 2022 low at 0.6272 (November 7) and the 2022 low at 0.6179 (October 13). Having said that, the immediate upside barrier could be found at the weekly high of 0.6522 (August 30), seconded by another weekly top at 0.6616 (August 10) and the 200-day SMA at 0.6698. Further gains could push the pair back to the July peak of 0.6894 (July 14) before hitting the June high of 0.6899 (June 16) and the critical level of 0.7000. The weekly top of 0.7029 (February 14) and the 2023 peak of 0.7157 (February 2) are both aligned north of here. The everyday RSI leapt past 56.
Resistance levels: 0.6502 0.6521 0.6616 (4H chart)
Support levels: 0.6380 0.6357 0.6272 (4H chart)
GOLD
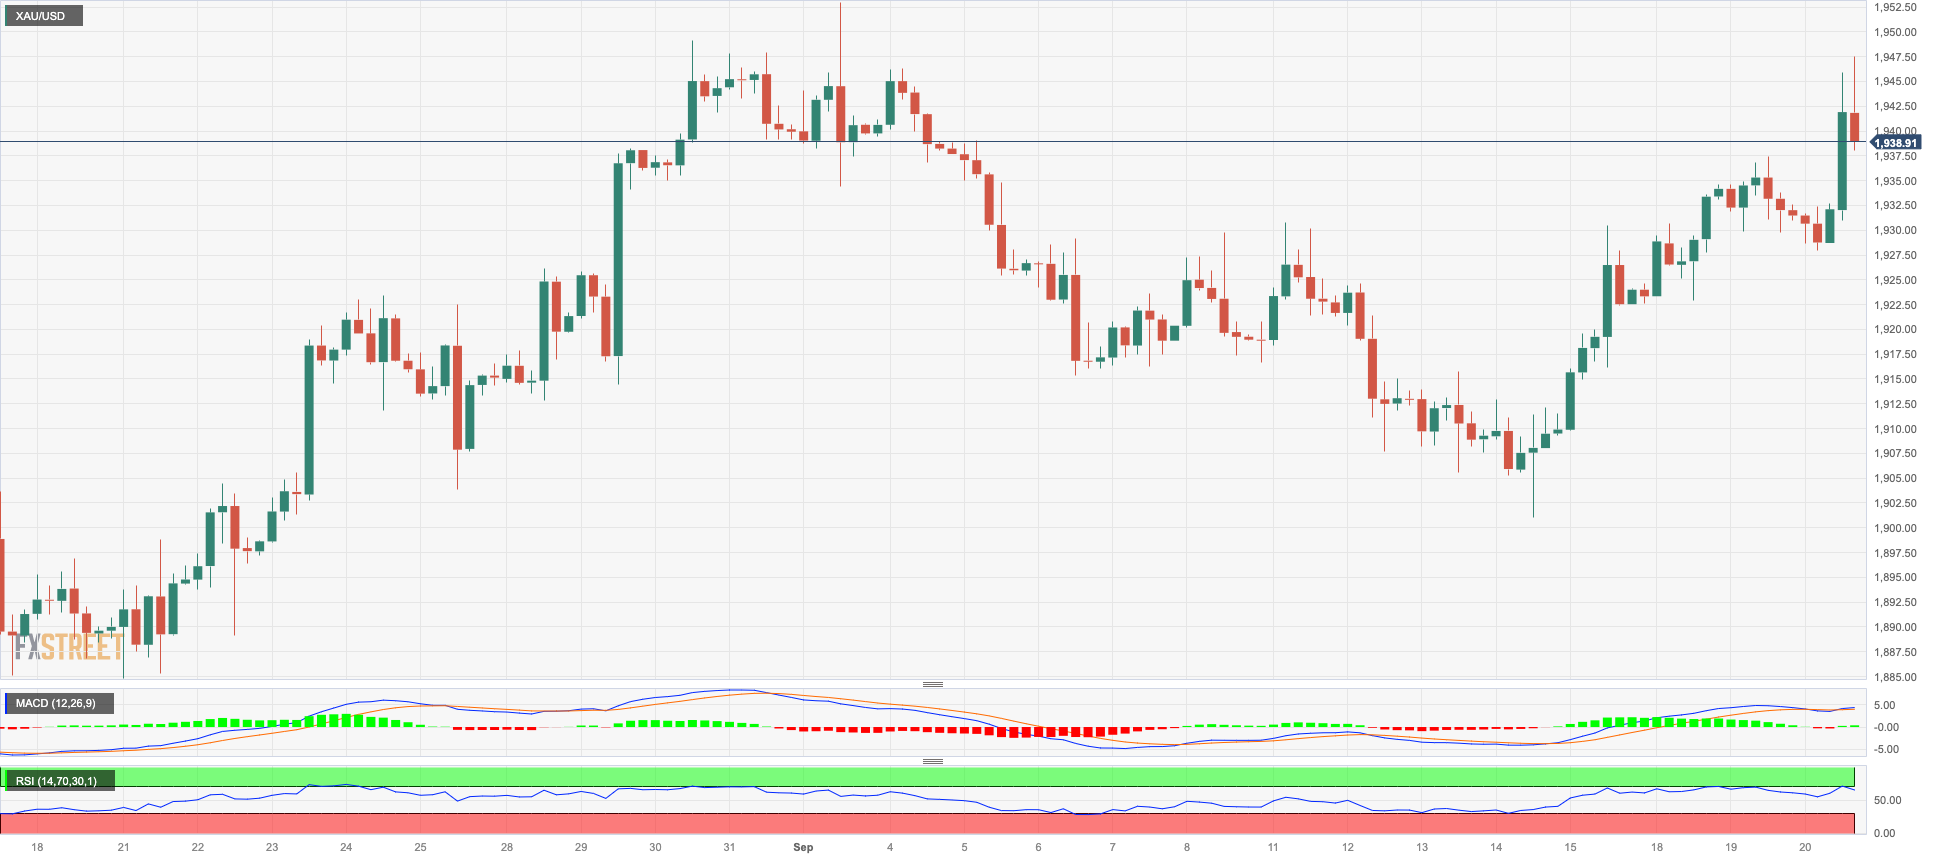
Gold prices rose for the fourth time in the last five days, this time reaching the $1945 region, where the transitory 100-day SMA also coincides.
Bullion managed to perform positively despite the rebound in the dollar along with diminishing US yields in the belly and the long end of the curve, leaving it at shouting distance from the September peaks past $1950 per troy ounce.
Furthermore, the precious metal managed well to maintain the balance despite the hawkish hold by the Federal Reserve at Wednesday’s gathering.
Extra upside in gold now aims for the September high of $1953 (September 1). A breakout of this zone might take us to the July top of $1987 (July 20), just below the psychological $2000 mark. A further rise from here might pave the way for a run at the 2023 peak of $2067 (May 4), ahead of the 2022 high of $2070 (March 8), and the all-time top of $2075 (August 7, 2020). There is immediate support, however, at the September low of $1901 (September 14), which correlates with the key conflict region at $1900 and precedes the August low of $1885 (August 17) and the 2023 low of $1804 (February 28), both of which overlap with the important contention area at $1800.
Resistance levels: $1944 $1953 $1987 (4H chart)
Support levels: $1924 $1901 $1884 (4H chart)
CRUDE WTI
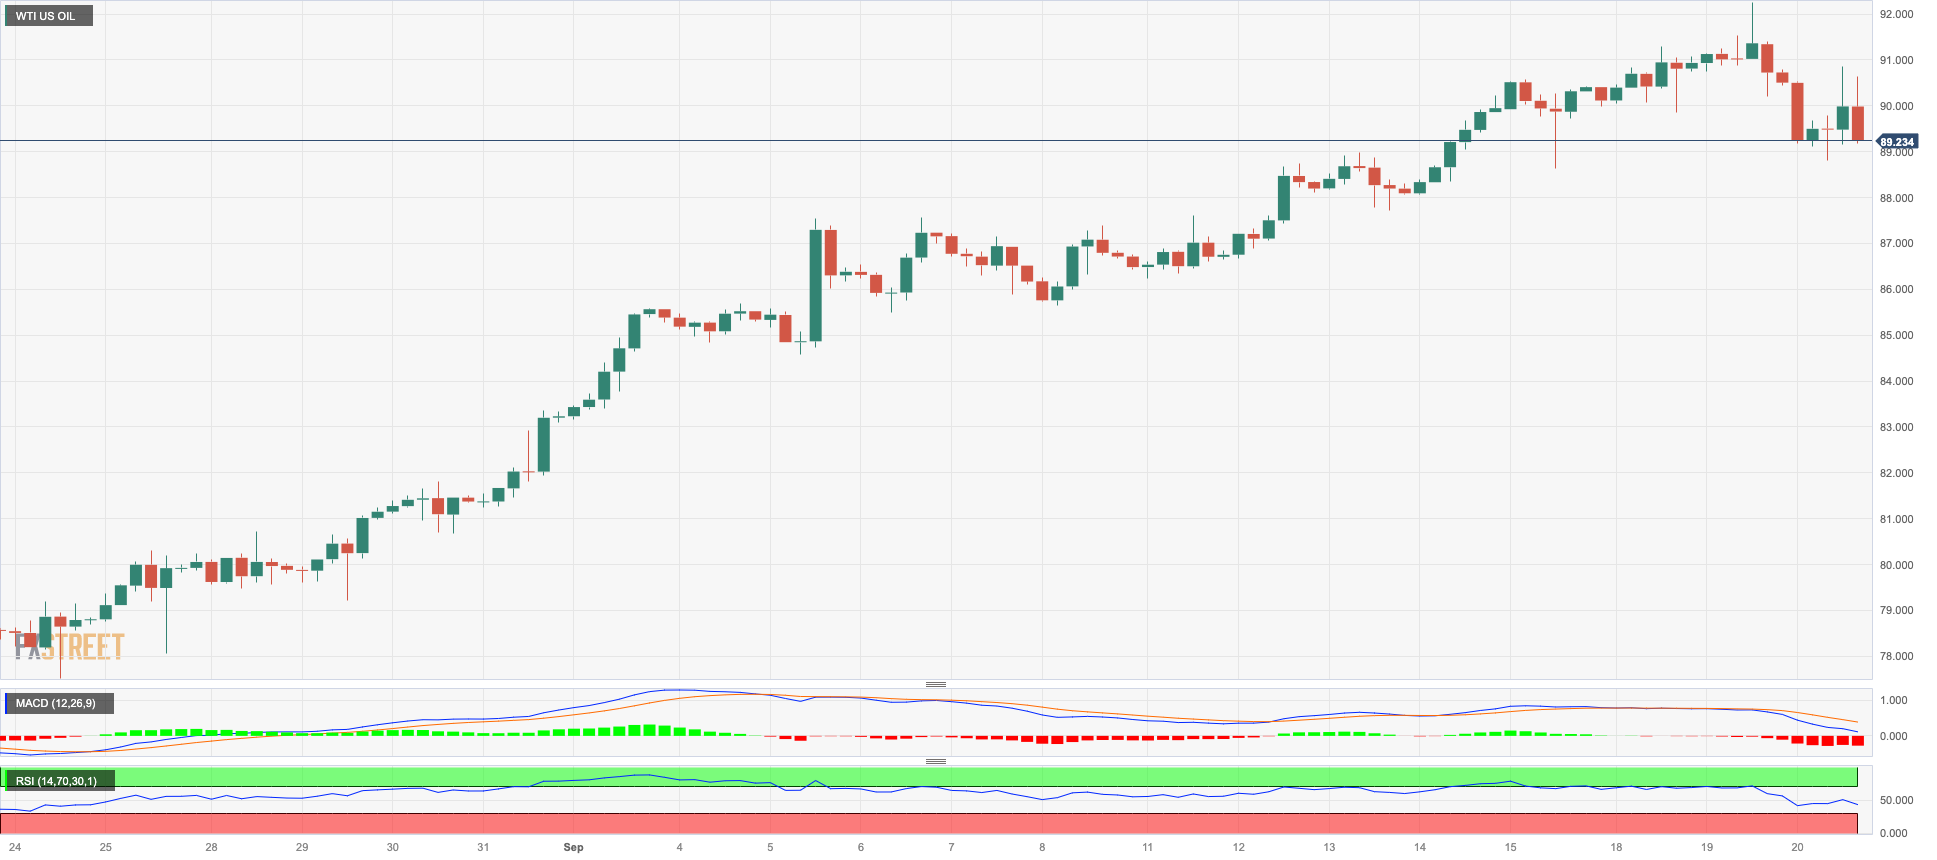
Prices of WTI briefly dropped to multi-day lows near the $89.00 mark per barrel on Wednesday.
The corrective move from recent overbought levels remained well and sound on Wednesday. Looking at the broader picture, the tight supply narrative continue to support the bullish case for the commodity, which was also helped by the weekly drop in US crude oil supplies as reported by the EIA.
Back to the EIA, the agency reported that US crude oil inventories shrank by 2.135M barrels in the week to September 15, while supplies at Cushing went down by 2.064M barrels, Weekly Distillate Stocks dropped by 2.867M barrels and gasoline stockpiles diminished by 0.831M barrels.
Given the present performance of the WTI price, the November 2022 high of $93.73 (November 7) appears to be the immediate hurdle to the uptrend, followed by the weekly top of $97.65 (August 30, 2022) and the crucial $100.00 per barrel. The initial level of support is the 55-day SMA at $81.60, seconded by the August low at $77.64 (August 24) and the key 200-day SMA at $76.75. The loss of this zone reveals weekly lows of $73.89 (July 17) and $66.86 (June 12), both of which comes before the 2023 low of $63.61 (May 4). Further south aligns the December 2021 low of $62.46 (December 2) prior to the critical $60.00 level.
Resistance levels: $92.29 $93.73 $97.65 (4H chart)
Support levels: $88.93 $88.25 $86.12 (4H chart)
GER40
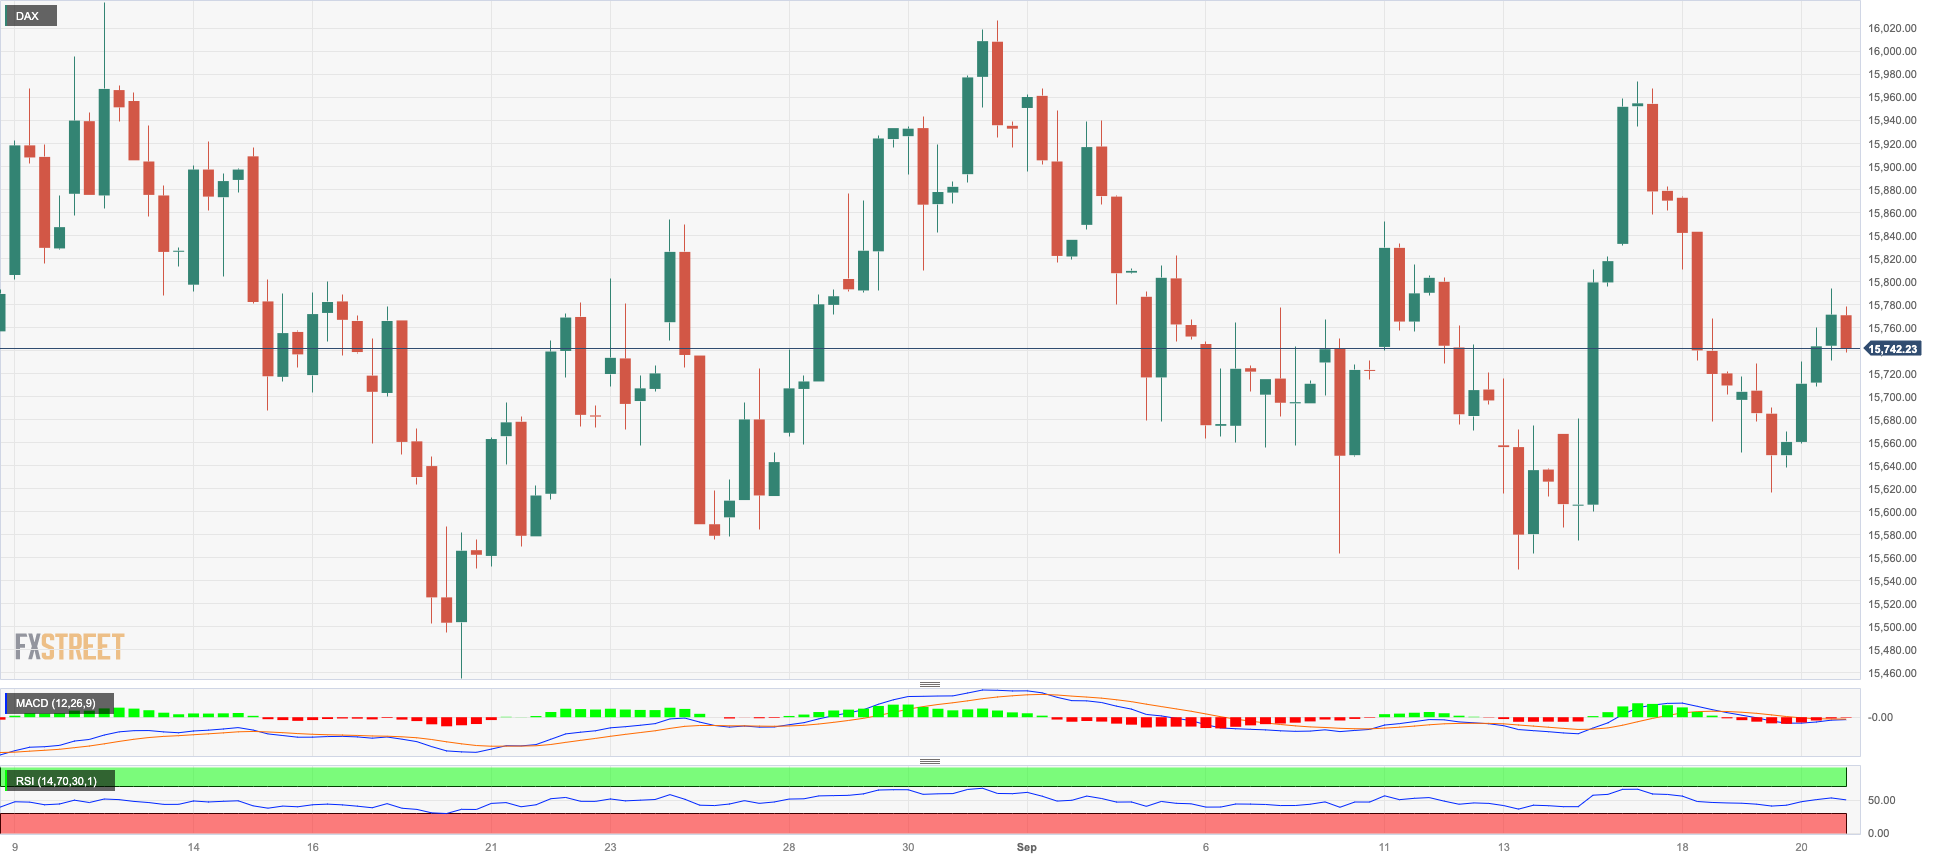
German stocks tracked by the DAX40 reversed two consecutive daily pullbacks and regained the vicinity of the 15800 region on Wednesday.
In fact, Germany’s reference index was no exception amidst the broad-based optimism in European stock markets on Wednesday, as investors largely anticipate the Federal Reserve to keep its rates unchanged, while lower-than-expected UK inflation figures also sparked speculation that the BoE could pause its hiking cycle at its event on September 21.
The above fell in line with renewed market chatter around the possibility that the ECB could also step the brake and enter an impasse at least until H2 2024.
The positive session in the index contrasted with the first decline after three straight sessions of gains in the 10-year bund yields, which receded to 2.70% following recent multi-week tops.
The DAX40 remains within a consolidative range for the time being. The resumption of the bearish bias could prompt the DAX40 to retest the important 200-day SMA at 15537, just above the August lows of 15468 (August 18) and the July low of 15456 (July 7). A deeper pullback may challenge the March low of 14458 (March 20), seconded by the December 2022 low of 13791 (December 20), and the 2022 low of 11862 (September 28). On the upside, the first barrier appears at the September high of 15989 (September 14), before the weekly tops of 16042 (August 31) and 16060 (August 10). If the price breaks above the latter level, investors' attention may be drawn to a potential visit to the all-time peak of 16528 (July 31). The daily RSI improved north of the 49 mark.
Best Performers: Sartorius AG VZO, Symrise AG, Zalando SE
Worst Performers: Rheinmetall AG, Allianz, Deutsche Boerse
Resistance levels: 15810 15989 16042 (4H chart)
Support levels: 15630 15564 15468 (4H chart)
NASDAQ
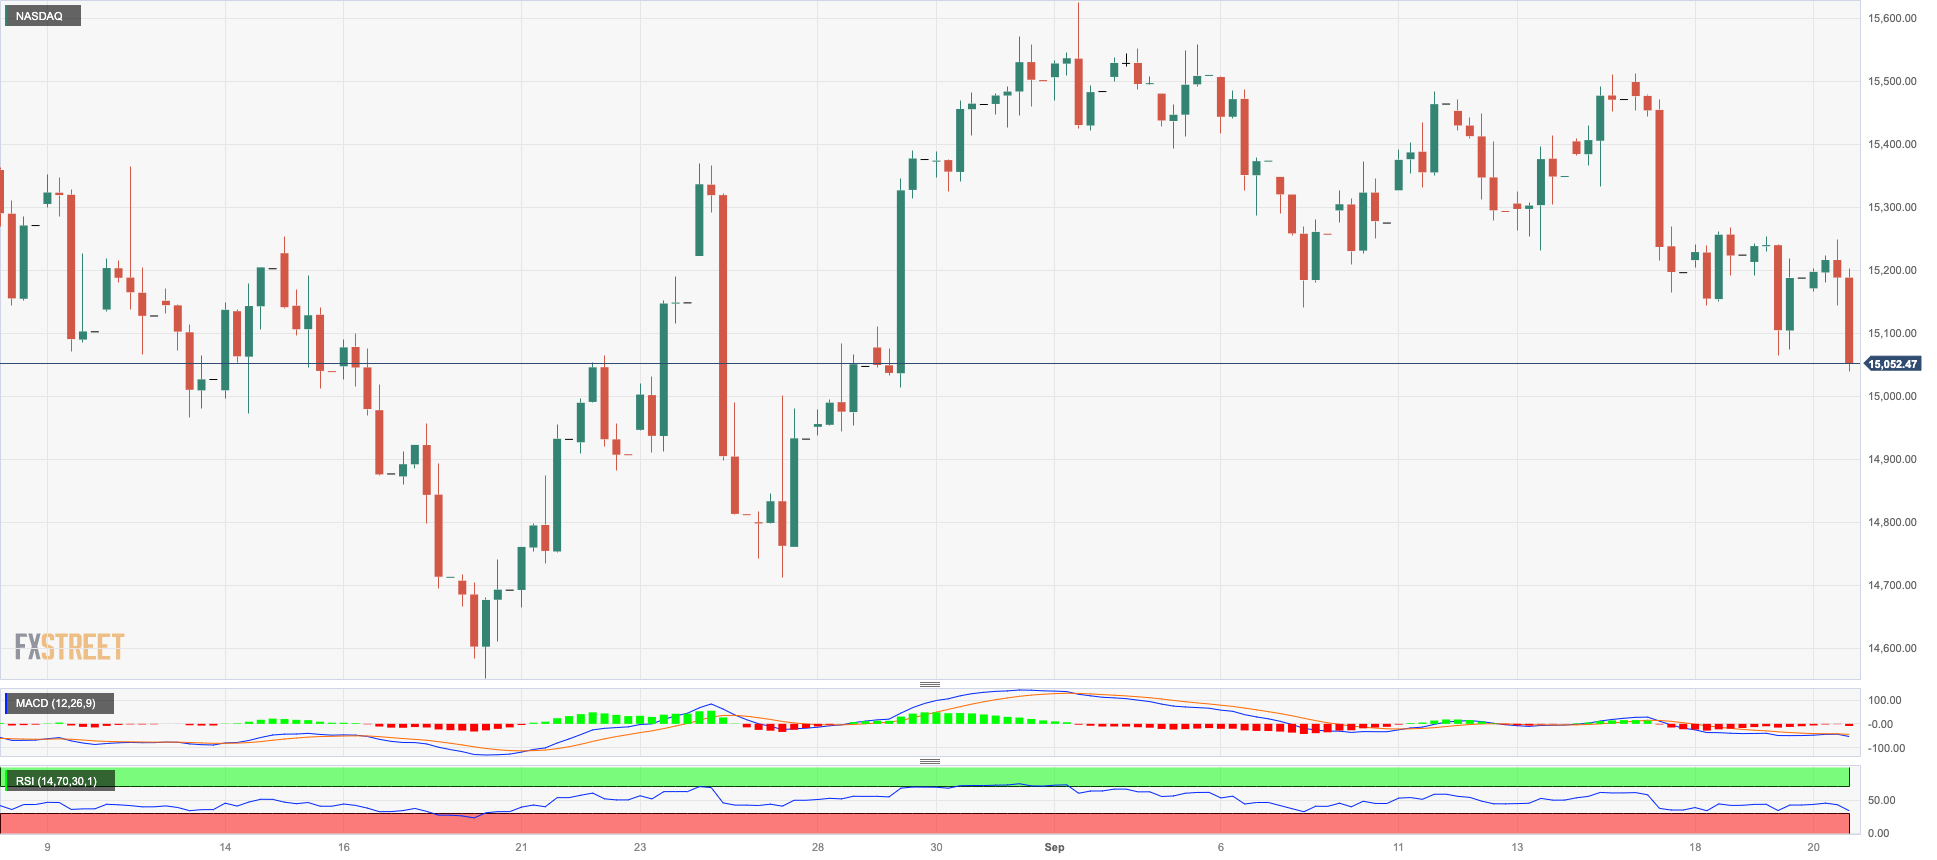
Further weakness saw the tech benchmark Nasdaq 100 retreat for the second session in a row on Wednesday.
In fact, the US tech sector succumbed to the late recovery in the dollar as well as the U-turn in yields in the short end of the curve, all in response to the hawkish hold by the Fed and the upbeat assessment of the Committee, where members left the door open to further tightening.
If the bulls regain control, the Nasdaq 100 should reach the September high of 15618 (September 1) before hitting the weekly top of 15803 (July 31). The 2023 peak at 15932 (July 19) is followed by the round 16000 level to the north. In contrast, a tiny weekly low has formed around 14715 (August 25), which seems to be supported by the proximity of the interim 100-day SMA at 14788, preceding the August low of 14557 (August 18). If this level is broken, the weekly lows of 14283 (June 7) and 13520 (May 24) will be recaptured before reaching the 200-day SMA at 13453. The RSI eased to the sub-47 zone.
Top Gainers: Amgen, Enphase, Lululemon Athletica
Top Losers: Intel, PDD Holdings DRC, Align
Resistance levels: 15512 15618 15803 (4H chart)
Support levels: 15069 14715 14557 (4H chart)
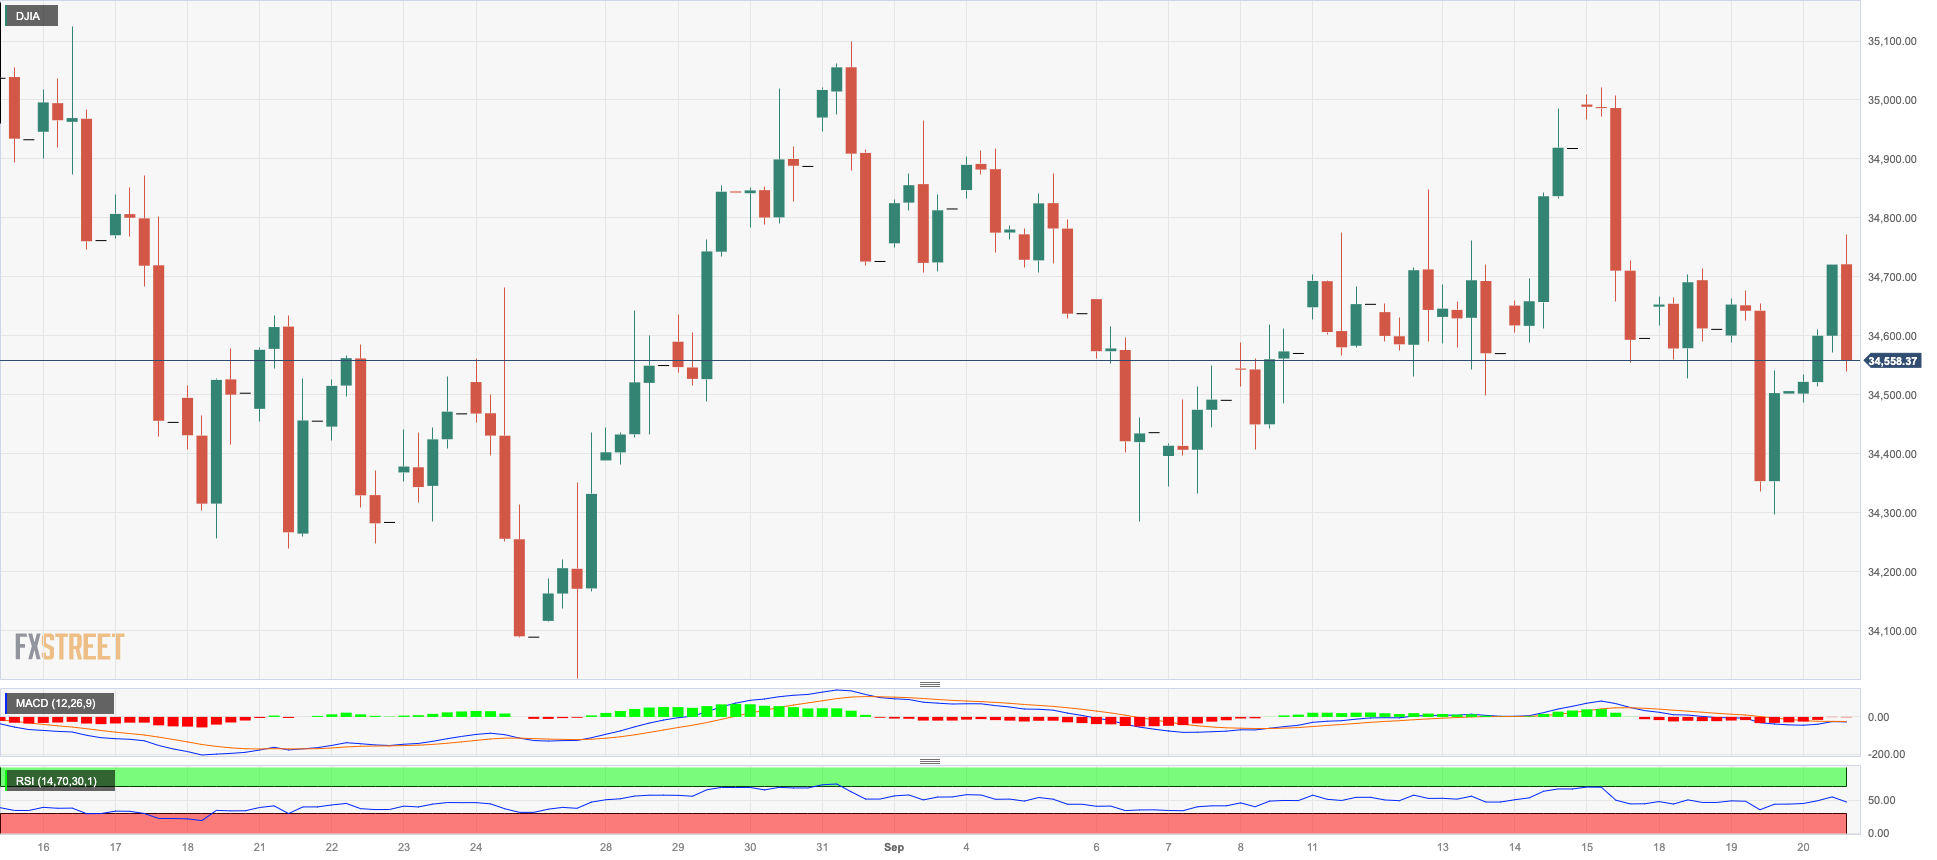
DOW JONES
US equities tracked by the Dow Jones rebounded markedly and set aside Tuesday’s multi-day lows, reaching the 34800 region, where the transitory 55-day SMA also sits.
The index maintained the daily advance in spite of the Fed’s hawkish hold, where the Committee left the door open to further hikes in case of need while revising up its projections for economic growth at the time when members reiterated that inflation remains elevated and well above the target.
All in all, the Dow Jones gained 0.34% to 34634, the S&P500 retreated 0.16% to 4436, and the tech-heavy Nasdaq Composite deflated 0.43% to 13619.
Next on the upside for the Dow Jones comes the weekly top at 34977 (September 14) ahead of another weekly peak at 35070 (August 31). This level is immediately followed by the 2023, high 35679 (August 1), and the 2022 of 35824 (February 9). If the latter level is surpassed, it could potentially lead to a test of the all-time high at 36952 (January 5, 2022). On the other hand, if the Dow Jones falls below the September low of 34291 (September 6), it might refocus attention on testing the August low of 34029 (August 25), before possibly approaching the 200-day SMA at 33810. Further south of this point, we would encounter the July low at 33705 (July 10), seconded by the May low at 32586 (May 25), and the 2023 low of 31429 (March 15). The daily RSI edged a tad higher to the proximity of 49.
Top Performers: Amgen, UnitedHealth, IBM
Worst Performers: Intel, Apple, Microsoft
Resistance levels: 34977 35070 35578 (4H chart)
Support levels: 34311 34029 33705 (4H chart)
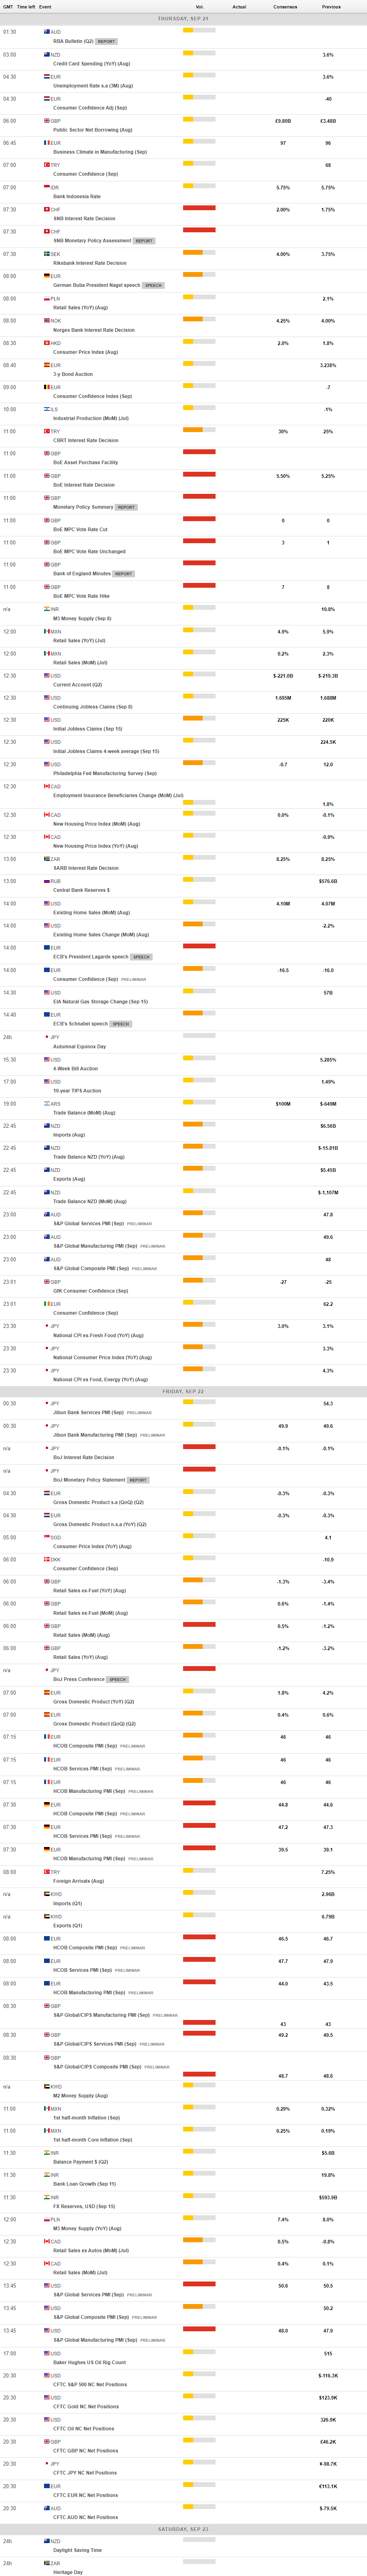
MACROECONOMIC EVENTS
All Information & Updates provided by:

All information relating to the financial markets available on this page has been prepared and issued by FXStreet (Forexstreet SL, Spain, Reg: B62498233) on the basis of publicly available information and all information believed to be reliable and does not conflict with Kuwaiti local laws, and all necessary care has been taken to before the company to ensure that the facts mentioned are correct from the source.
NCM Investment nor any of its directors or employees shall in any way be held responsible for the contents of this news, and the information contained on this page is intended only to provide clients with publicly available information and should not be construed as investment advice, report or analysis and/or constitute an offer or invitation to buy or sell financial instruments of any kind.
RISK WARNING: Forex and CFDs are highly risky leveraged products, as losses can exceed deposits. Please ensure you understand all the risks and take independent advice if necessary. NCM will segregate the clients based on the criteria of the regulator and its bylaws. NCM does not provide any advisory service; the material published does not constitute advice or a recommendation for a transaction in any financial instrument. NCM accepts no responsibility for any use of the content presented and any consequences of that use. Anyone acting on the information provided does so at their own risk.