
- Contact Us:
-

-

-

-


Daily Market Updates
22 Sep 2023
USDJPY
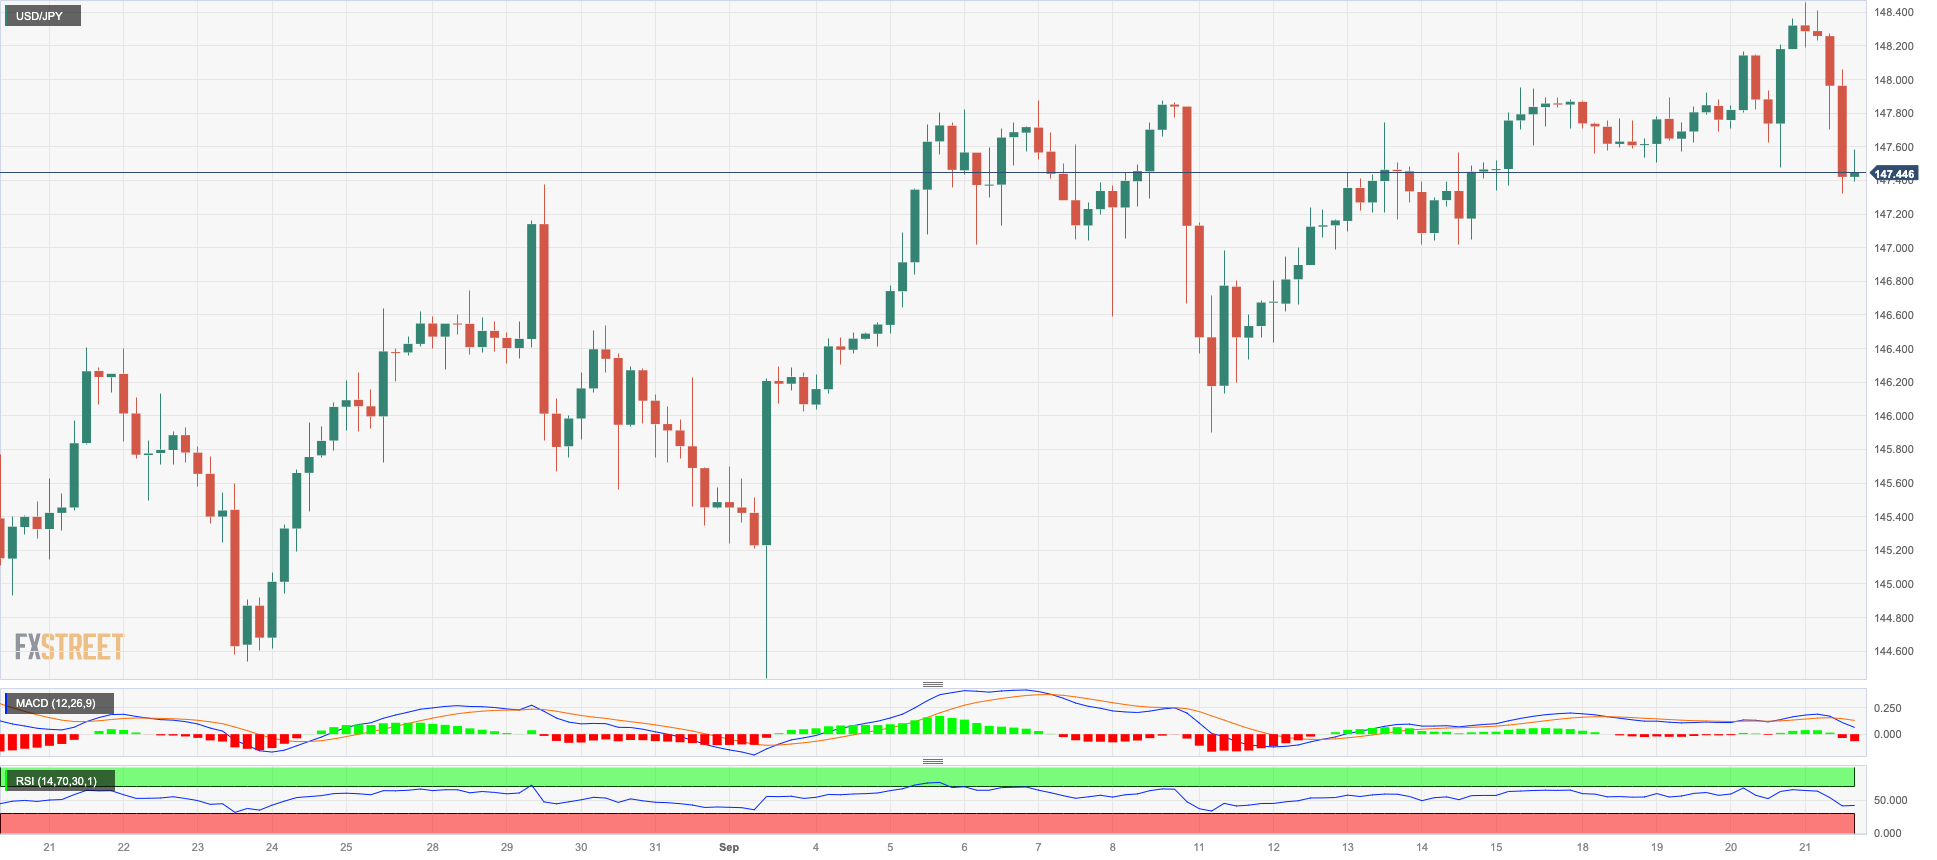
USD/JPY dropped to five-day lows and revisited the 147.30 region before hitting fresh 2023 peaks near 148.50 on Thursday.
The resumption of buying interest in the Japanese yen sponsored the daily pullback in spot along with the late knee-jerk in the greenback, mixed US yields, and a marked rebound in the Japanese JGB 10-year yields past 0.76%.
Bolstering the fresh demand for the yen appeared further warnings by Japan’s Chief Cabinet Sec. Masuno, who suggested that the government will respond appropriately to FX moves, while a poll showed that nearly 80% of economists agreed that the BoJ will end its current YCC at some point by the end of 2024.
There were no data releases scheduled in Japan on Thursday.
If USD/JPY goes over the 2023 high of 148.46 (September 200, it may test the 2022 top of 151.95 (October 21). On the downside, there is a minor support at the weekly low of 145.89 (September 11), which comes before the transitory 55-day SMA of 144.11. South of here, the August low of 141.50 (August 7) shows, followed by the weekly low of 138.05 (July 28) and the 200-day SMA at 137.55. A lower retracement might put the weekly low of 133.01 (April 26) in jeopardy, as well as lower levels of 132.01 (April 13) and 130.62 (April 5). The RSI weakened to the 57 zone.
Resistance levels: 148.46 148.84 149.45 (4H chart)
Support levels: 147.36 147.01 145.89 (4H chart)
GBPUSD
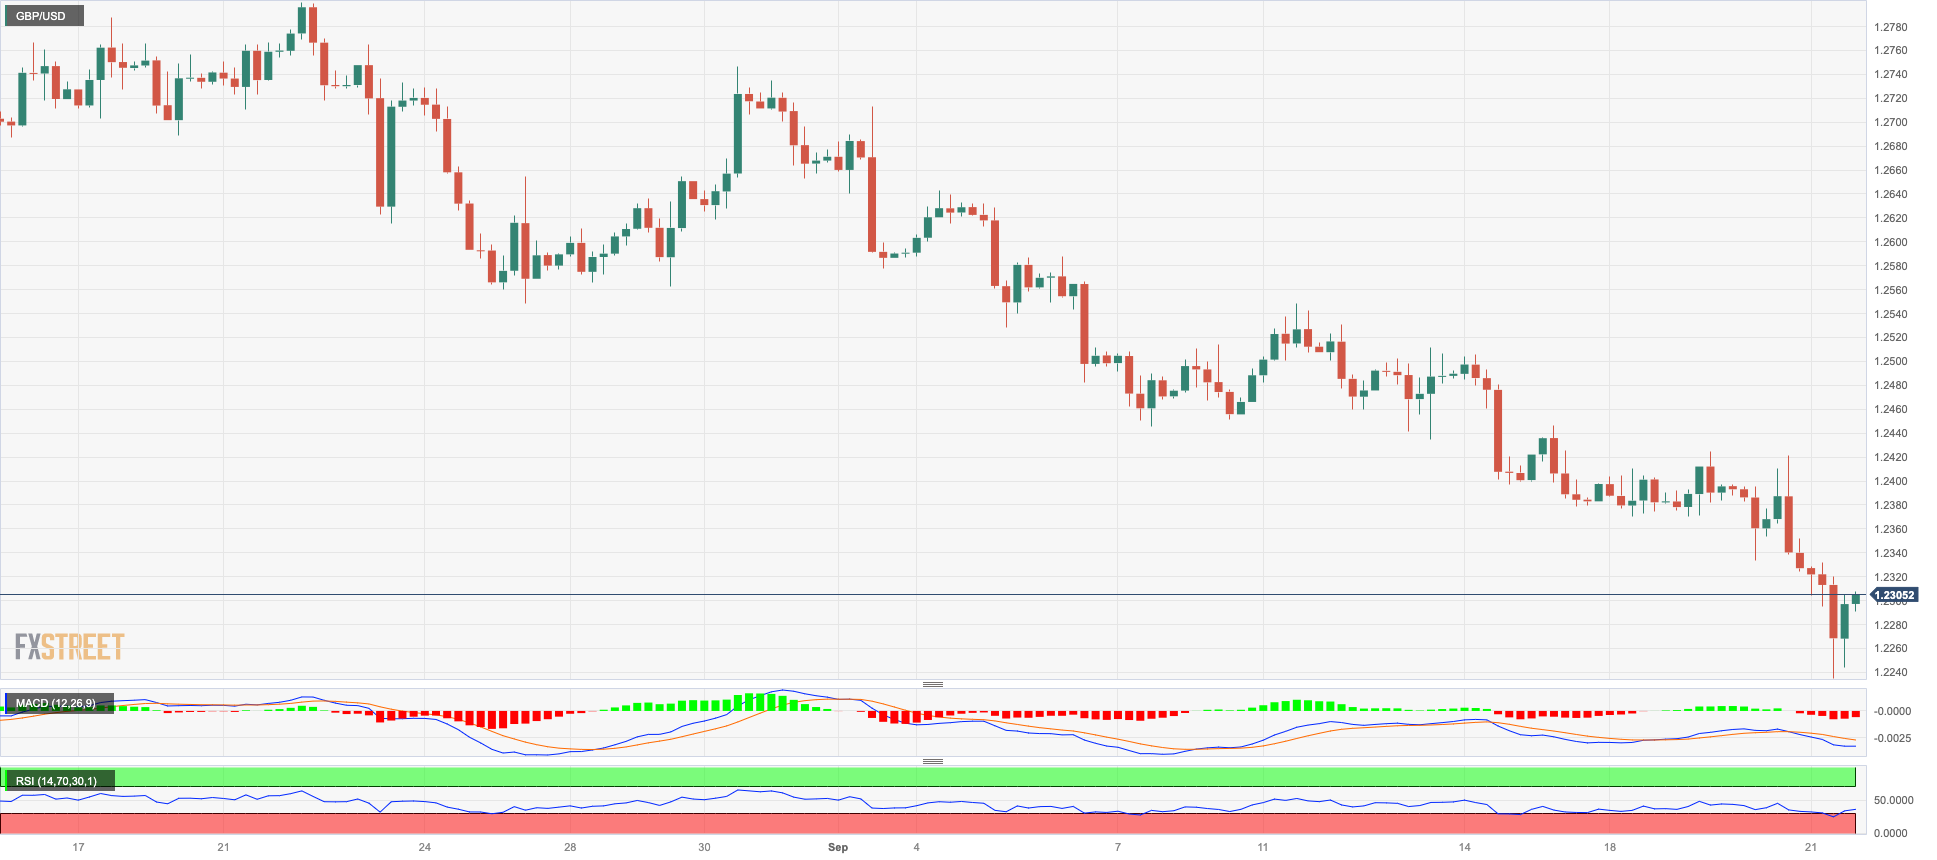
Further weakness hurt the British pound and dragged GBP/USD to new six-month lows near 1.2230 on Thursday, although Cable managed to regain the 1.2300 neighbourhood towards the end of the NA session.
In fact, the sterling saw its decline accelerate after the BoE unexpectedly kept its policy rate unchanged at 5.25% vs. expectations of a 25 bps rate hike. The decision to keep rates on hold was divided, as MPC members Bailey, Broadbent, Dhingra, Pill, and Ramsden voted to keep rates unchanged, while their colleagues Cunliffe, Haskel, and Mann favoured a 25-bps rate raise.
The “Old Lady” justified its decision by the downward trend seen in domestic inflation in addition to some signs of cooling from the UK labour market. The bank, however, reiterated its readiness to hike rates further in case inflation resumes the upside.
In the wake of the BoE’s surprising decision, investors now expect the central bank to maintain the policy rates unchanged for the remainder of the year.
More from the UK docket saw Public Sector Net Borrowing contract by £10.756B during August.
If GBP/USD breaks the September low of 1.2236 (September 21), it could subsequently revisit the key round level at 1.2000 ahead of the 2023 low at 1.1802 (March 8). Instead, there is a first upside barrier at the 200-day line SMA at 1.2431, followed by the weekly high at 1.2548 (September 11). From here, there are intermediate hurdles at the 100-day and 55-day SMAs at 1.2645 and 1.2705, respectively, before weekly tops at 1.2746 (August 30), 1.2818 (August) 10 and 1.2995 (July 27), all ahead of the psychological milestone of 1.3000. On the daily chart, the RSI sank to the oversold territory around 26.
Resistance levels: 1.2421 1.2548 1.2613 (4H chart)
Support levels: 1.2236 1.2189 1.2178 (4H chart)
AUDUSD
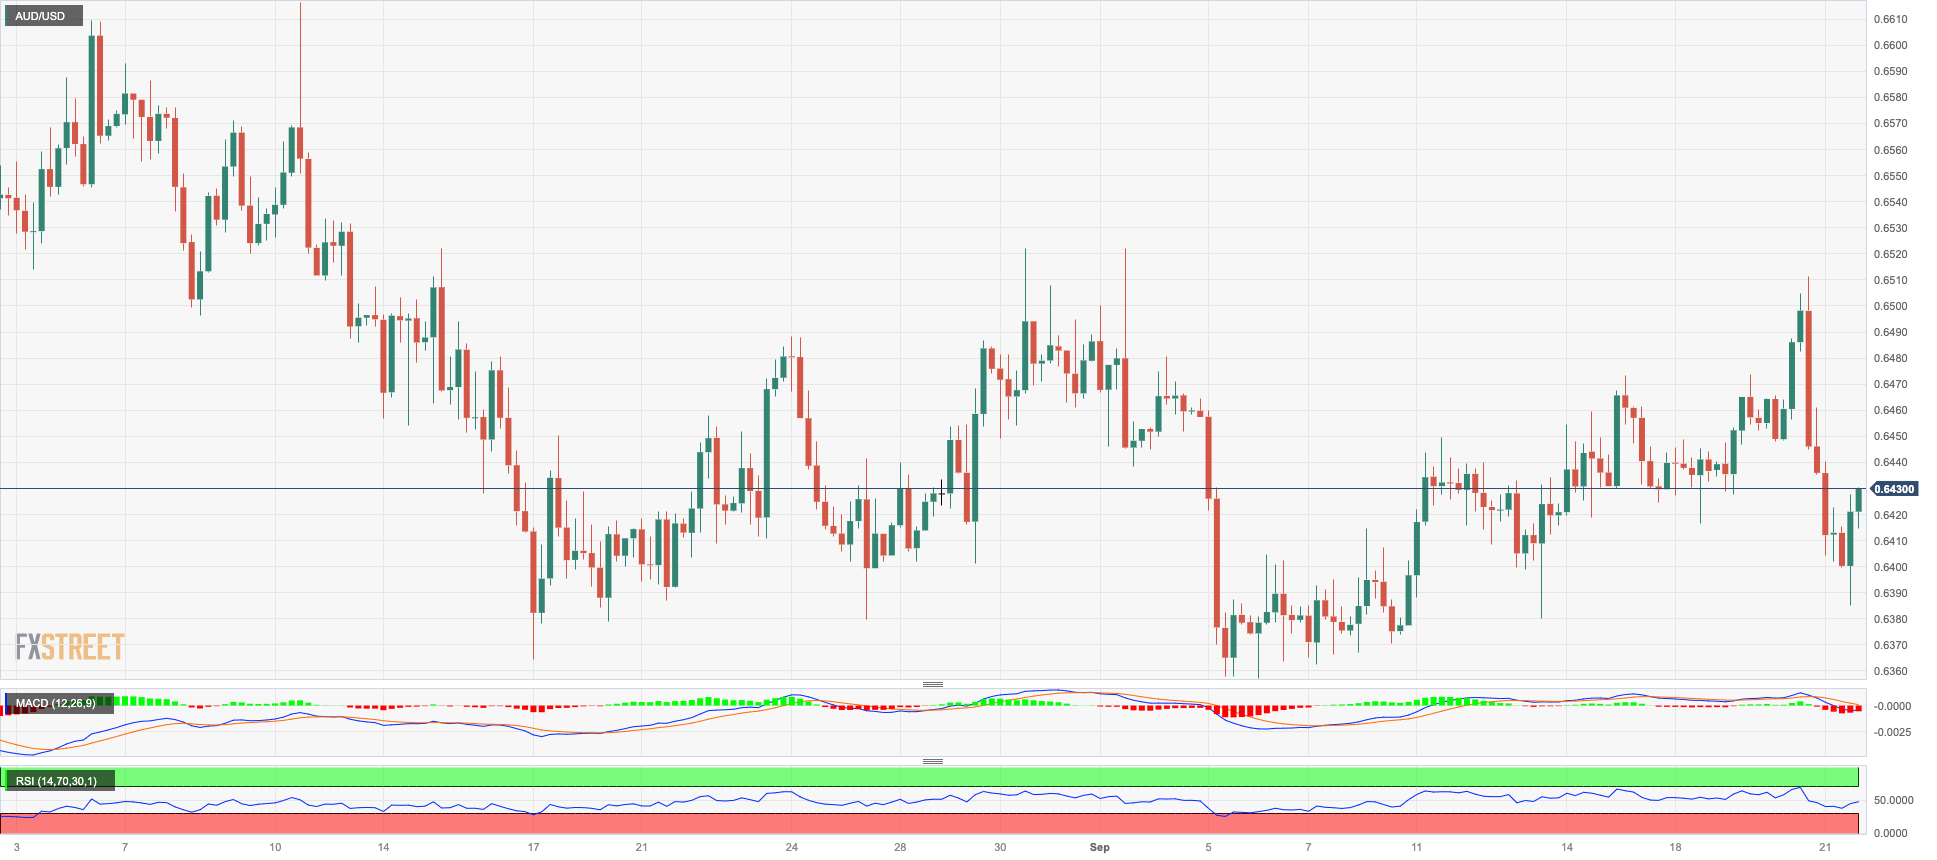
The prevailing risk-off tone weighed once again on the Aussie dollar and sparked the second straight session of losses in AUD/USD, this time printing multi-day lows near 0.6380 on Thursday.
Also playing against any recovery attempt in the pair emerged the generalized bearish performance of the commodity universe, where copper prices dropped to multi-week lows and iron ore printed traded with modest losses.
The Australian calendar was empty on Thursday.
For the AUD /USD, the 2023 low at 0.6357 (September 5) is immediately below, seconded by the November 2022 low at 0.6272 (November 7) and the 2022 low at 0.6179 (October 13). Instead, the immediate upside barrier could be found at the weekly high of 0.6522 (August 30), ahead of another weekly top at 0.6616 (August 10) and the 200-day SMA at 0.6696. Further gains could push the pair back to the July high of 0.6894 (July 14) prior to the June top of 0.6899 (June 16) and the critical level of 0.7000. The weekly peak of 0.7029 (February 14) and the 2023 high of 0.7157 (February 2) are both aligned north of here. The RSI on the daily chart slipped back to the 45 region.
Resistance levels: 0.6447 0.6511 0.6521 (4H chart)
Support levels: 0.6385 0.6357 0.6272 (4H chart)
GOLD
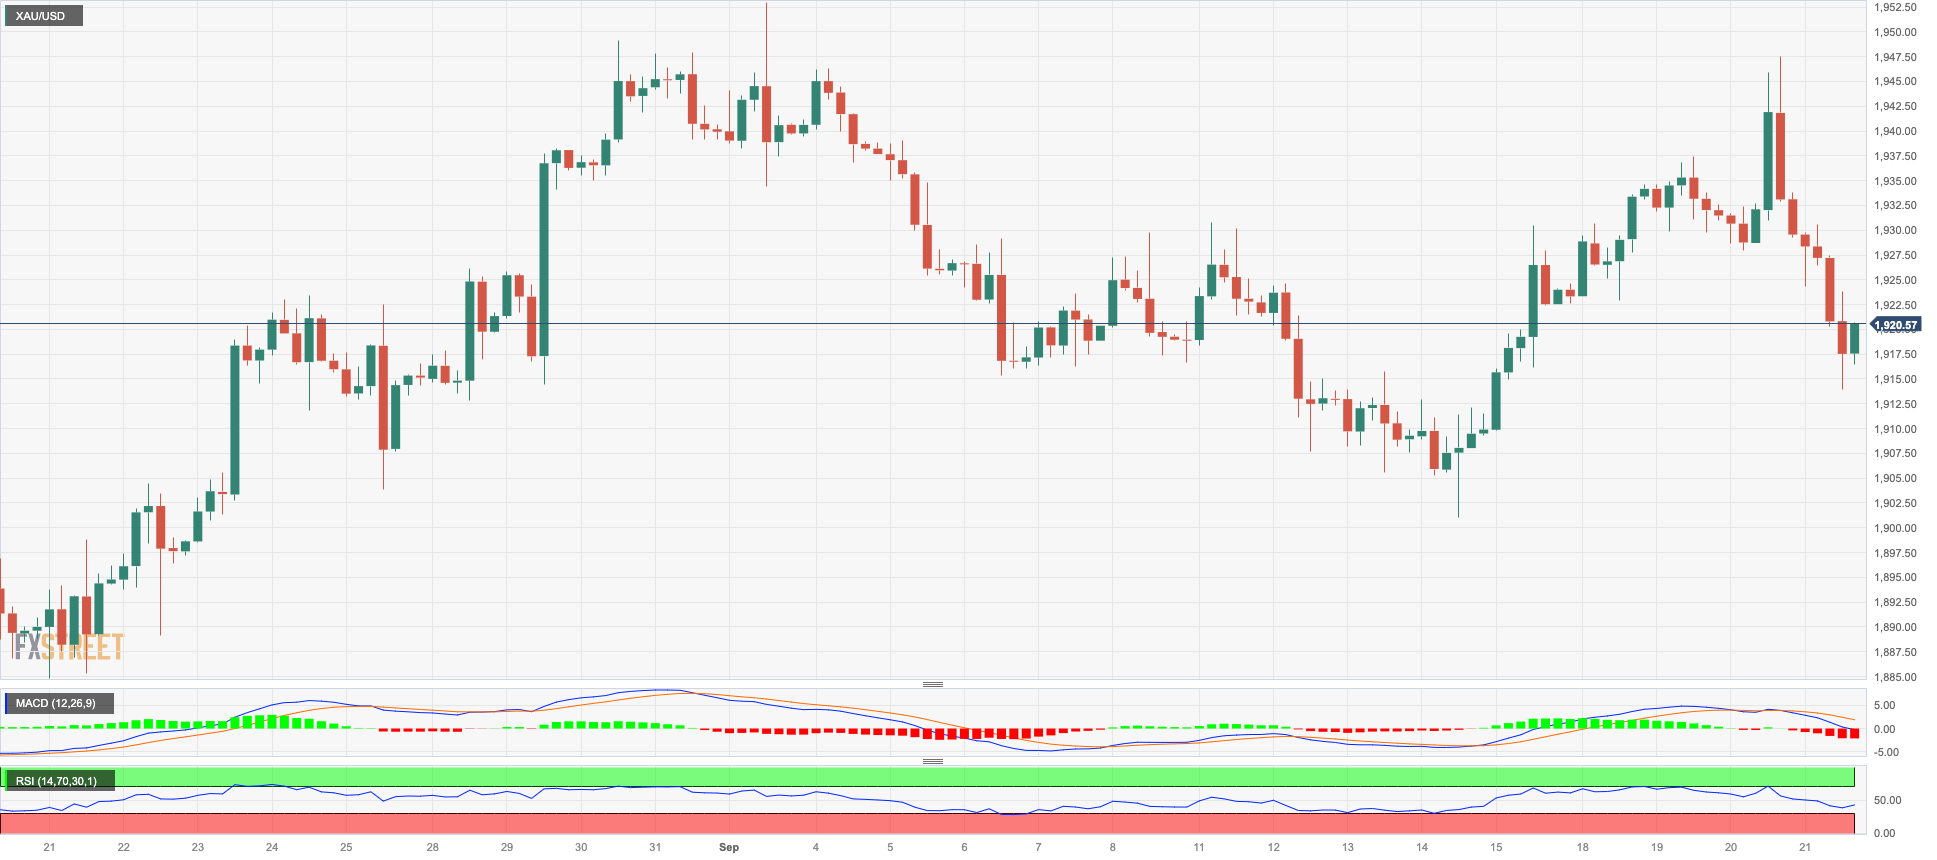
Prices of the troy ounce of the precious metal retreated for the third session in a row and briefly approached the $1910 zone on Thursday.
Despite the upside bias in the greenback losing traction as the session progressed, it seems to have been enough to keep bullion’s price action depressed, while the sharp bound in the belly and the long end of the US yield curve also contributed to the selling bias in the yellow metal on Thursday.
Additionally, the resumption of the tighter-for-longer narrative around the Federal Reserve also collaborated with the daily retracement and is expected to keep the metal under pressure for the time being.
Extra gold upside now targets the September high of $1953 (September 1). A break through this zone might lead us to the July high of $1987 (July 20), just below the psychological $2000 level. A further climb from here might open the way for a run at the 2023 peak of $2067 (May 4), which would be followed by the 2022 high of $2070 (March 8), and the all-time high of $2075 (August 7, 2020). However, there is immediate support at the September low of $1901 (September 14), which corresponds with the major conflict zone at $1900 and precedes the August low of $1885 (August 17) and the 2023 low of $1804 (February 28), both of which overlap with the critical conflict region at $1800.
Resistance levels: $1947 $1953 $1987 (4H chart)
Support levels: $1913 $1901 $1884 (4H chart)
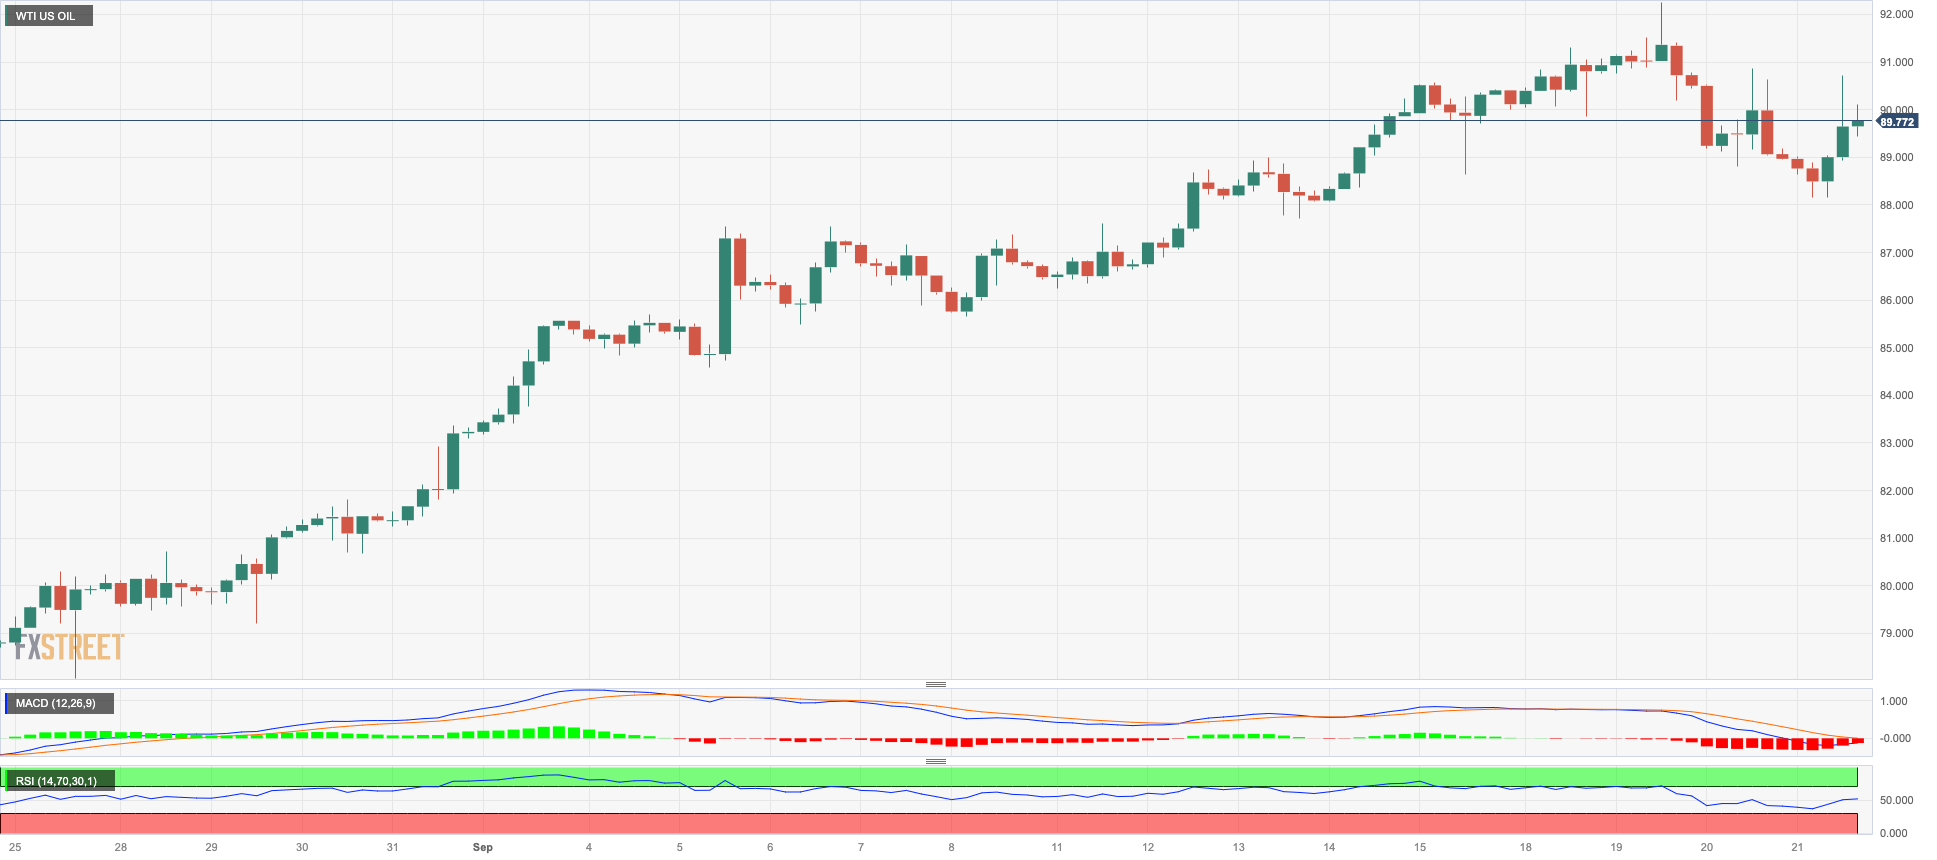
CRUDE WTI
After bottoming out in the $88.40 region, WTI prices managed to regain composure and returned to the key $90.00 neighbourhood per barrel on Thursday.
News that Russia banned its exports of gasoline and diesel to all countries except Belarus, Kazakhstan, Armenia, and Kyrgyzstan lends support to crude oil prices.
In addition, the late retracement in the greenback in combination with the persistent tight supply narrative and recent drop in US crude oil inventories all contributed to the decent rebound in prices of the commodity after two consecutive sessions of losses.
Given the current performance of the WTI price, the 2023 high at $92.63 (September 19) looks to be the immediate obstacle to the uptrend, followed by the November 2022 top of $93.73 (November 7) and the weekly peak of $97.65 (August 30, 2022). The surpass of the latter could put a potential visit to the psychological $100.00 mark per barrel back on the radar. By contrast, the 55-day SMA at $81.89 provides first support, followed by the August low at $77.64 (August 24) and the important 200-day SMA at $76.84. When this zone is breached, weekly lows of $73.89 (July 17) and $66.86 (June 12) are revealed, both of which come before the 2023 low of $63.61 (May 4). Further south, the December 2021 low of $62.46 (December 2) is aligned before the key $60.00 level.
Resistance levels: $92.29 $93.73 $97.65 (4H chart)
Support levels: $88.34 $86.12 $84.99 (4H chart)
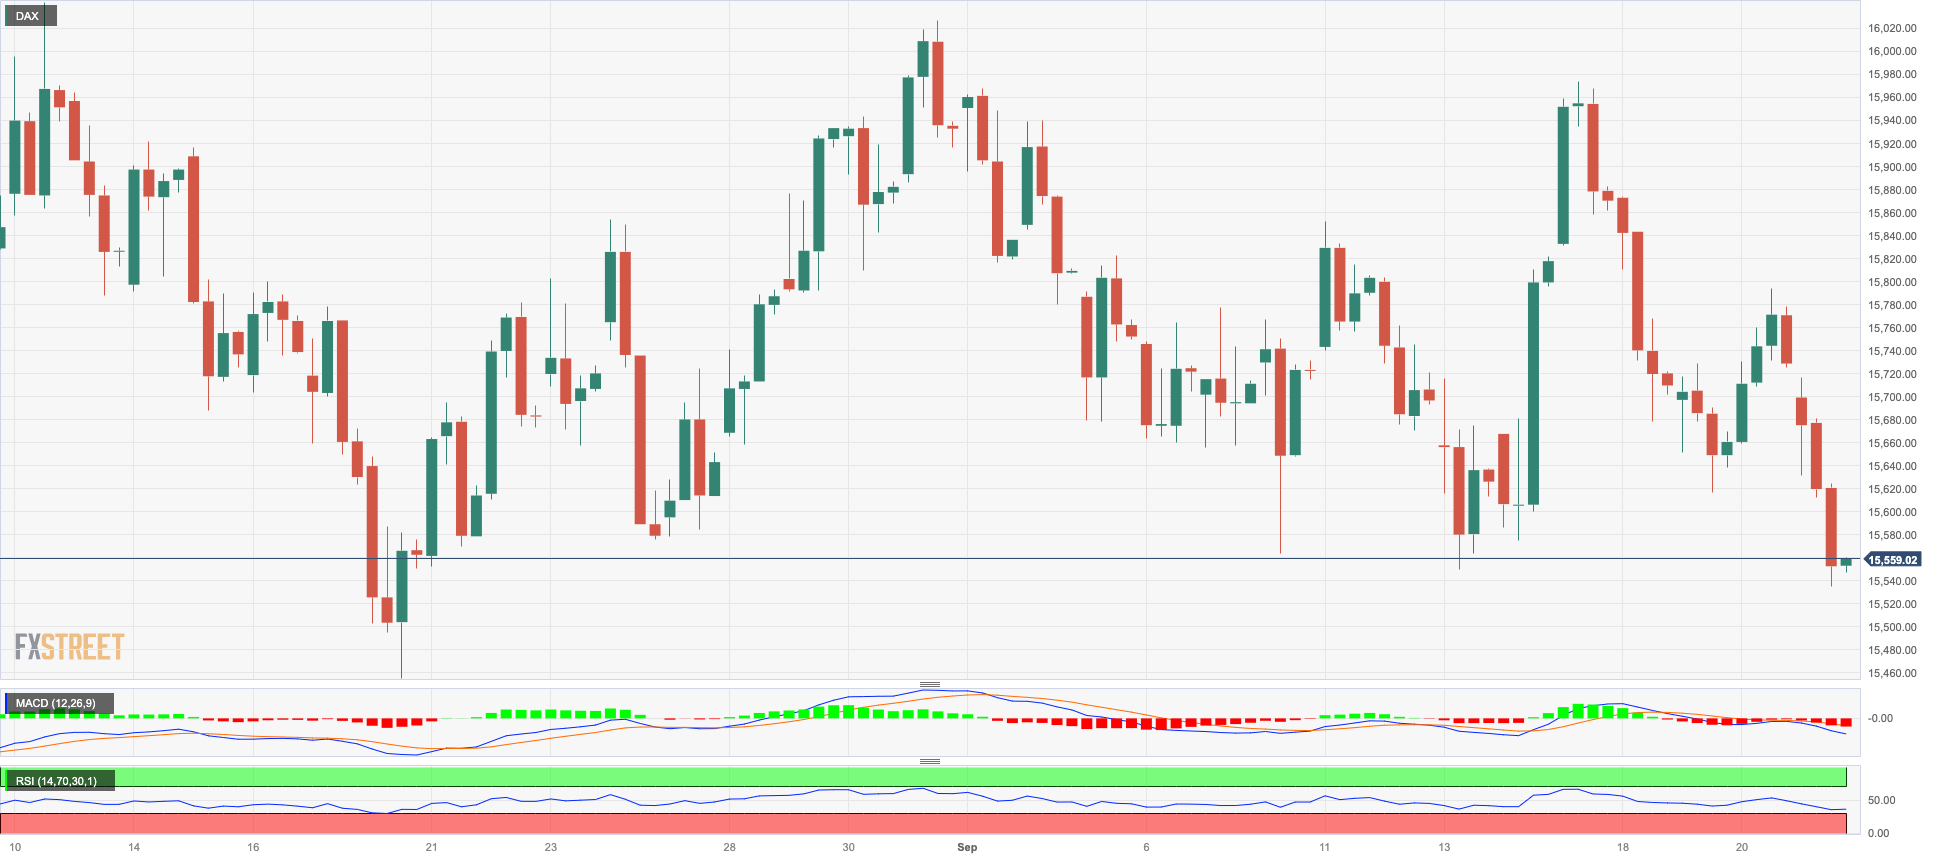
GER40
Germany’s reference DAX40 revisited the lower end of the multi-week consolidative range near 15500 on Thursday, an area also coincident with the critical 200-day SMA.
In fact, European markets closed Thursday’s session in a “sea of red” as market participants continued to digest the FOMC event and the prospects that the Fed might keep its restrictive stance for longer than previously thought.
In addition, concerns over the deterioration of the economic outlook for Germany and the euro region also contributed to the sour mood among market participants.
Furthermore, the 10-year bund yields edged higher and approached 2.78% for the first time since late July 2011.
For the time being, the DAX40 stays in a consolidative range. The revival of the negative bias might cause the DAX40 to retest the 200-day SMA at 15543, which precedes the August low of 15468 (August 18) and the July low of 15456 (July 7). A deeper downturn may test the March low of 14458 (March 20), followed by the December 2022 low of 13791 (December 20), and the lowest level in 2022 at 11862 (September 28). On the upside, the first resistance level seems to be the September high of 15989 (September 14), followed by weekly top of 16042 (August 31) and 16060 (August 10). If the price breaks above the latter level, investors' attention may be attracted to the possibility of a visit to the all-time peak of 16528 (July 31). The daily RSI retreated to the 41 zone.
Best Performers: Hannover Rueck SE, Commerzbank, Munich Re Group
Worst Performers: BASF, Sartorius AG VZO, Zalando SE
Resistance levels: 15810 15989 16042 (4H chart)
Support levels: 15548 15468 15456 (4H chart)
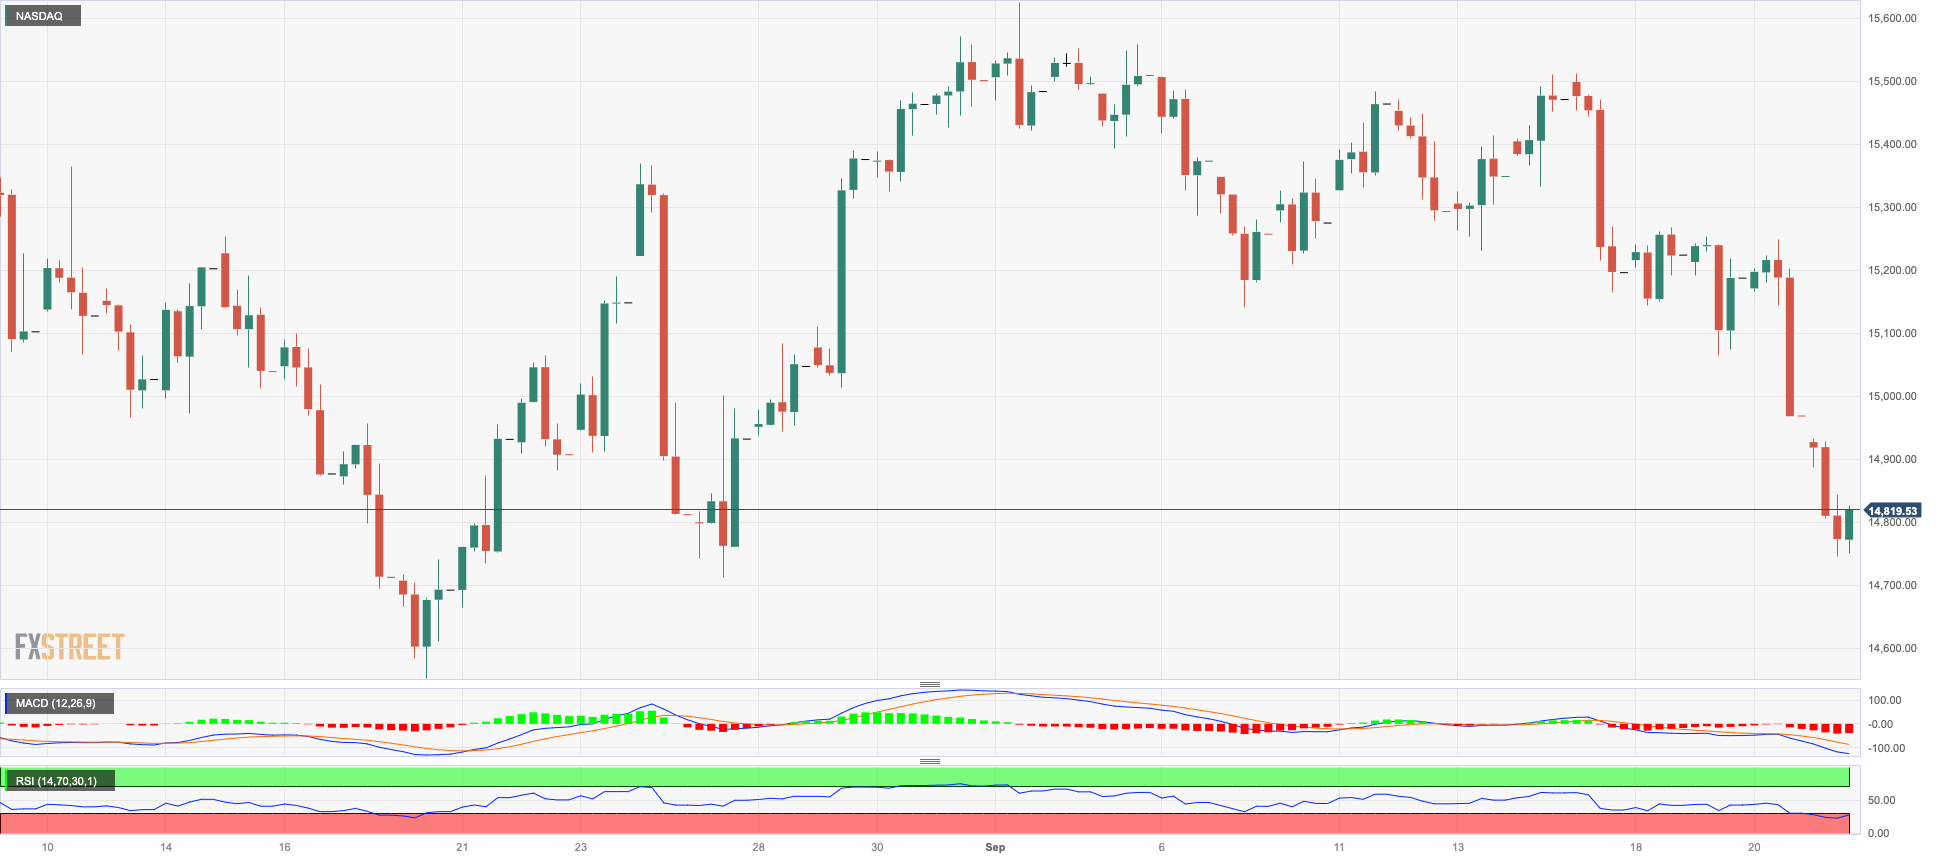
NASDAQ
The selling pressure remained unabated in the US tech sector, prompting the benchmark Nasdaq 100 to trade markedly on the defensive for the third session in a row and reach fresh four-week lows near 14700.
Higher US yields in the 10-year/30-year tranche and now firmer conviction that the Fed’s tighter-for-longer narrative would remain well in place hurt investors’ mood and kept the price action in the sector widely depressed on Thursday.
The continuation of the downside could force the Nasdaq 100 to revisit the August low of 14557 (August 18) ahead of the weekly lows of 14283 (June 7) and 13520 (May 24). Further south emerges the 200-day SMA at 13466. Having said that, the index faces temporary hurdle at the 55-day SMA at 15285 before the weekly top of 15512 (September 14) and the September high of 15618 (September 1). The breach of the latter could prompt a test of the weekly peak of 15803 (July 31) to emerge on the horizon prior to the 2023 high at 15932 (July 19) and the round 16000 mark. The day-to-day RSI dropped to the proximity of 38.
Top Gainers: Globalfoundries, Warner Bros Discovery, Enphase
Top Losers: Cisco, Atlassian Corp Plc, Dollar Tree
Resistance levels: 15512 15618 15803 (4H chart)
Support levels: 14751 14557 14283 (4H chart)
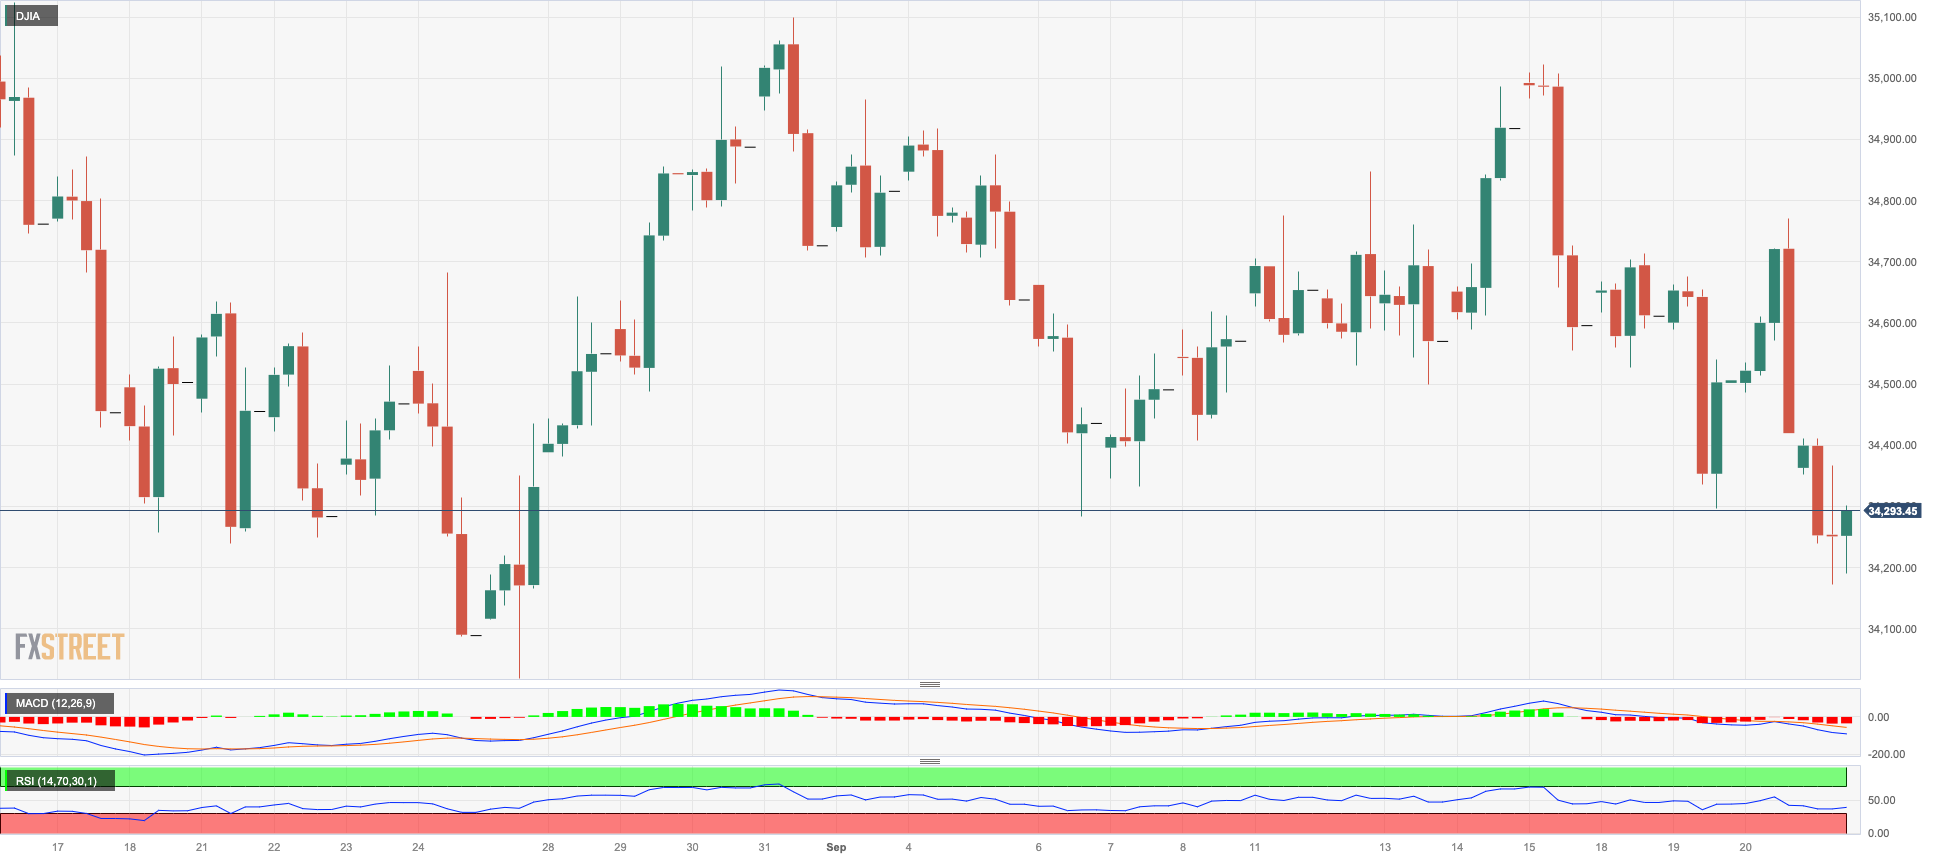
DOW JONES
The US stock reference Dow Jones dropped to new four-week lows around the 34200 region on Thursday, retreating at the same time for the third consecutive session.
Wednesday’s hawkish hold by the Federal Reserve and speculation that the restrictive stance might extend further than initially anticipated weighed on investor sentiment and were exclusive to the negative performance of US equities on Thursday.
All in all, the Dow Jones dropped 0.43% to 34292, the S&P500 deflated 0.90% to 4362, and the tech-benchmark Nasdaq Composite retreated 1.02% to 13332.
In case of further losses, Dow Jones could put the August low of 34029 (25 August) to the test ahead of the 200-day SMA at 33809. Further south from this point, we would encounter the July low at 33705 (July 10), ahead of the May low at 32586 (May 25) and the 2023 low at 31429 (March 15). Just the opposite, the September high at 34977 (September 14) emerges as the immediate up-barrier prior to the weekly top at 35070 (August 31) and the 2023 peak at 35679 (August 1). The surpass of the latter could expose the 2022 high at 35824 (February 9) prior to the all-time top at 36952 (January 5, 2022). The everyday RSI deflated to the 41 zone.
Top Performers: UnitedHealth, Intel, Walt Disney
Worst Performers: Cisco, Visa A, Nike
Resistance levels: 34977 35070 35578 (4H chart)
Support levels: 34186 34029 33705 (4H chart)
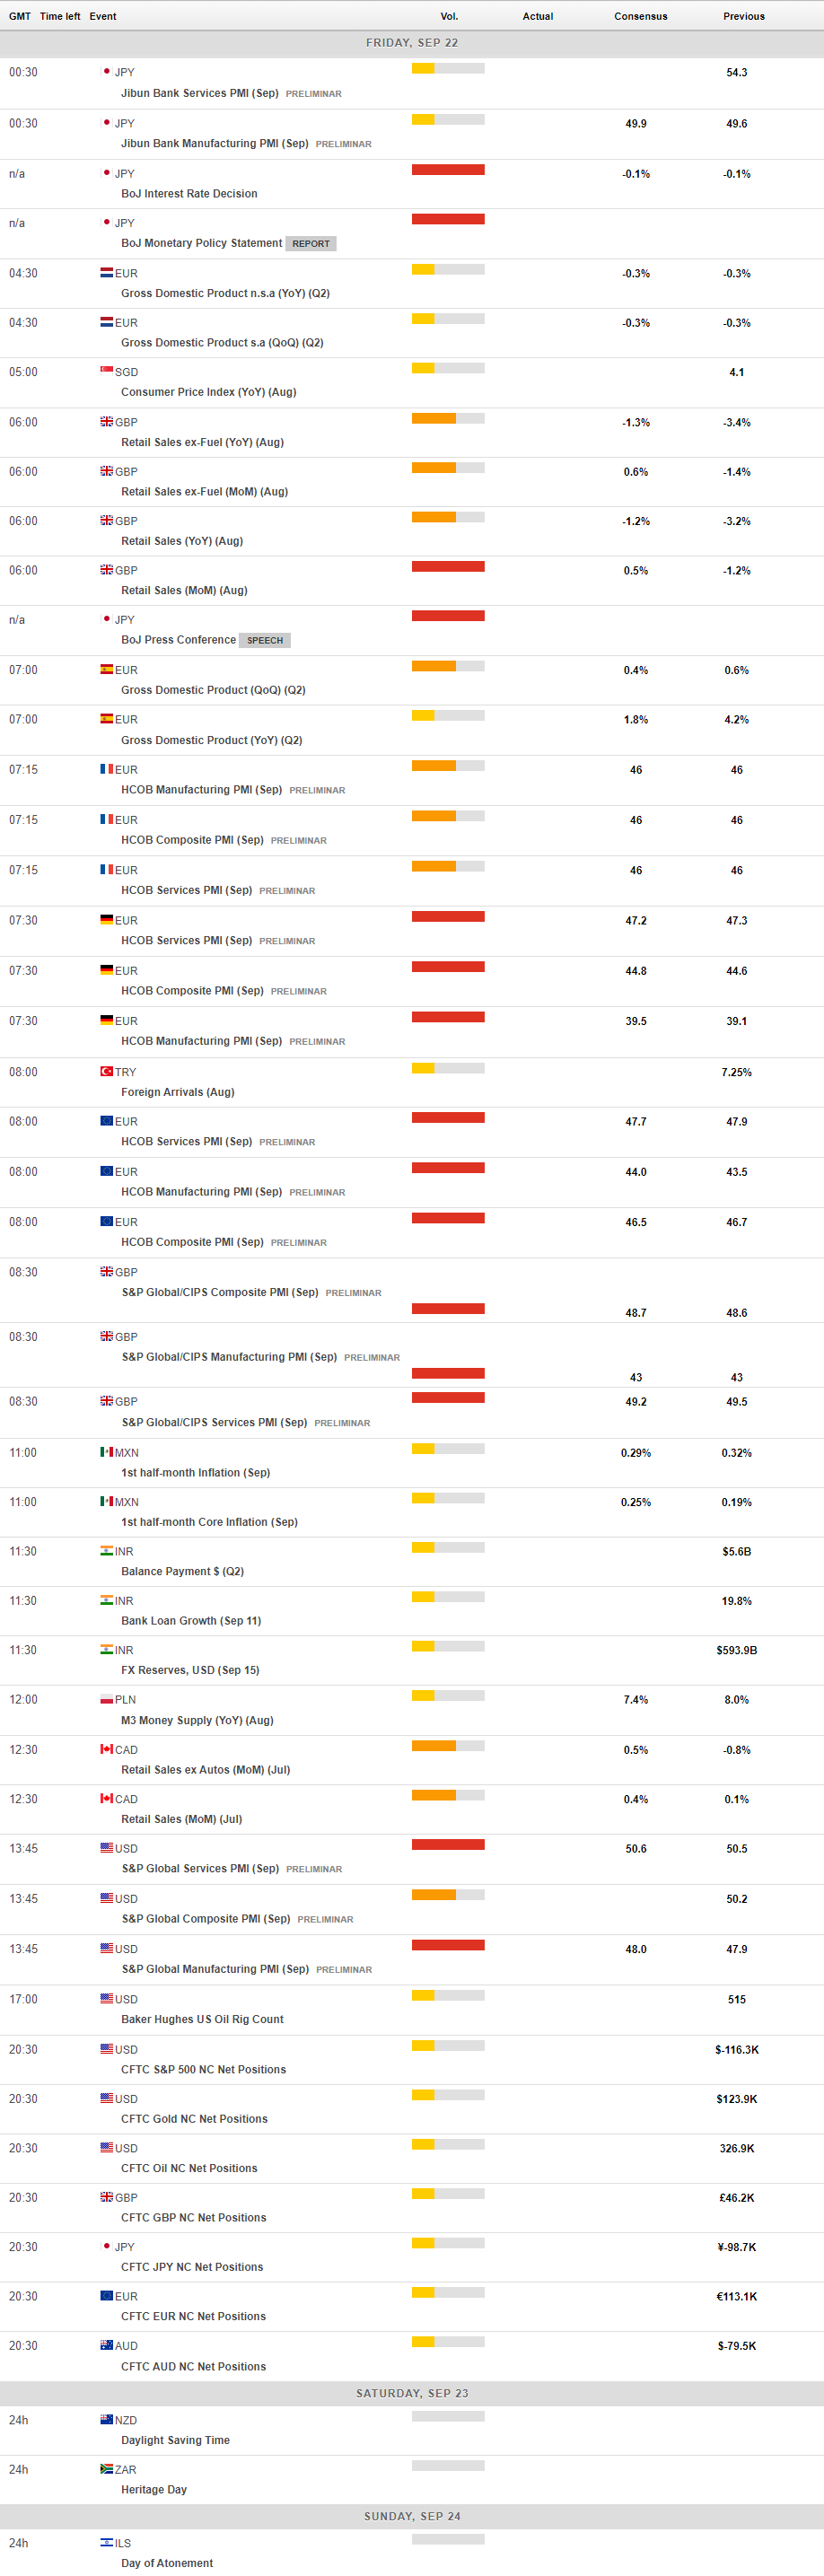
MACROECONOMIC EVENTS
All Information & Updates provided by:

All information relating to the financial markets available on this page has been prepared and issued by FXStreet (Forexstreet SL, Spain, Reg: B62498233) on the basis of publicly available information and all information believed to be reliable and does not conflict with Kuwaiti local laws, and all necessary care has been taken to before the company to ensure that the facts mentioned are correct from the source.
NCM Investment nor any of its directors or employees shall in any way be held responsible for the contents of this news, and the information contained on this page is intended only to provide clients with publicly available information and should not be construed as investment advice, report or analysis and/or constitute an offer or invitation to buy or sell financial instruments of any kind.
RISK WARNING: Forex and CFDs are highly risky leveraged products, as losses can exceed deposits. Please ensure you understand all the risks and take independent advice if necessary. NCM will segregate the clients based on the criteria of the regulator and its bylaws. NCM does not provide any advisory service; the material published does not constitute advice or a recommendation for a transaction in any financial instrument. NCM accepts no responsibility for any use of the content presented and any consequences of that use. Anyone acting on the information provided does so at their own risk.