
- Contact Us:
-

-

-

-


Daily Market Updates
25 Sep 2023
USDJPY
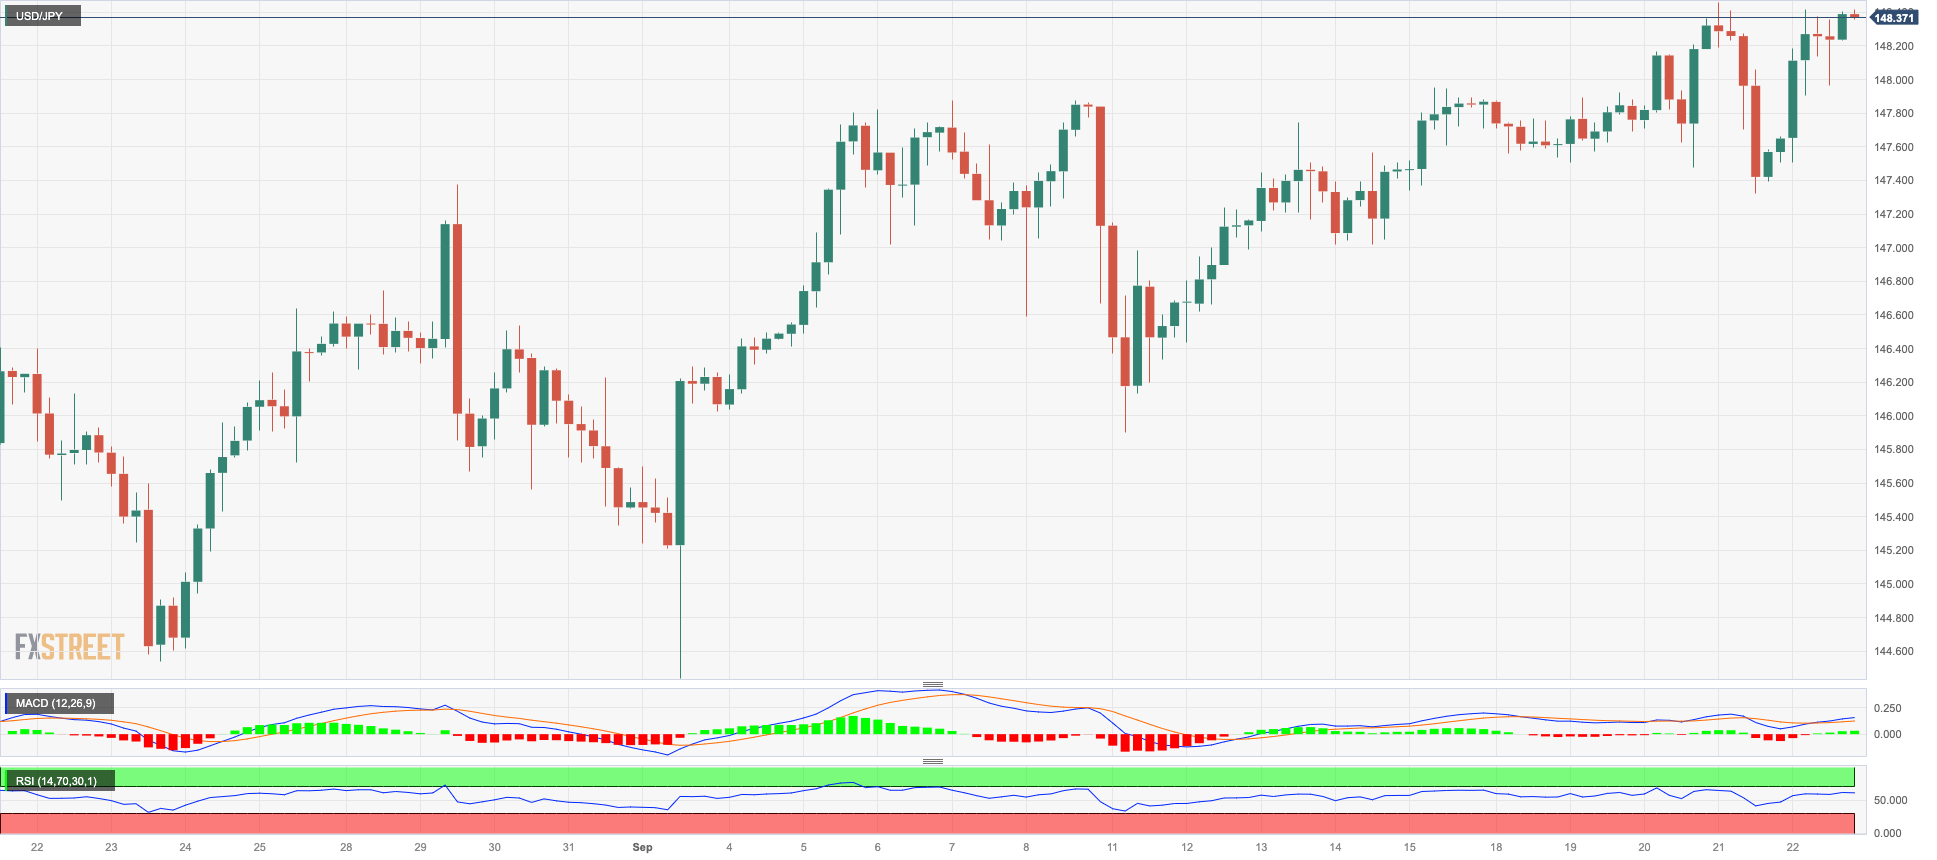
USD/JPY resumed its weekly upside and closed well north of 148.00 the figure, and at shouting distance from Thursday’s yearly peaks near 148.50.
The dovish hold from the BoJ at its gathering during early trade seems to have underpinned the selling pressure around the Japanese yen. In addition, the continuation of the upside momentum in the greenback also contributed to the daily gains in the pair despite US and Japanese yields having retreated from recent peaks.
More from the BoJ saw Governor K. Ueda argue that the risks of falling below the 2% inflation target were higher than those of surpassing it, and he observed that inflation appeared to be on a continued downward trajectory from its current levels. It is worth recalling that the BoJ left the YCC programme and its accommodative outlook unchanged, showing no rush to announce an exit to the ultra-easing monetary policy stance.
In the Japanese calendar, the Inflation Rate rose 3.2% in the year to August, the Core Inflation Rate gained 3.1% YoY and the Inflation Rate Ex-Food and Energy increased 4.3% from a year earlier. Additionally, Foreign Bond Investment rose by ¥885.5B in the week to September 16 and advanced figures saw the Jibun Bank Manufacturing PMI and 48.6 and the Services PMI at 53.3 for the current month.
If USD/JPY rises above the 2023 high of 148.46 (September 21), it could test the 2022 top of 151.95 (October 21). On the downside, minor support is at the weekly low of 145.89 (September 11), ahead of the interim 55-day SMA at 144.22. South of here, the August low of 141.50 (August 7) shows up, followed by the weekly low of 138.05 (July 28) and the 200-day SMA at 137.61. A deeper pullback could put the weekly low of 133.01 (April 26) in danger, as well as the lower levels of 132.01 (April 13) and 130.62 (April 5). The RSI rose to the proximity of 62.
Resistance levels: 148.46 148.84 149.45 (4H chart)
Support levels: 147.32 147.01 145.89 (4H chart)
GBPUSD
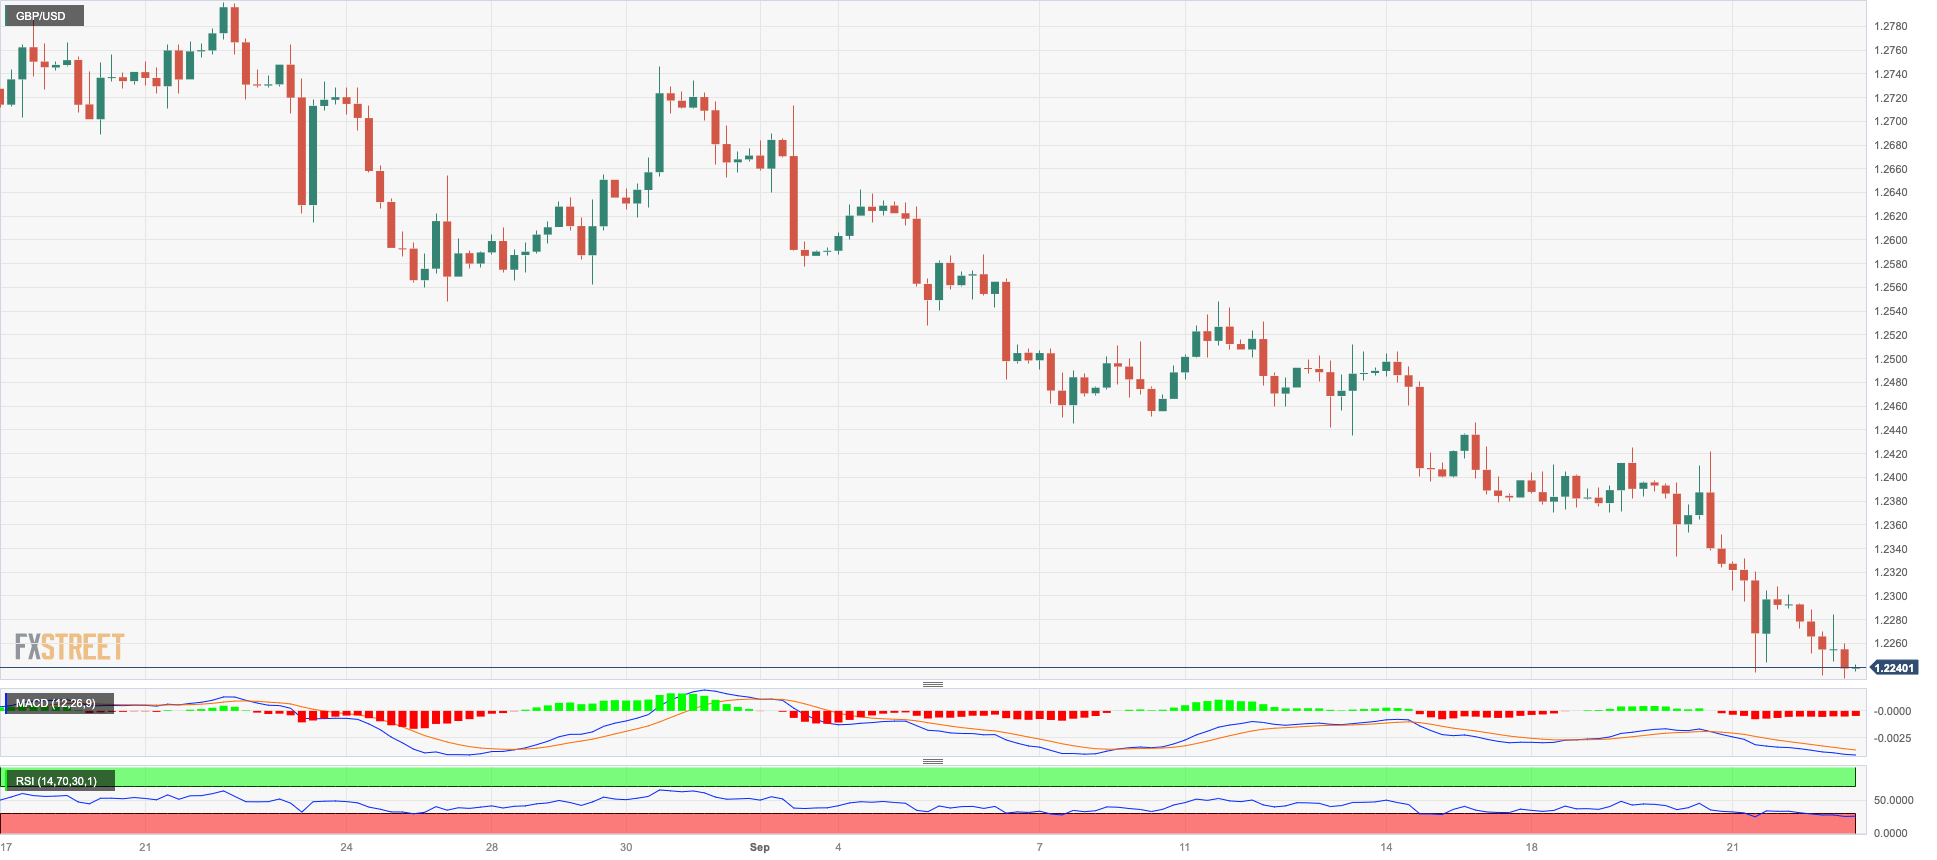
Another firm session of the greenback sent GBP/USD to the area of multi-month lows near 1.2230 at the end of the week, prompting the British pound to retreat for the third straight week.
Indeed, it was a dreadful week for the sterling, as the relentless upside bias in the greenback in combination with the dovish hold by the BoE at its meeting on Thursday weighed on investors and drastically reduced bets on further tightening by the “Old Lady”.
On the latter, the probability of another hold by the BoE at the November 2 event hovers around 75%.
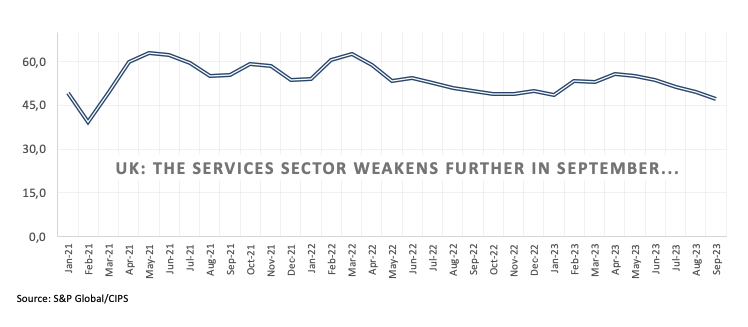
Back to the UK docket, the preliminary S&P Global/CIPS Manufacturing PMI is seen improving to 44.2 in September, and the Services PMI is expected to have weakened to 47.2. Further releases saw the Consumer Confidence tracked by Gfk improve to -21 in September, while headline Retail Sales and sales excluding Fuel contracted at an annualized 1.4% in August.
If GBP/USD breaches the September low of 1.2230 (September 22), it may return to the crucial round milestone of 1.2000 before the 2023 bottom of 1.1802 (March 8). Instead, the 200-day SMA at 1.2432 is the first upward obstacle followed by the weekly high at 1.2548 (September 11). The provisional 100-day and 55-day SMAs are at 1.2641 and 1.2694, respectively, before weekly peaks at 1.2746 (August 30), 1.2818 (August 10), and 1.2995 (July 27), all ahead of the psychological milestone of 1.3000. On the daily chart, the RSI dropped further into oversold zone, approaching the 23 region.
Resistance levels: 1.2421 1.2548 1.2613 (4H chart)
Support levels: 1.2230 1.2189 1.2178 (4H chart)
AUDUSD
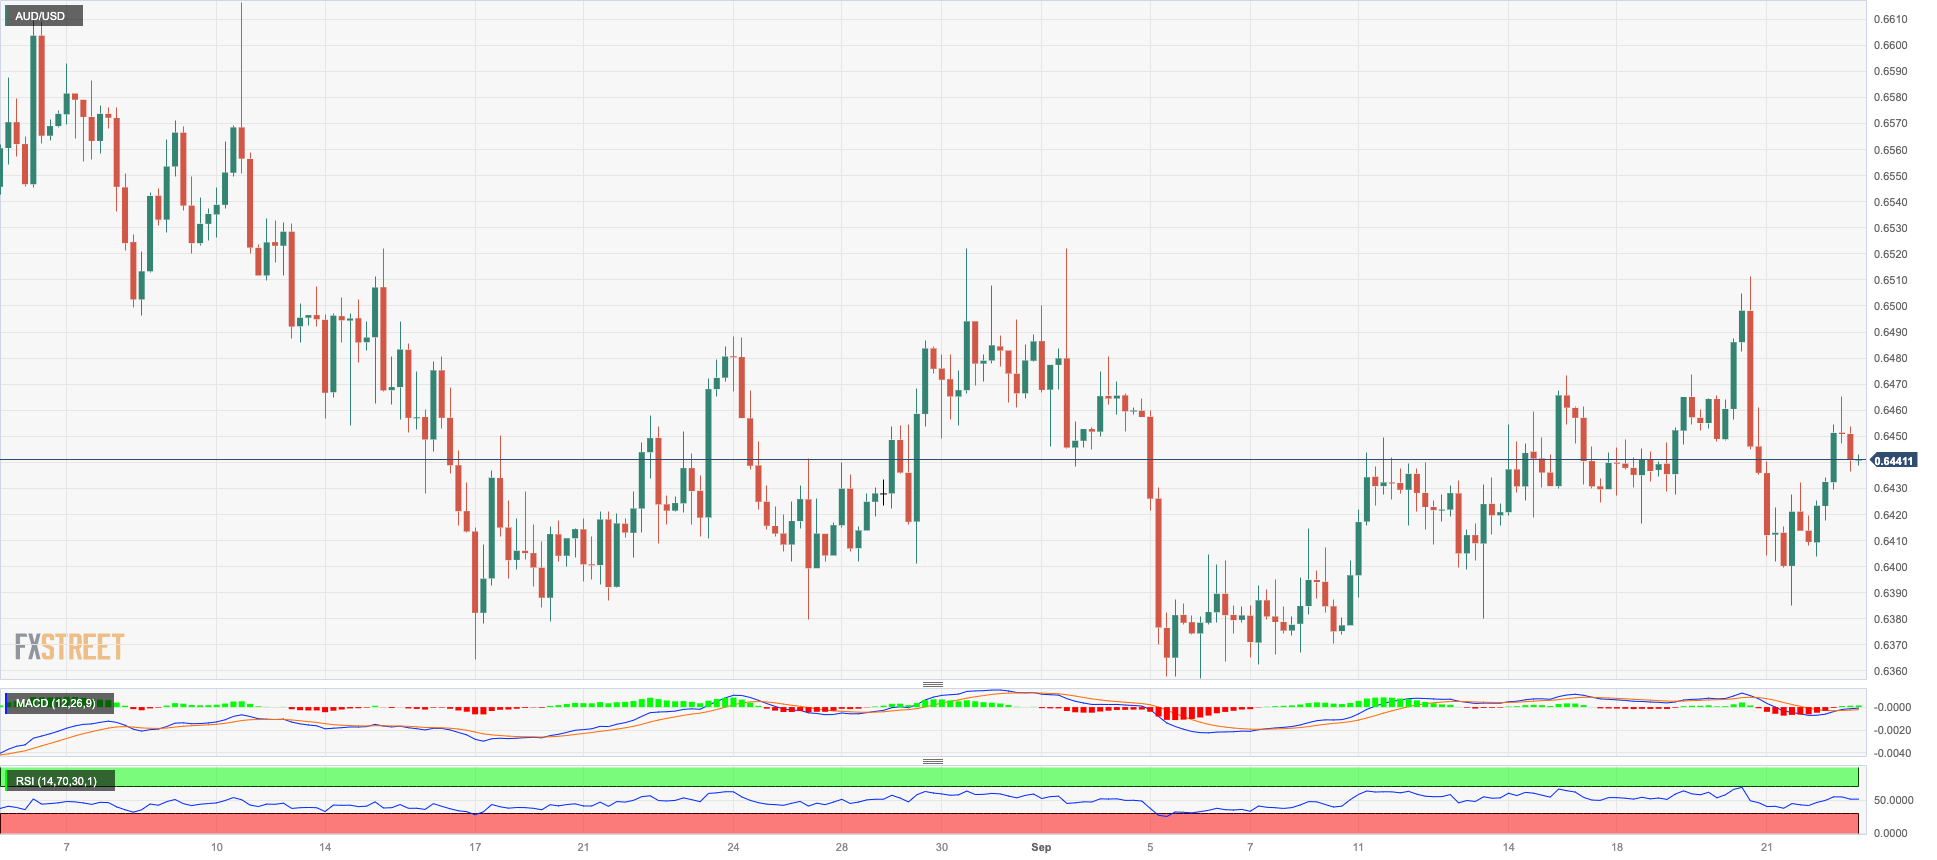
AUD/USD reversed two consecutive daily declines and ended the week on a firm note, well past the 0.6400 hurdle. On a weekly basis, it was the second straight advance for the Aussie dollar.
The move higher in spot came in contrast with the prevailing risk-off tone, the mixed performance of the commodity complex, and the firmer tone in the greenback, although auspicious prints from advanced PMIs and expectations of some recovery in China appear to have been enough to spark some buying feeling around AUD in the second half of the week.
In Oz, flash readings showed the Judo Bank Manufacturing PMI at 48.2 and the Services PMI at 50.5.
The 2023 bottom at 0.6357 (September 5) is directly below for AUD/USD, seconded by the November 2022 low at 0.6272 (November 7) and the 2022 low at 0.6179 (October 13). On the contrary, the immediate upside resistance might be located at the weekly high of 0.6522 (August 30), ahead of another weekly top of 0.6616 (August 10) and the 200-day SMA of 0.6695. Further increases might bring the pair back to the July peak of 0.6894 (July 14), just ahead of the June high of 0.6899 (June 16) and the key threshold of 0.7000. Both the weekly high of 0.7029 (February 14) and the 2023 top of 0.7157 (February 2) are north of here. The RSI on the daily chart rose to the vicinity of 48.
Resistance levels: 0.6465 0.6511 0.6521 (4H chart)
Support levels: 0.6385 0.6357 0.6272 (4H chart)
GOLD
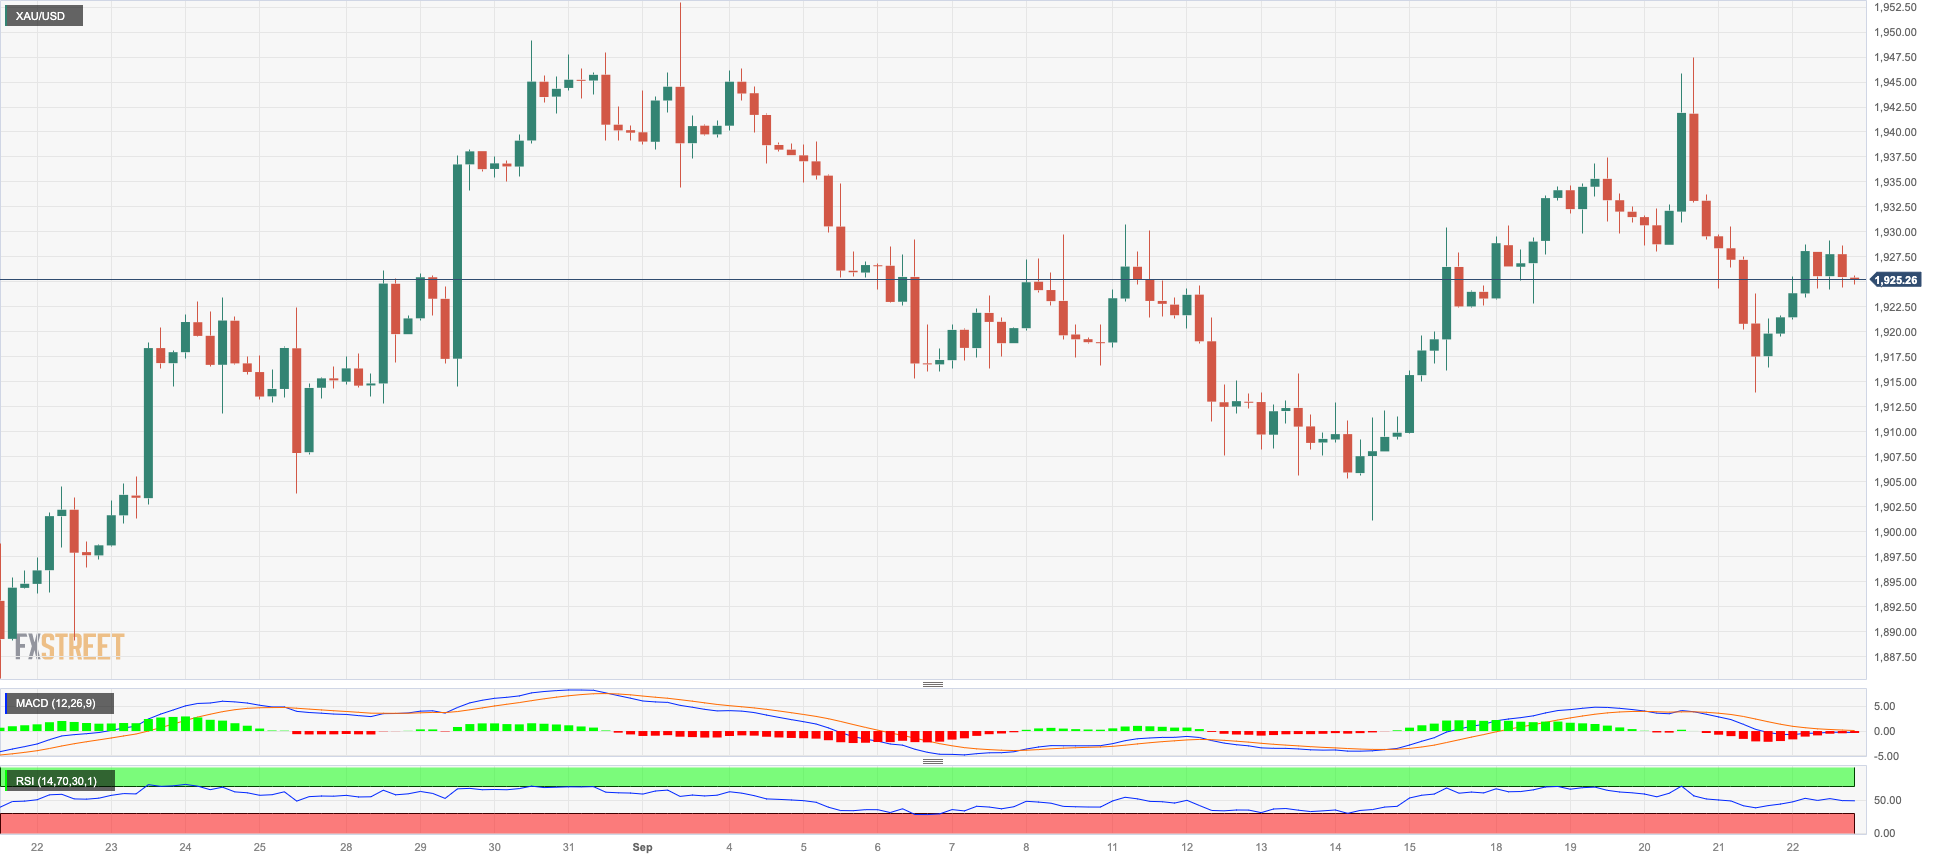
After three consecutive daily drops, gold prices managed to stage a decent comeback and regained the $1930 region per troy ounce, an area also coincident with the provisional 55-day SMA.
The uptick in the precious metal came against the backdrop of further strength in the greenback, although it appears to have derived fresh legs from the broad-based decline in US yields across different maturities.
Moving forward, bullion is expected to remain under scrutiny amidst the renewed tighter-for-longer narrative around the Federal Reserve, including the palpable probability of another 25 bps rate hike before year-end.
A further rise in the gold price now targets the weekly top of $1947 (September 20) prior to the September high of $1953 (September 1). If the metal breaks above this zone it could take us to the July peak of $1987 (July 20), just below the psychological $2000 mark. North from here emerges the 2023 top at $2067 (May 4), followed by the 2022 peak at $2070 (March 8) and the all-time high of $2075 (7 August 2020). On the downside, immediate support is at the September low of $1901 (September 14), just before the key conflict zone at $1900 and the August low of $1885 (17 August). The loss of the latter exposes the 2023 low of $1804 (February 28), ahead of the critical contention area at $1800.
Resistance levels: $1947 $1953 $1987 (4H chart)
Support levels: $1913 $1901 $1884 (4H chart)
CRUDE WTI
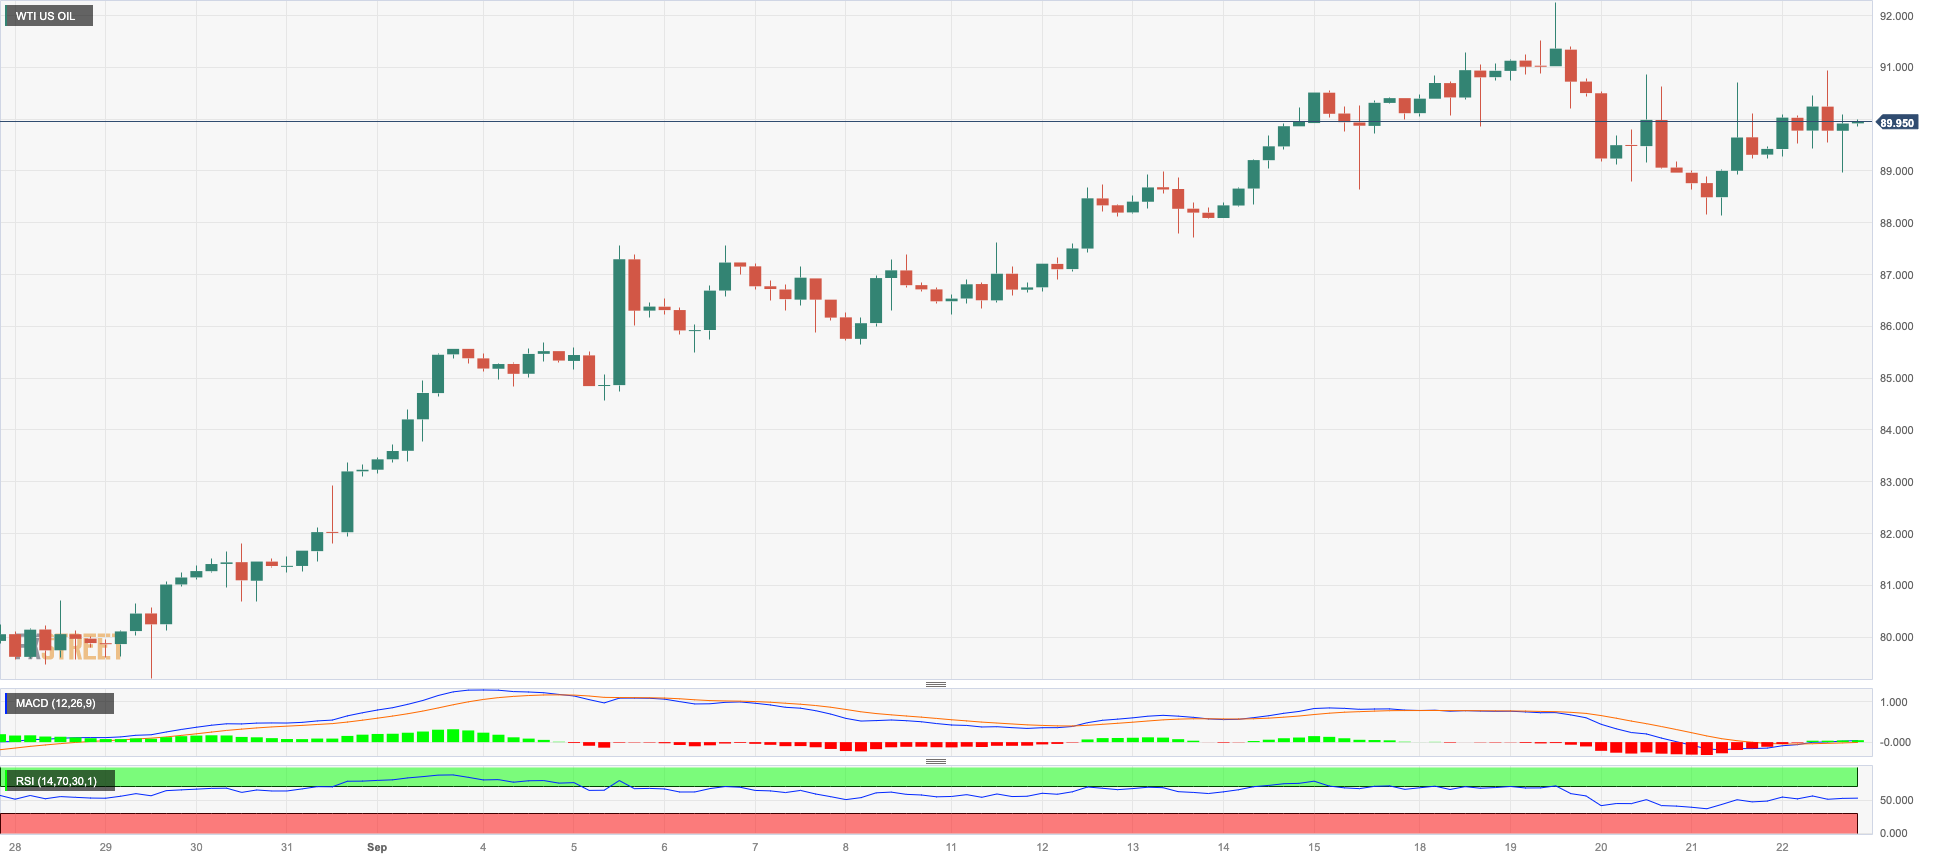
Prices of WTI advanced for the second day in a row on Friday, although the commodity could not help closing the first week in negative territory after three consecutive gains.
The combination of some profit-taking, the Russian ban on diesel and gasoline exports, the rally in the greenback, the weekly drop in US inventories, and the omnipresent tight supply narrative were behind the commodity’s price action in the past few days.
In addition, the expected tighter-for-longer stance from the Fed could re-emerge as a source of weakness for the commodity in the next few weeks, although a “hard landing” of the US economy seems to be off the table for the time being.
Closing the weekly calendar, the total US active oil rig count went down by 8 to 507 in the week to September 22, according to the usual report by driller Baker Hughes.
Given the current trend in the WTI price, the 2023 high at $92.63 (September 19) appears to be the immediate obstacle to the uptrend, followed by the November 2022 top at $93.73 (November 7) and the weekly high at $97.65 (August 30, 2022). A surpass of the latter could bring back into focus a possible visit to the psychological $100.00 mark per barre. In contrast, the weekly low of $88.42 (September 21) emerges as the immediate contention prior to the transitory 55-day SMA at $82.19. Down from here aligns the August low at $77.64 (August 24) and the important 200-day SMA at $76.92. If this zone is breached, weekly lows at $73.89 (July 17) and $66.86 (June 12) become visible, both ahead of the 2023 low at $63.61 (May 4). Further south, the December 2021 low is at $62.46 (December 2) before reaching the important $60.00 level.
Resistance levels: $92.63 $93.73 $97.65 (4H chart)
Support levels: $88.34 $86.12 $84.99 (4H chart)
GER40
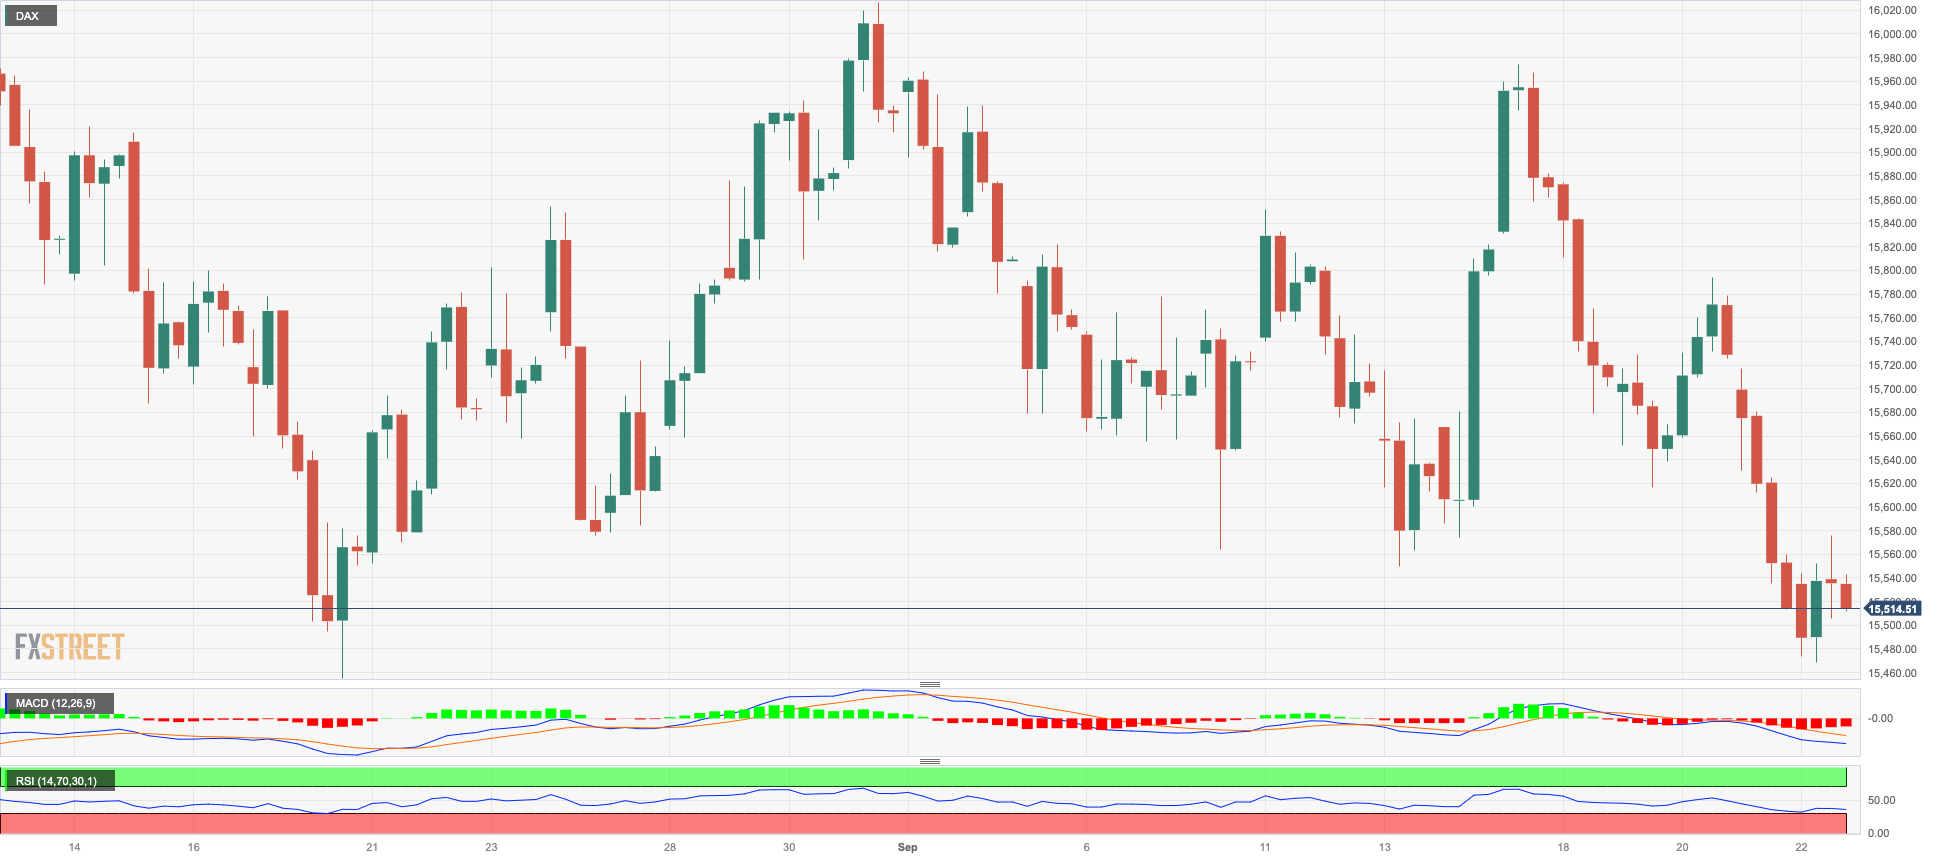
German equities measured by the key DAX40 added to Thursday’s losses and revisited the area below 15500 at the end of the week, flirting at the same time with multi-month lows.
Indeed, losses in the German reference accelerated at the end of the week, as investors’ perception that the Fed might extend its restrictive stance for longer than anticipated played against any recovery attempt.
Adding to the broad-based sour sentiment, poor advanced Manufacturing and Services PMIs in the core euro area (France, Germany, and the euro zone) added to the rising recession and stagflation fears among market participants.
In the meantime, Germany’s 10-year bund yields followed their US peers and receded modestly from recent peaks near 2.80%.
The DAX40 seems to have broken below the multi-week consolidating range. The resurgence of the negative bias could lead the index to retest the March low of 14458 (March 20), followed by the December 2022 low of 13791 (December 20) and the 2022 low of 11862 (September 28). On the upside, the first resistance seems to be the September high of 15989 (September 14), followed by the weekly tops of 16042 (August 31) and 16060 (August 10). If price breaks above the latter level, investors' attention could be drawn to the possibility of a visit to the all-time peak of 16528 (July 31). The day-to-day RSI dropped below 41.
Best Performers: Siemens Healthineers, Volkswagen VZO, Allianz
Worst Performers: Commerzbank, Brenntag AG, Zalando SE
Resistance levels: 15810 15989 16042 (4H chart)
Support levels: 15471 14809 14458 (4H chart)
NASDAQ
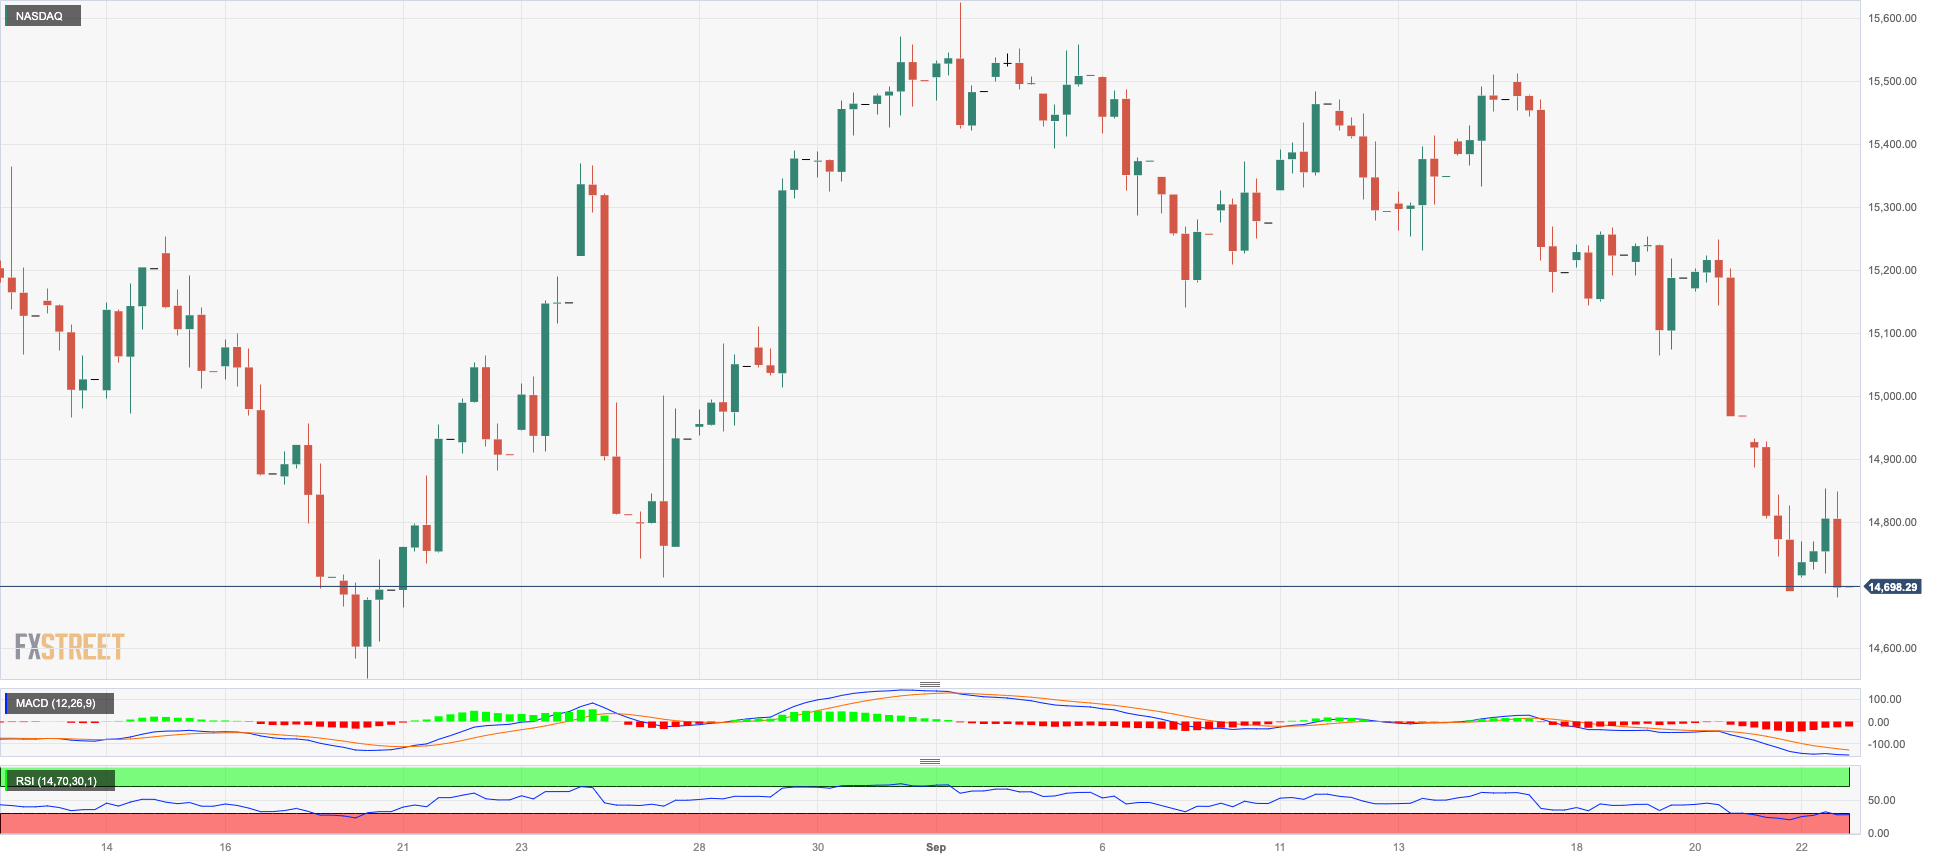
The tech blue-chip Nasdaq 100 was the sole exception among US markets on Friday, as it managed to close with marginal gains around the 14700 level.
This marginal uptick, however, did not prevent the index from closing its third week in a row with losses and flirting with the area of two-month lows.
Declining US yields across the curve and renewed optimism surrounding iPhone maker Apple seem to have been enough to keep tech equities afloat at the end of the week, in the context of a stronger dollar and reignited concerns over extra tightening by the Federal Reserve in the next few months.
The Nasdaq 100 might be forced to revisit the August low of 14557 (August 18), ahead of the weekly lows of 14283 (June 7) and 13520 (May 24) in case the selling pressure accelerate. The loss of the late could open the door to a test of the key 200-day SMA at 13480. Having said that, the index confronts a short stumbling block at the 55-day SMA of 15276 before the weekly high of 15512 (September 14) and the September top of 15618 (September 1). If the latter is surpassed, a challenge of the weekly peak of 15803 (July 31) might be on the horizon before the 2023 high of 15932 (July 19) and the round 16000 level. The everyday RSI remained steady around 36.
Top Gainers: PDD Holdings DRC, Seagen, ON Semiconductor
Top Losers: Tesla, Enphase, Warner Bros Discovery
Resistance levels: 15512 15618 15803 (4H chart)
Support levels: 14686 14557 14283 (4H chart)
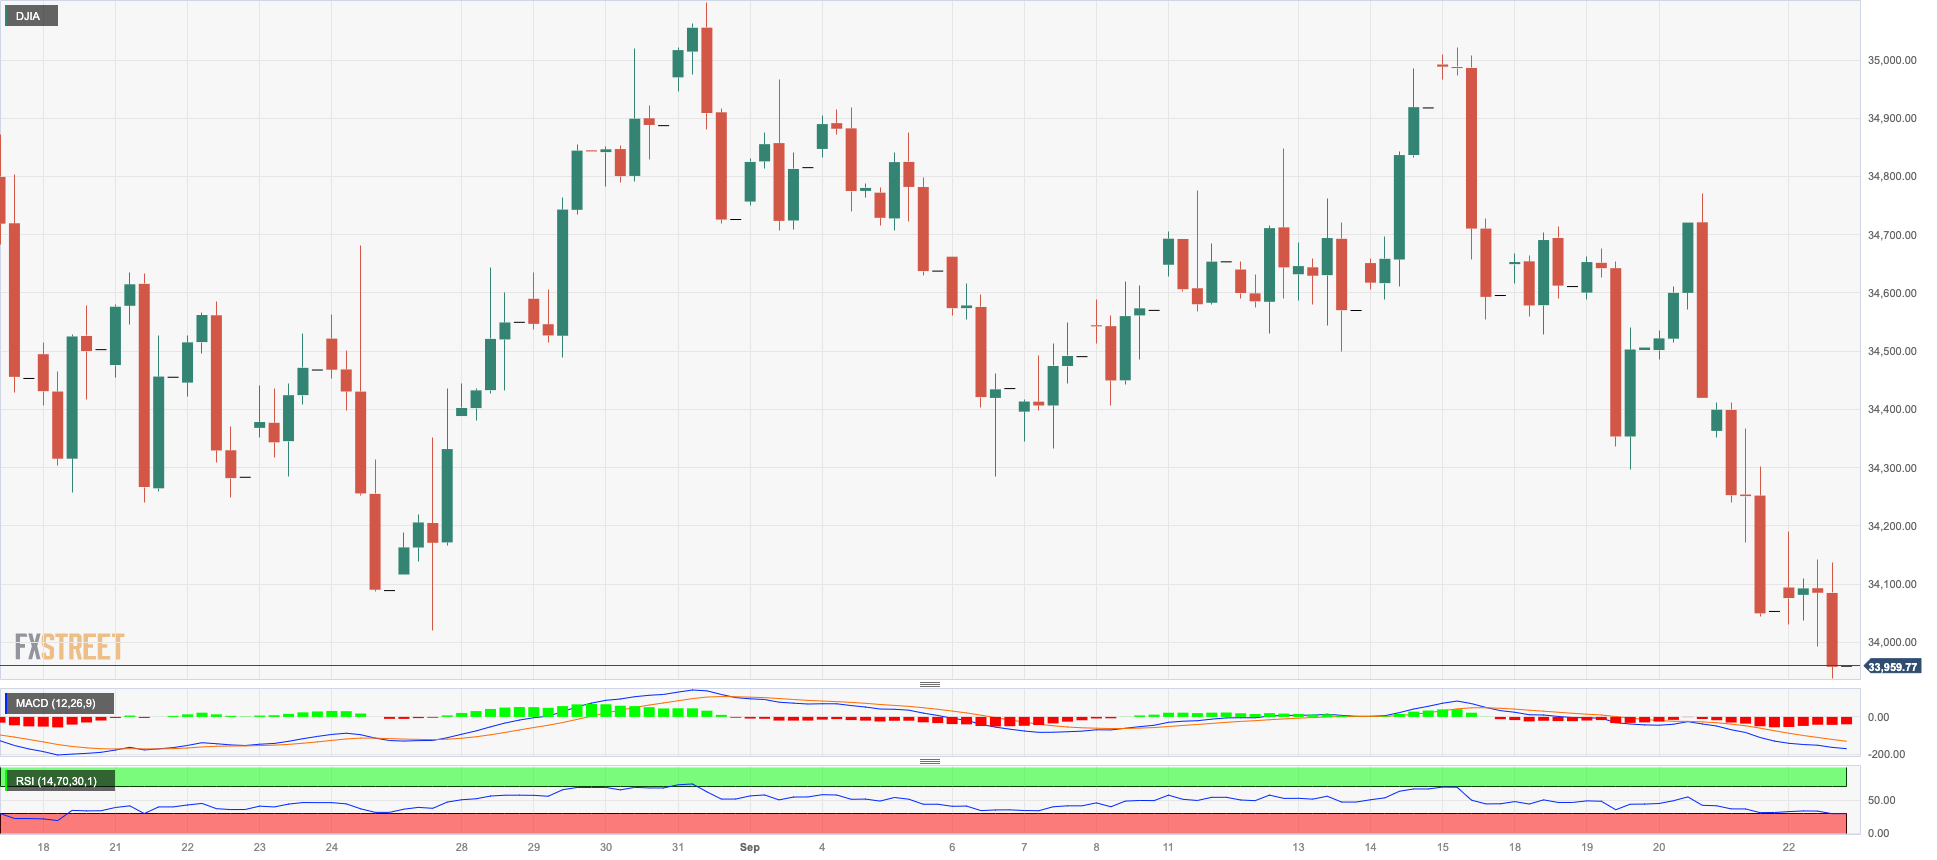
DOW JONES
The selling pressure around US stocks remained well and sound for yet another session on Friday, this time relegating the benchmark Dow Jones to new two-month lows in the sub-34000 zone.
In fact, hawkish comments from the Fed’s rate setters confirmed the resumption of the tighter-for-longer stance from the Federal Reserve, while investors started to price in another quarter-point rate raise before the end of the year, all weighing on investors’ sentiment and sponsoring the fourth consecutive daily retracement in the index.
All in all, the Dow Jones retreated 0.31% to 33976, the S&P500 dropped 0.23% to 4320, and the tech-heavy Nasdaq Composite receded 0.09% to 13211.
In the event of additional losses, Dow Jones might target the key 200-day SMA at 33808. Further south from here, the index could hit the July low of 33705 (July 10), seconded by the May low of 32586 (May 25) and the 2023 low of 31429 (March 15). On the opposite direction, the September high of 34977 (September 14) appears to be the immediate up-barrier ahead of the weekly top of 35070 (August 31) and the 2023 peak of 35679 (August 1). The latter's breach might expose the 2022 high at 35824 (February 9) before the all-time top at 36952 (January 5, 2022). The daily RSI fell to the vicinity of 35.
Top Performers: UnitedHealth, Chevron, Apple
Worst Performers: Walt Disney, Walgreen Boots, Dow
Resistance levels: 34977 35070 35578 (4H chart)
Support levels: 33947 33705 33610 (4H chart)
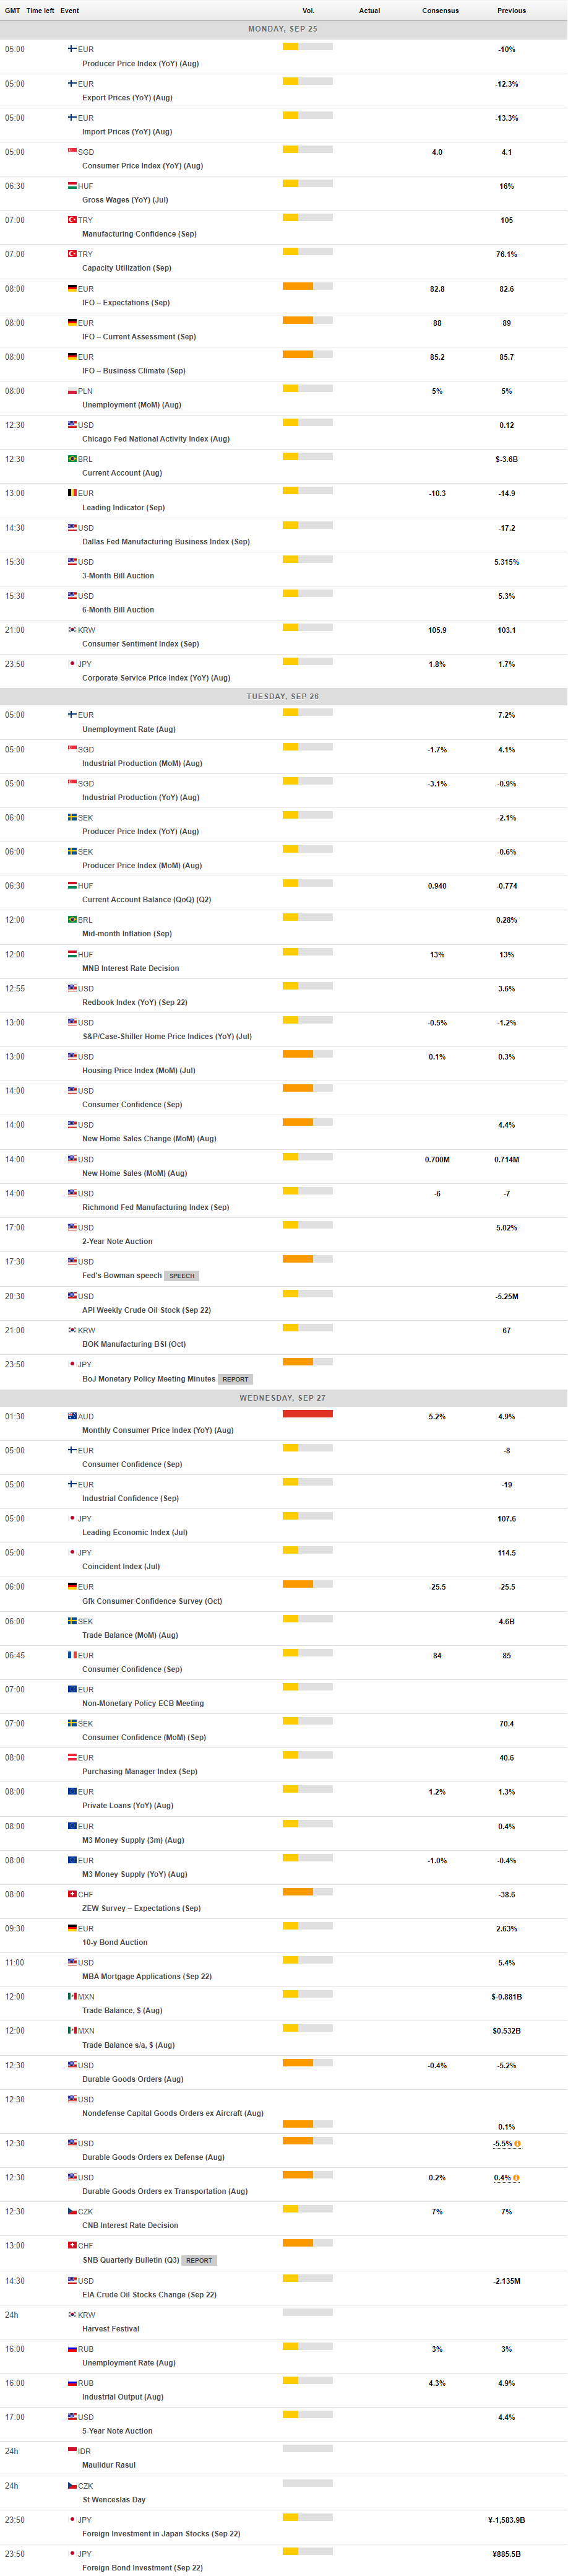
MACROECONOMIC EVENTS
All Information & Updates provided by:

All information relating to the financial markets available on this page has been prepared and issued by FXStreet (Forexstreet SL, Spain, Reg: B62498233) on the basis of publicly available information and all information believed to be reliable and does not conflict with Kuwaiti local laws, and all necessary care has been taken to before the company to ensure that the facts mentioned are correct from the source.
NCM Investment nor any of its directors or employees shall in any way be held responsible for the contents of this news, and the information contained on this page is intended only to provide clients with publicly available information and should not be construed as investment advice, report or analysis and/or constitute an offer or invitation to buy or sell financial instruments of any kind.
RISK WARNING: Forex and CFDs are highly risky leveraged products, as losses can exceed deposits. Please ensure you understand all the risks and take independent advice if necessary. NCM will segregate the clients based on the criteria of the regulator and its bylaws. NCM does not provide any advisory service; the material published does not constitute advice or a recommendation for a transaction in any financial instrument. NCM accepts no responsibility for any use of the content presented and any consequences of that use. Anyone acting on the information provided does so at their own risk.