
- Contact Us:
-

-

-

-


Daily Market Updates
26 Sep 2023
USDJPY
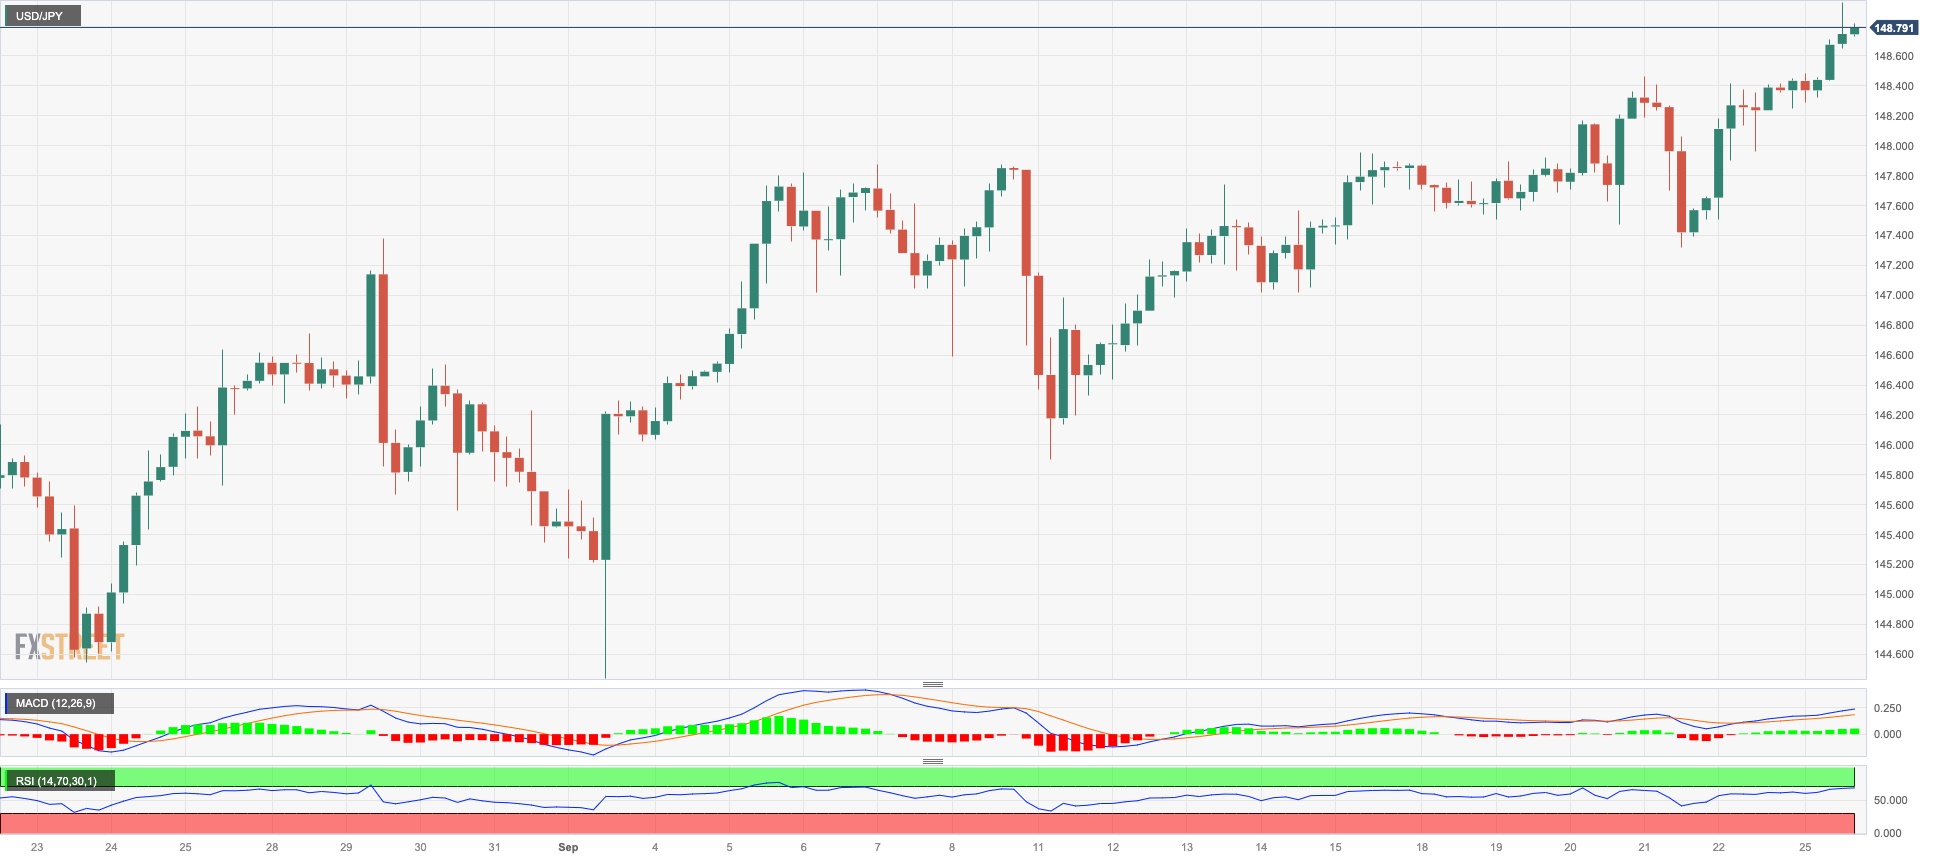
USD/JPY added to Friday’s uptick and reached new highs in levels just shy of the 149.00 hurdle on Monday, an area last visited in late October 2022.
The solid performance of the pair came on the back of further strength in the greenback associated with the sharp move higher in US yields across different maturities.
Also collaborating with the dovish stance in the Japanese yen, market participants continue to perceive that there is still quite a long way to any change to the BoJ’s ultra-accommodative stance, as per comments from BoJ officials after the central bank left its monetary conditions unchanged at its event last week.
There were no data releases scheduled in the Japanese calendar on Monday.
If USD/JPY rises above the 2023 high at 148.96 (September 25), it could test the 2022 top at 151.95 (October 21). On the downside, minor support is at the weekly low of 145.89 (September 11), ahead of the 55-day interim SMA at 144.36. South of here aligns the August low of 141.50 (August 7), prior to the weekly low of 138.05 (July 28) and the 200-day SMA at 137.67. A deeper pullback could put the weekly low of 133.01 (April 26) in danger, as well as the lower levels of 132.01 (April 13) and 130.62 (April 5). The RSI climbed to the 65 region.
Resistance levels: 148.96 149.45 151.95 (4H chart)
Support levels: 147.32 146.48 145.89 (4H chart)
GBPUSD
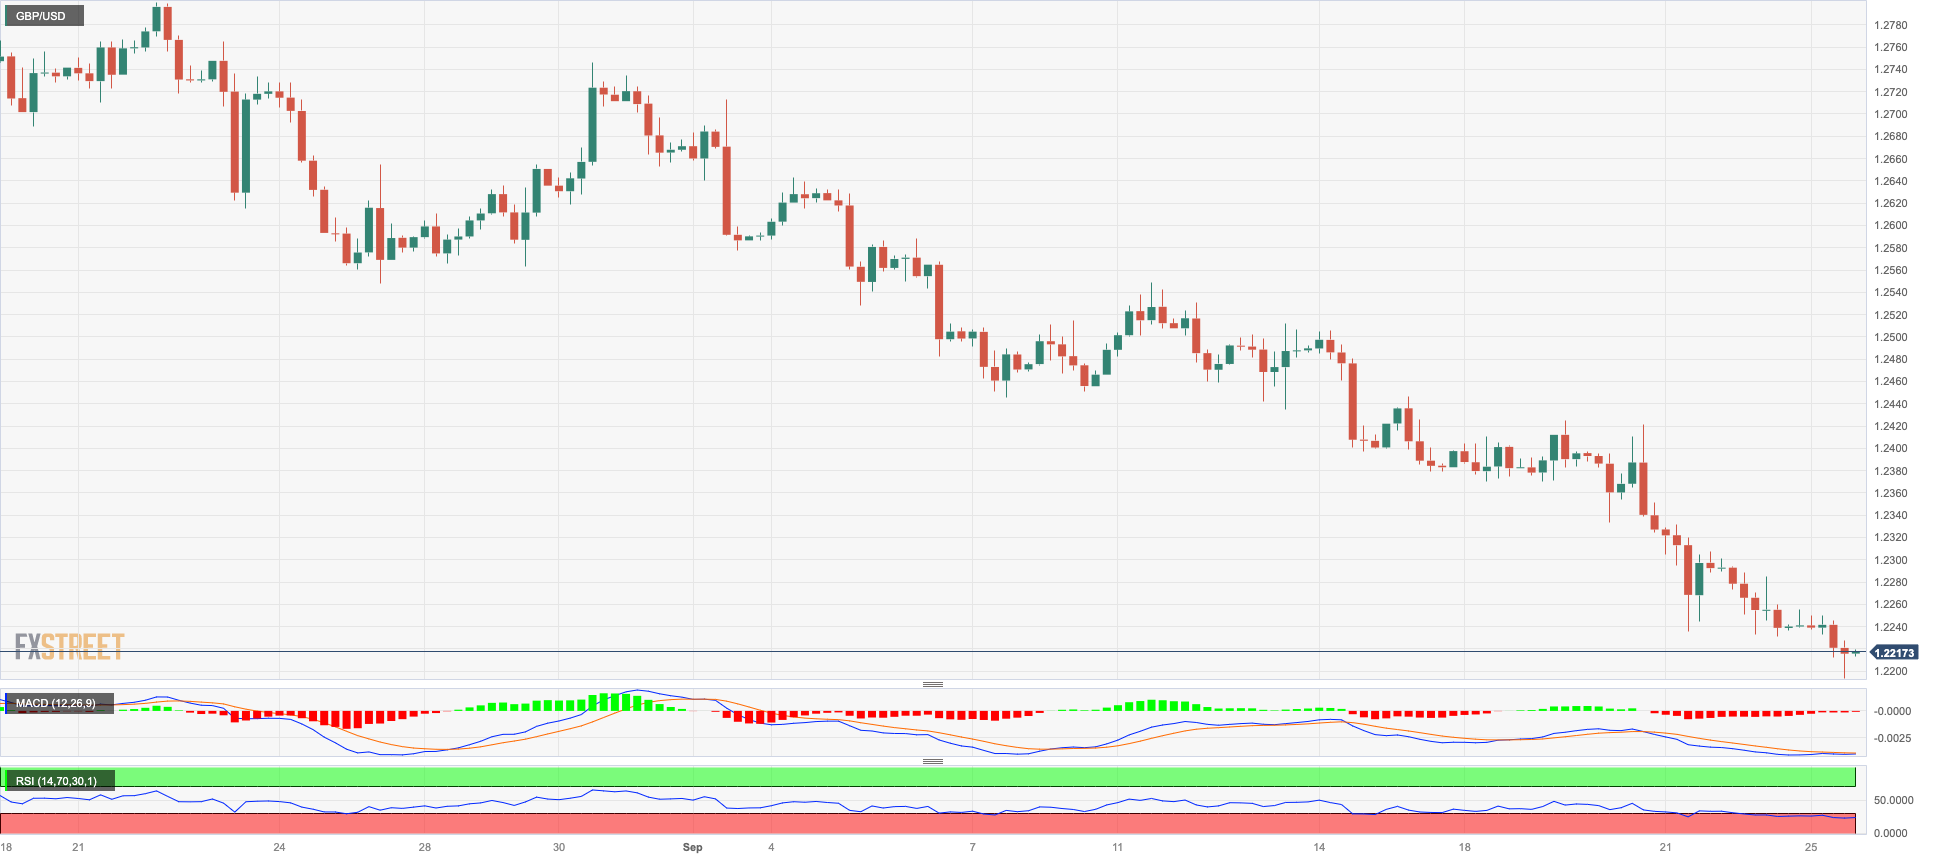
It was all about the dollar’s strength at the beginning of the week.
Against that, GBP/USD dropped to fresh multi-month lows, breaking below the key support at 1.2200 the figure.
Investors’ speculation of a tighter-for-longer stance by the Federal Reserve combined with last week’s dovish hold by the BoE, putting the British pound under further pressure and sponsoring the fourth daily pullback in a row of Cable.
Across the Channel, CBI Distributive Trades improved to -14 for the current month.
If GBP/USD breaks through the September low of 1.2193 (September 25), it might return to the critical round milestone of 1.2000 before the 2023 low of 1.1802 is reached (March 8). Instead, the initial upward barrier is the 200-day SMA at 1.2432, seconded by the weekly high at 1.2548 (September 11). The preliminary 100-day and 55-day SMAs are at 1.2636 and 1.2682, respectively, ahead of weekly peaks at 1.2746 (August 30), 1.2818 (August 10), and 1.2995 (July 27), all of which are ahead of the psychological level of 1.3000. The RSI slid deeper into the oversold zone on the daily chart, reaching the 21 zone.
Resistance levels: 1.2421 1.2548 1.2570 (4H chart)
Support levels: 1.2194 1.2189 1.2178 (4H chart)
AUDUSD
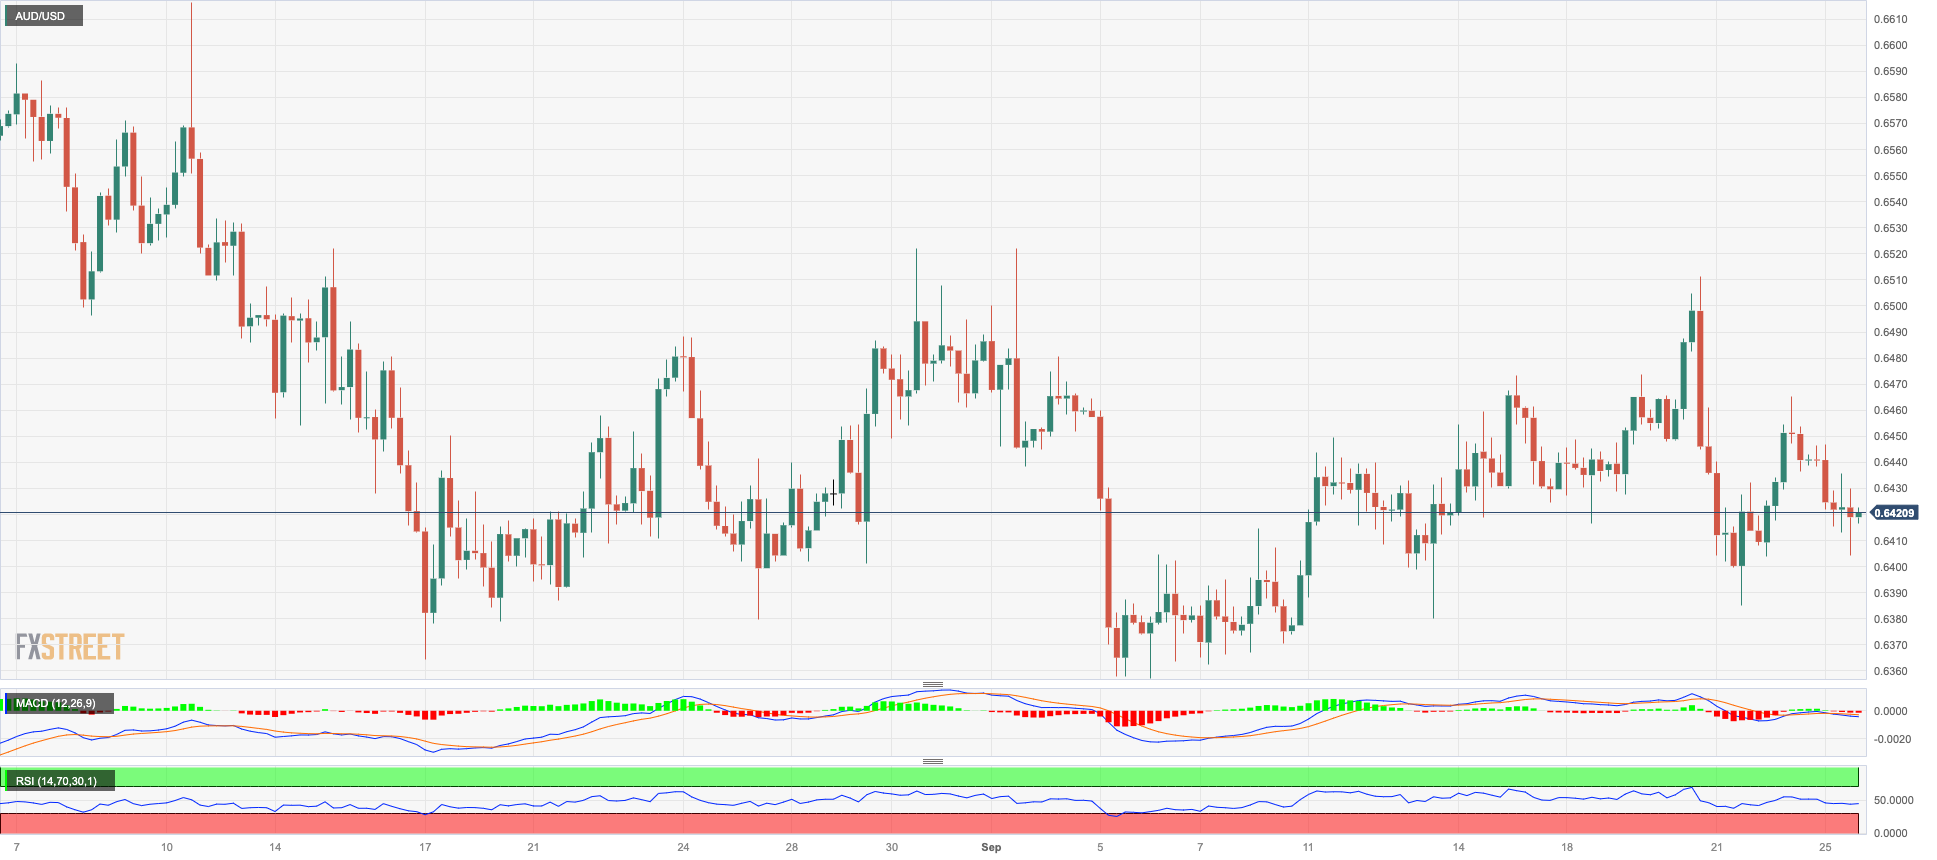
AUD/USD rapidly reversed Friday’s uptick and tested the area of two-day lows near the 0.6400 region at the beginning of the week.
Once again, the pronounced move higher in the US dollar, the unabated rally in US yields, and lower prices in copper and iron ore all kept the sentiment around the Aussie dollar depressed on Monday.
The Australian docket was empty.
For AUD/USD, the 2023 bottom at 0.6357 (September 5) is immediately below, followed by the November 2022 low at 0.6272 (November 7) and the 2022 low at 0.6179 (October 13). On the flip side, the nearest upward resistance might be found at the weekly high of 0.6522 (August 30), ahead of another weekly top of 0.6616 (August 10) and the 200-day SMA of 0.6693. Further gains might return the pair to its July peak of 0.6894 (July 14), just ahead of the June high of 0.6899 (June 16) and the critical level of 0.7000. North of here are the weekly top of 0.7029 (February 14) and the 2023 peak of 0.7157 (February 2). The RSI on the daily chart dropped to the sub-44 area.
Resistance levels: 0.6465 0.6511 0.6521 (4H chart)
Support levels: 0.6385 0.6357 0.6272 (4H chart)
GOLD
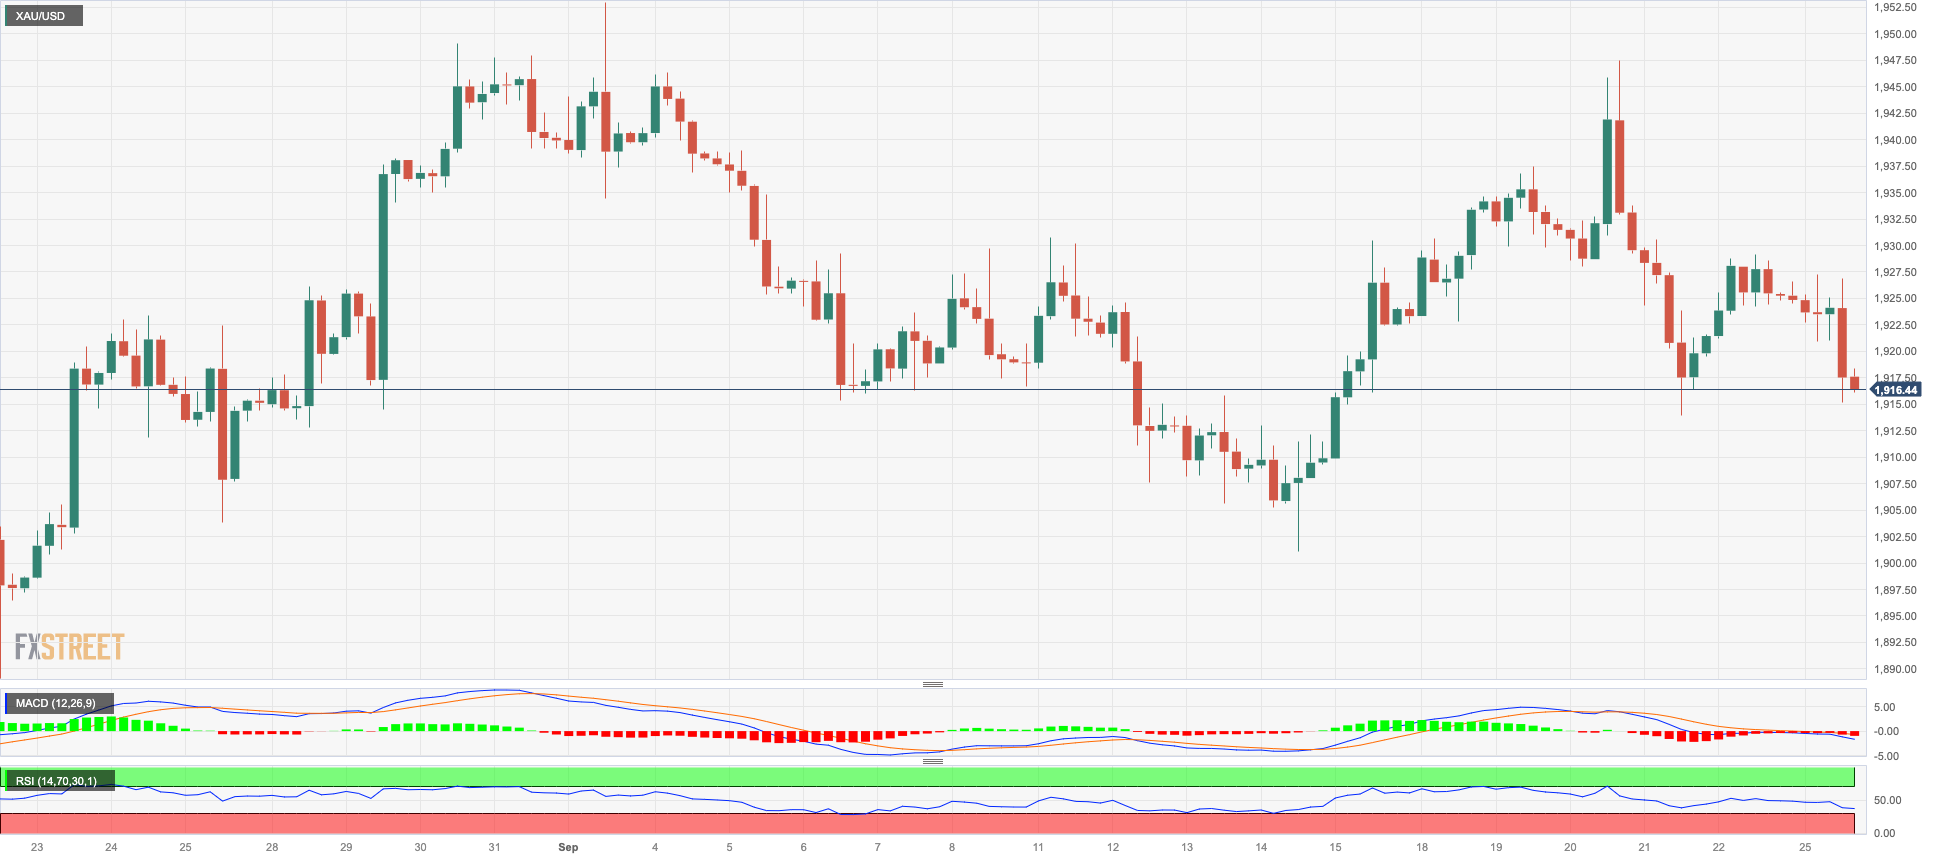
Gold prices grinded lower and visited two-day lows around $1915 in response to intense gains in the greenback on Monday.
In addition, the relentless march north in US yields across different timeframes and the firmer narrative of a tighter-for-longer Fed exacerbated the downside pressure for the precious metal at the beginning of the week.
Looking ahead, there is an anticipation that bullion will continue to face scrutiny due to the renewed narrative of the Fed’s prolonged tightening policy. This includes the palpable possibility of another 25 bps rate hike before the end of the year.
A further rise in the gold price now targets the weekly high at $1947 (September 20) ahead of the September top at $1953 (September 1). If the metal breaks above this zone, it could rise to the July peak of $1987 (July 20), just below the psychological $2000 level. North of here is the 2023 high at $2067 (May 4), seconded by the 2022 top at $2070 (March 8) and the all-time peak at $2075 (August 7, 2020). On the contrary, immediate support is at the September low of $1901 (September 14), just ahead of the key conflict zone at $1900 and the August low of $1885 (August 17). Loss of the latter exposes the 2023 low at $1804 (February 28), ahead of the critical conflict zone at $1800.
Resistance levels: $1947 $1953 $1987 (4H chart)
Support levels: $1913 $1901 $1884 (4H chart)
CRUDE WTI
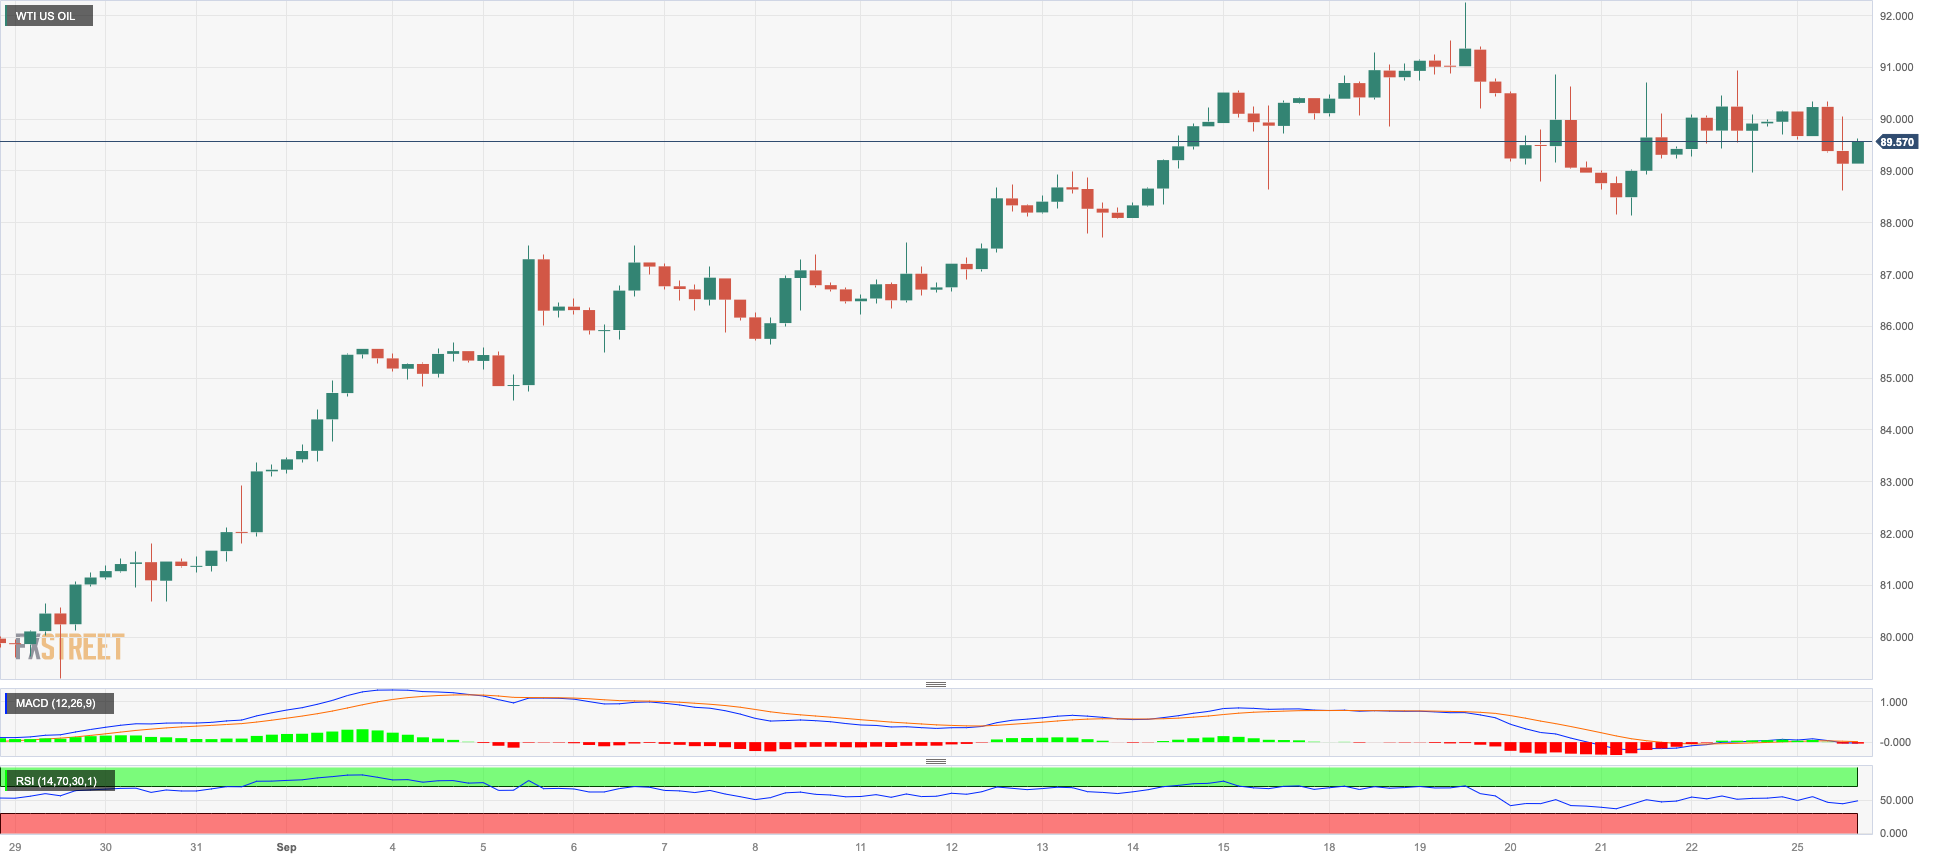
WTI prices fell on Monday after two consecutive daily advances.
The corrective knee-jerk in the commodity came pari passu with traders’ assessment of some easing in the conditions surrounding the Russian ban on its exports of gasoline and diesel announced last week.
In addition, further gains in the greenback lifted the USD Index (DXY) to new YTD peaks and were also behind the negative price action in the commodity on Monday.
Later in the week, the API and the EIA will report on US crude oil inventories in the week to September 22 on Tuesday and Wednesday, respectively.
Given the current trend in the WTI price, the 2023 high at $92.63 (September 19) appears to be the immediate obstacle to the uptrend, before the November 2022 top at $93.73 (November 7) and the weekly peak at $97.65 (August 30, 2022). A breakout of the latter could bring a possible visit to the psychological $100.00 mark per barrel back into focus. The weekly low at $88.42 (September 21), on the other hand, is the immediate target ahead of the temporary 55-day SMA at $82.48. From here, we head down to the August low at $77.64 (August 24) and the important 200-day SMA at $76.99. If this zone is cleared, weekly lows at $73.89 (July 17) and $66.86 (June 12) become visible, both ahead of the 2023 low at $63.61 (May 4). Further south, the December 2021 low at $62.46 (December 2) is seen before the important $60.00 level is reached.
Resistance levels: $91.29 $92.63 $93.73 (4H chart)
Support levels: $89.08 $88.34 $86.12 (4H chart)
GER40
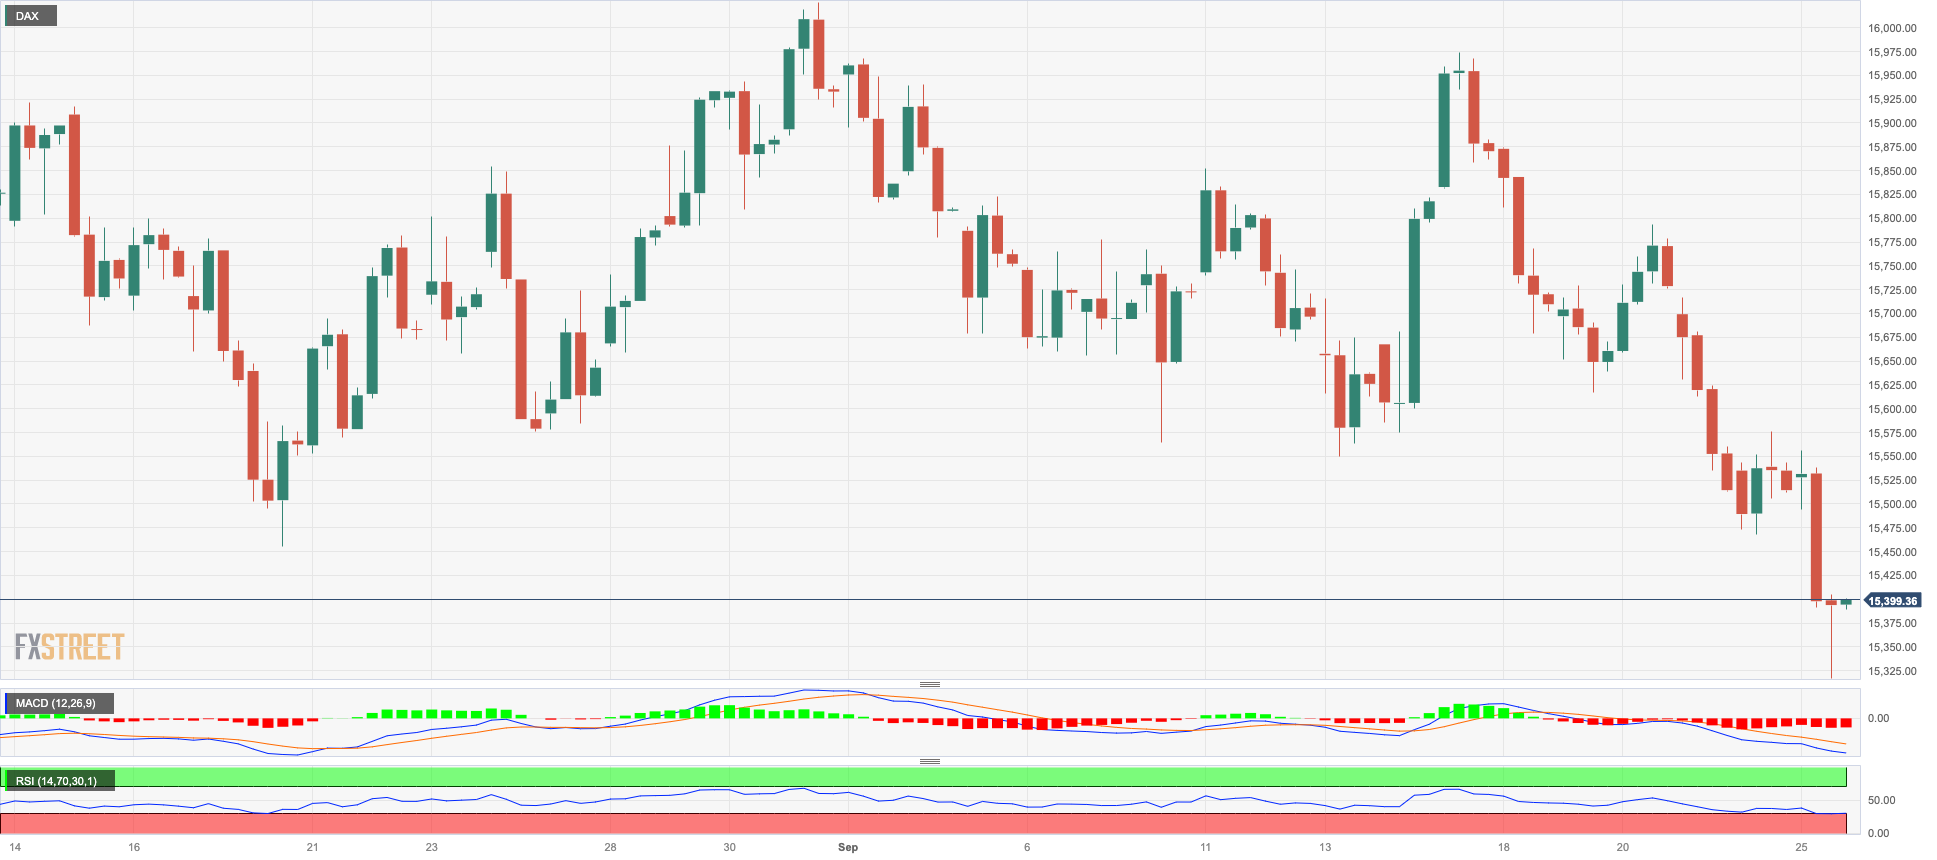
Germany's blue-chip stock index, the DAX40, continued its downward trajectory for the third consecutive session, reaching new six-month lows around the 15300 level at the start of the week.
Investors' increasing belief in the Fed’s inclination to maintain a cautious approach for a more extended period than initially anticipated has once again dampened European investors' sentiment. This sentiment is compounded by resurfacing concerns about inflation, triggered by the recent surge in crude oil prices, as well as mounting uncertainty surrounding the Chinese economic recovery.
Furthermore, the mixed results from the German IFO survey have contributed to the prevailing selling pressure surrounding the index.
Meanwhile, Germany's 10-year bund yields have surpassed 2.80% for the first time since mid-July 2011.
The DAX40 broken below the key 200-day SMA on Friday, opening the door to extra weakness in the short-term horizon. The resurgence of the negative bias could see the index retest the March low of 14458 (March 20), followed by the December 2022 low of 13791 (December 20) and the 2022 low of 11862 (September 28). On the upside, the first resistance seems to be the September high of 15989 (September 14), ahead of the weekly tops of 16042 (August 31) and 16060 (August 10). If the index breaks above the latter level, investors' attention could be drawn to the possibility of a visit to the all-time high of 16528 (July 31). The day-to-day RSI retreated to the proximity of 36.
Best Performers: Heidelbergcement, Siemens Energy AG, Daimler Truck Holding
Worst Performers: Zalando SE, Bayer, RWE AG ST
Resistance levels: 15810 15989 16042 (4H chart)
Support levels: 15329 14809 14458 (4H chart)
NASDAQ
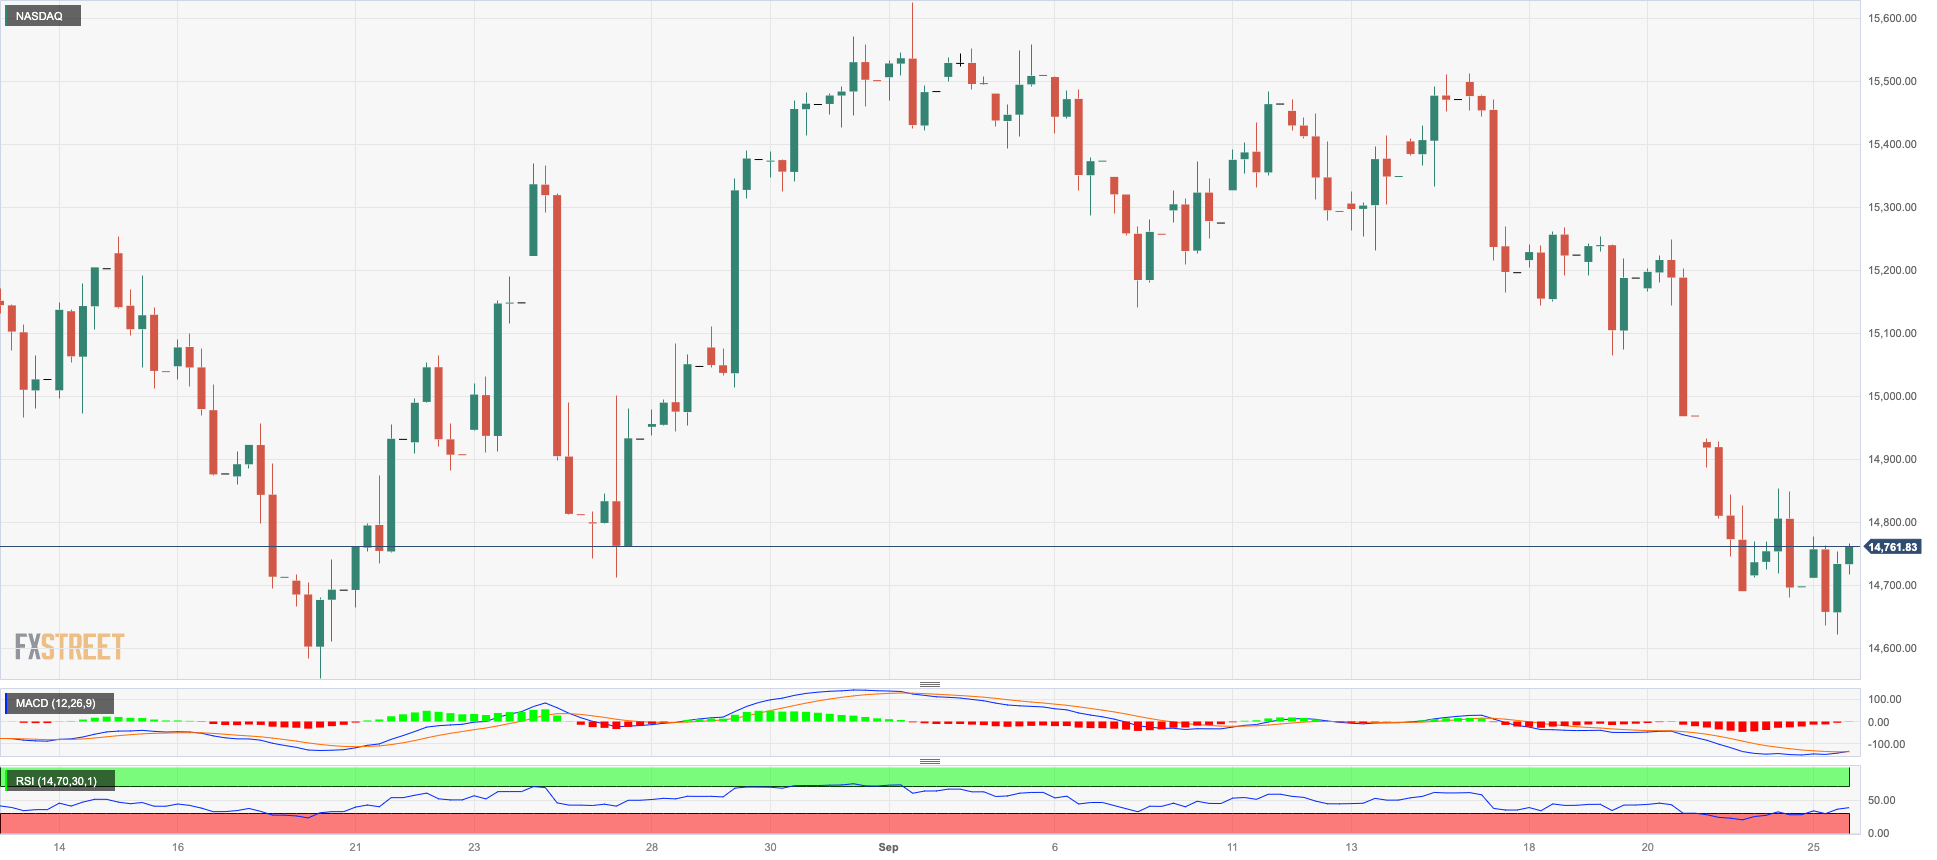
After experiencing a momentary decline to multi-week lows around the 14600 level, the technology benchmark Nasdaq 100 was able to regain its composure and conclude Monday's session with modest gains.
The sustained positive sentiment observed in the US tech sector stood in contrast to the ongoing strengthening of the greenback and the significant rise in US yields across various maturities. These developments occurred amidst the Fed’s continued narrative of a more prolonged period of tightened monetary policy.
The Nasdaq 100 appears under pressure despite the ongoing rebound. That said, the index may be forced to revisit the August low of 14557 (August 18), ahead of the weekly lows of 14283 (June 7) and 13520 (May 24). The loss of the latter might pave the way for a test of the important 200-day SMA around 13496. Instead, the index faces a small stumbling barrier at the 55-day SMA of 15270 before the weekly high of 15512 (September 14) and the September top of 15618 (September 1). Extra gains from here could expose the weekly peak of 15803 (July 31) ahead of the 2023 high of 15932 (July 19) and the round 16000 mark. The daily RSI edged a tad past 37.
Top Gainers: GE HealthCare, Old Dominion Freight Line, Qualcomm
Top Losers: Warner Bros Discovery, JD.com Inc Adr, Zscaler
Resistance levels: 15512 15618 15803 (4H chart)
Support levels: 14615 14557 14283 (4H chart)
DOW JONES
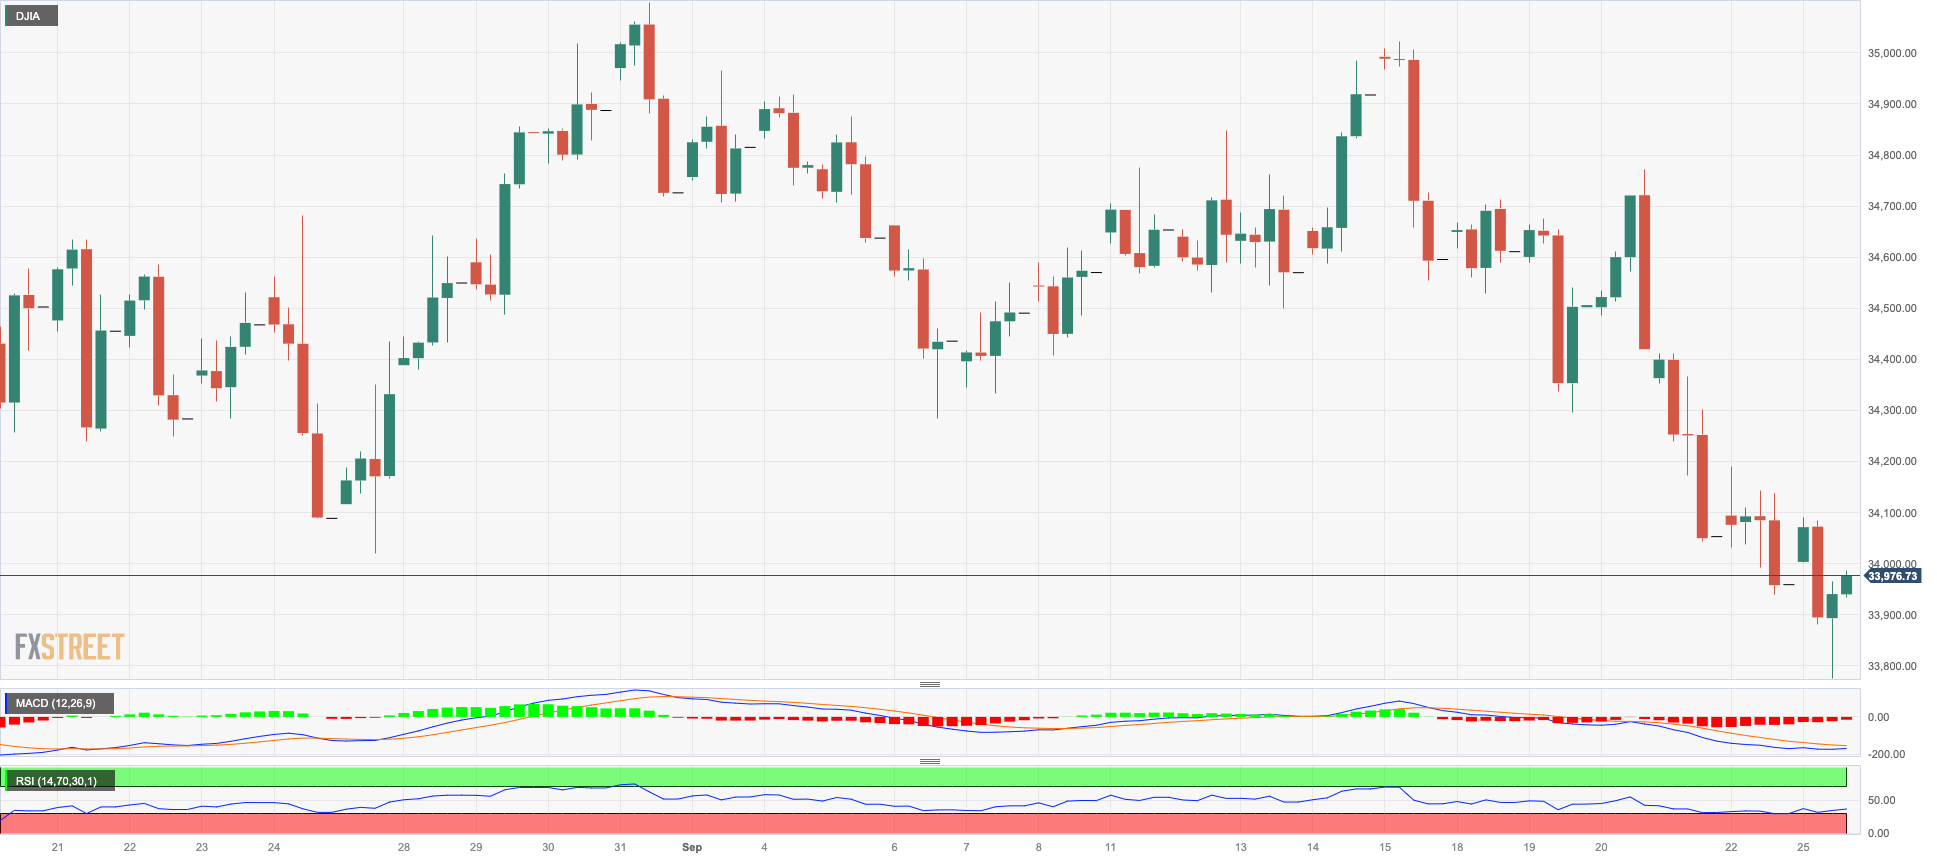
The beginning of the week was marked by fluctuating movements in US equities, as observed through the Dow Jones index.
The index initially experienced a bounce-back from its two-month lows around 33800, a significant level where the key 200-day SMA also sits. Towards the end of Monday's session, it managed to regain stability and climb back above the 34000 mark.
In fact, investor sentiment remained affected by renewed concerns about the Fed’s prolonged adherence to a restrictive policy stance, which was perceived as more long-lasting than previously anticipated.
Additionally, worries regarding inflation and the persistent upward trajectory of the greenback and US yields added further weight to the market sentiment.
On the whole, the Dow Jones advanced 0.05% to 33982, the S&P500 gained 0.35% to 4335, and the tech-focused Nasdaq Composite rose 0.47% to 13275.
In the case of more losses, Dow Jones may aim for the September low at 33780 (September 25). Further south, the index may reach the July low of 33705 (July 10), which would be followed by the May low of 32586 (May 25) and the 2023 low of 31429 (March 15). Just the opposite, the September high of 34977 (September 14) looks to be the immediate up-barrier, prior to the weekly top of 35070 (August 31) and the 2023 peak of 35679 (August 1). If the latter is surpassed, the 2022 high at 35824 (February 9) might be revealed before the all-time top at 36952 (January 5, 2022). The daily RSI dropped below 35.
Top Performers: Dow, Chevron, Apple
Worst Performers: 3M, Coca-Cola, Amgen
Resistance levels: 34977 35070 35578 (4H chart)
Support levels: 33780 33705 33610 (4H chart)
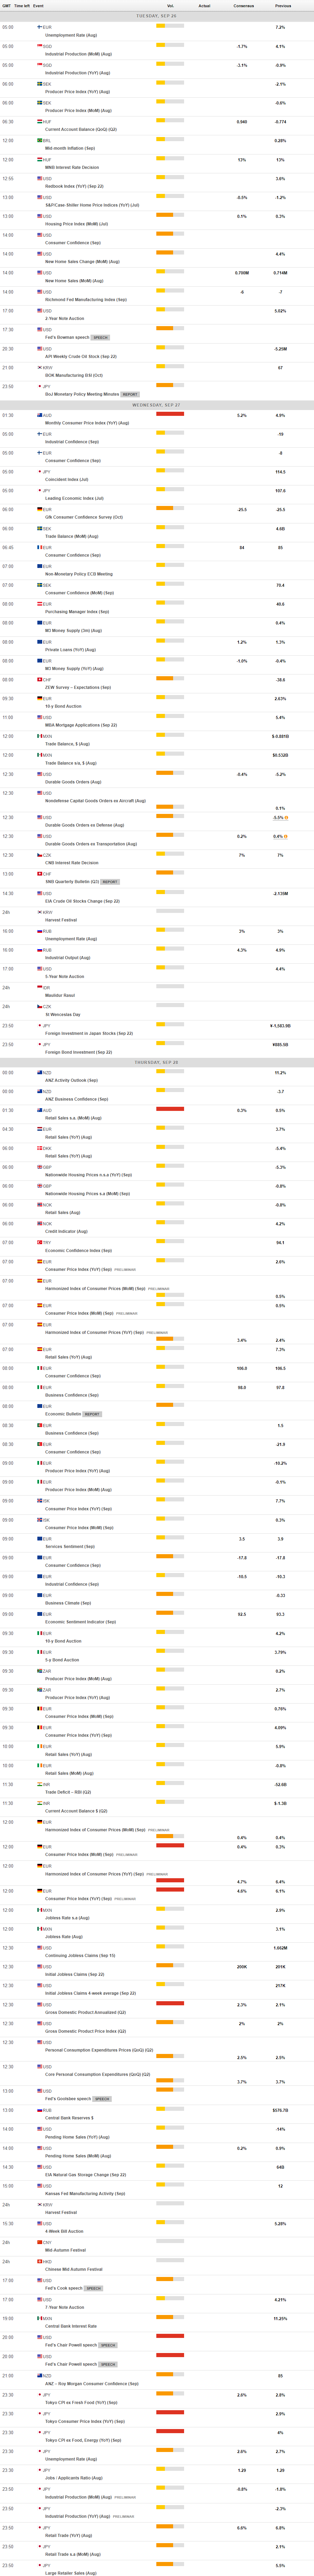
MACROECONOMIC EVENTS
All Information & Updates provided by:

All information relating to the financial markets available on this page has been prepared and issued by FXStreet (Forexstreet SL, Spain, Reg: B62498233) on the basis of publicly available information and all information believed to be reliable and does not conflict with Kuwaiti local laws, and all necessary care has been taken to before the company to ensure that the facts mentioned are correct from the source.
NCM Investment nor any of its directors or employees shall in any way be held responsible for the contents of this news, and the information contained on this page is intended only to provide clients with publicly available information and should not be construed as investment advice, report or analysis and/or constitute an offer or invitation to buy or sell financial instruments of any kind.
RISK WARNING: Forex and CFDs are highly risky leveraged products, as losses can exceed deposits. Please ensure you understand all the risks and take independent advice if necessary. NCM will segregate the clients based on the criteria of the regulator and its bylaws. NCM does not provide any advisory service; the material published does not constitute advice or a recommendation for a transaction in any financial instrument. NCM accepts no responsibility for any use of the content presented and any consequences of that use. Anyone acting on the information provided does so at their own risk.