
- Contact Us:
-

-

-

-


Daily Market Updates
27 Sep 2023
USDJPY
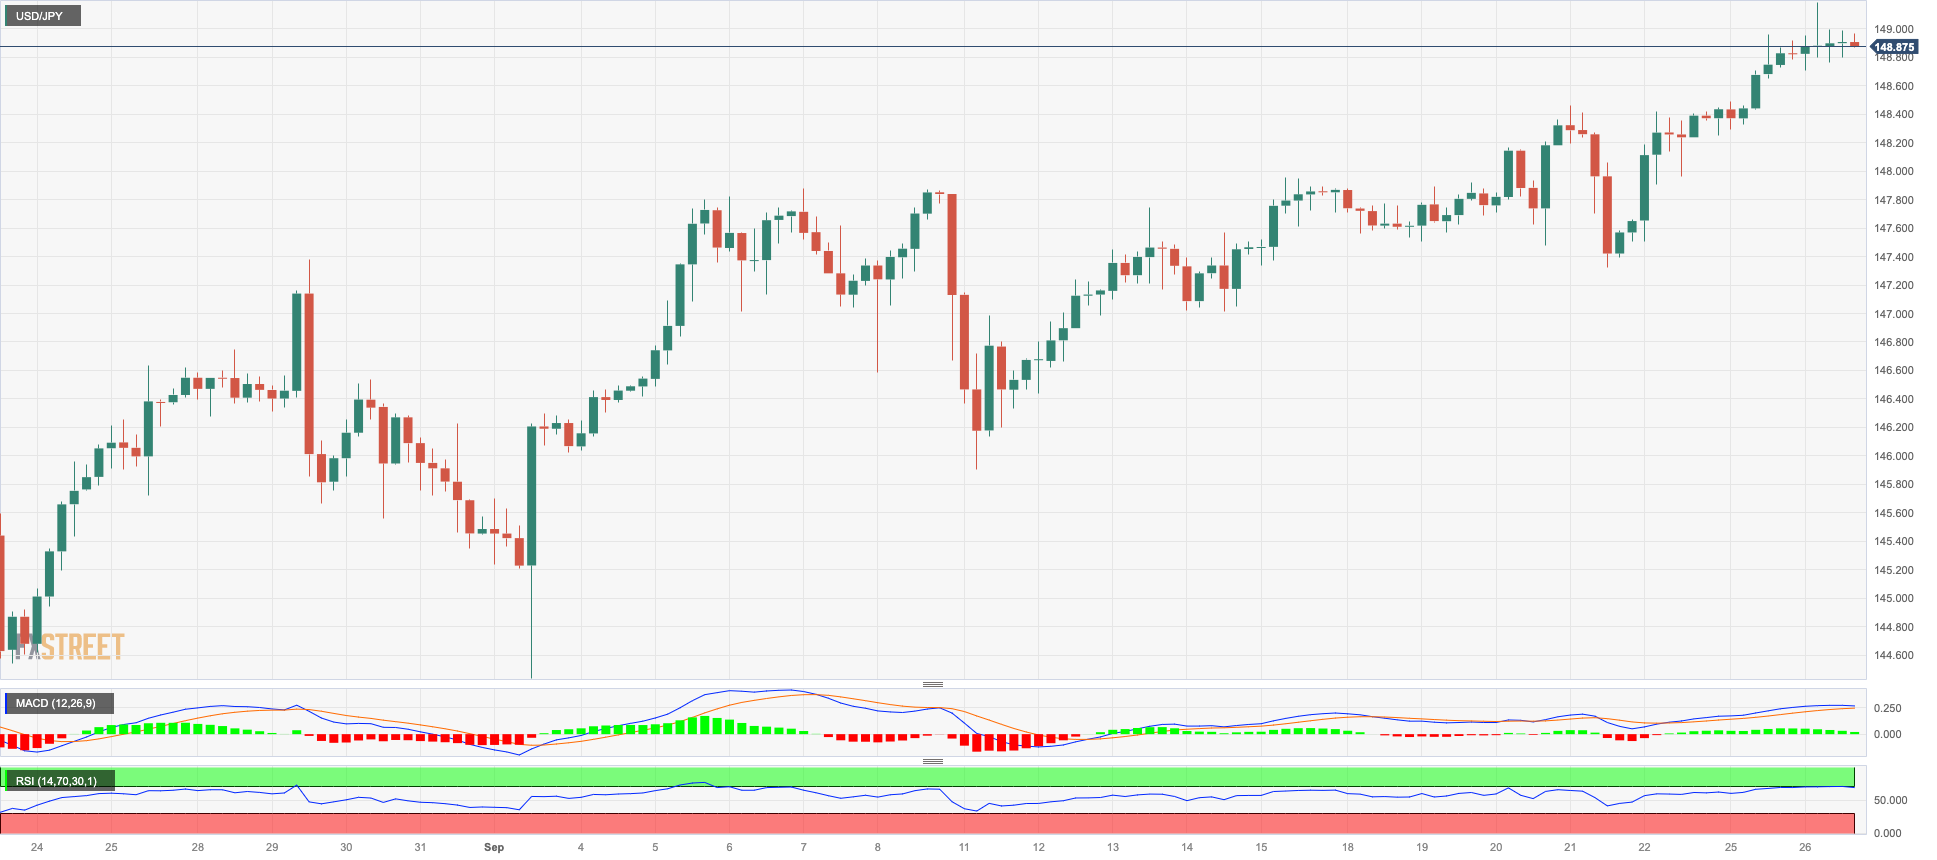
USD/JPY lost upside momentum and gave away initial gains soon after climbing to fresh 2023 peaks near 149.20 on Tuesday.
Indeed, spot rose to an area last traded in late October 2022 past the 149.00 hurdle on the back of the initial move higher in the greenback, while the late knee-jerk in US yields across different timeframes also contributed to the corrective retracement.
In addition, the Japanese currency managed to regain some buying interest in response to omnipresent comments from the BoJ and government officials, who kept the possibility of intervening in the FX markets well in place.
The Japanese docket was empty on Tuesday.
If the USD/JPY goes above the 2023 high of 149.18 (September 26), it may challenge the 2022 top of 151.95. (October 21). On the downside, minimal support can be found around the weekly low of 145.89 (September 11), which is just above the 55-day intermediate SMA of 144.52. The August low of 141.50 (August 7) is south of here, prior to the weekly low of 138.05 (July 28) and the 200-day SMA at 137.76. A deeper decline might jeopardize the weekly low of 133.01 (April 26), as well as the lower levels of 132.01 (April 13) and 130.62. (April 5). The day-to-day RSI settles around the 64 region.
Resistance levels: 149.18 149.45 151.95 (4H chart)
Support levels: 147.32 146.60 145.89 (4H chart)
GBPUSD
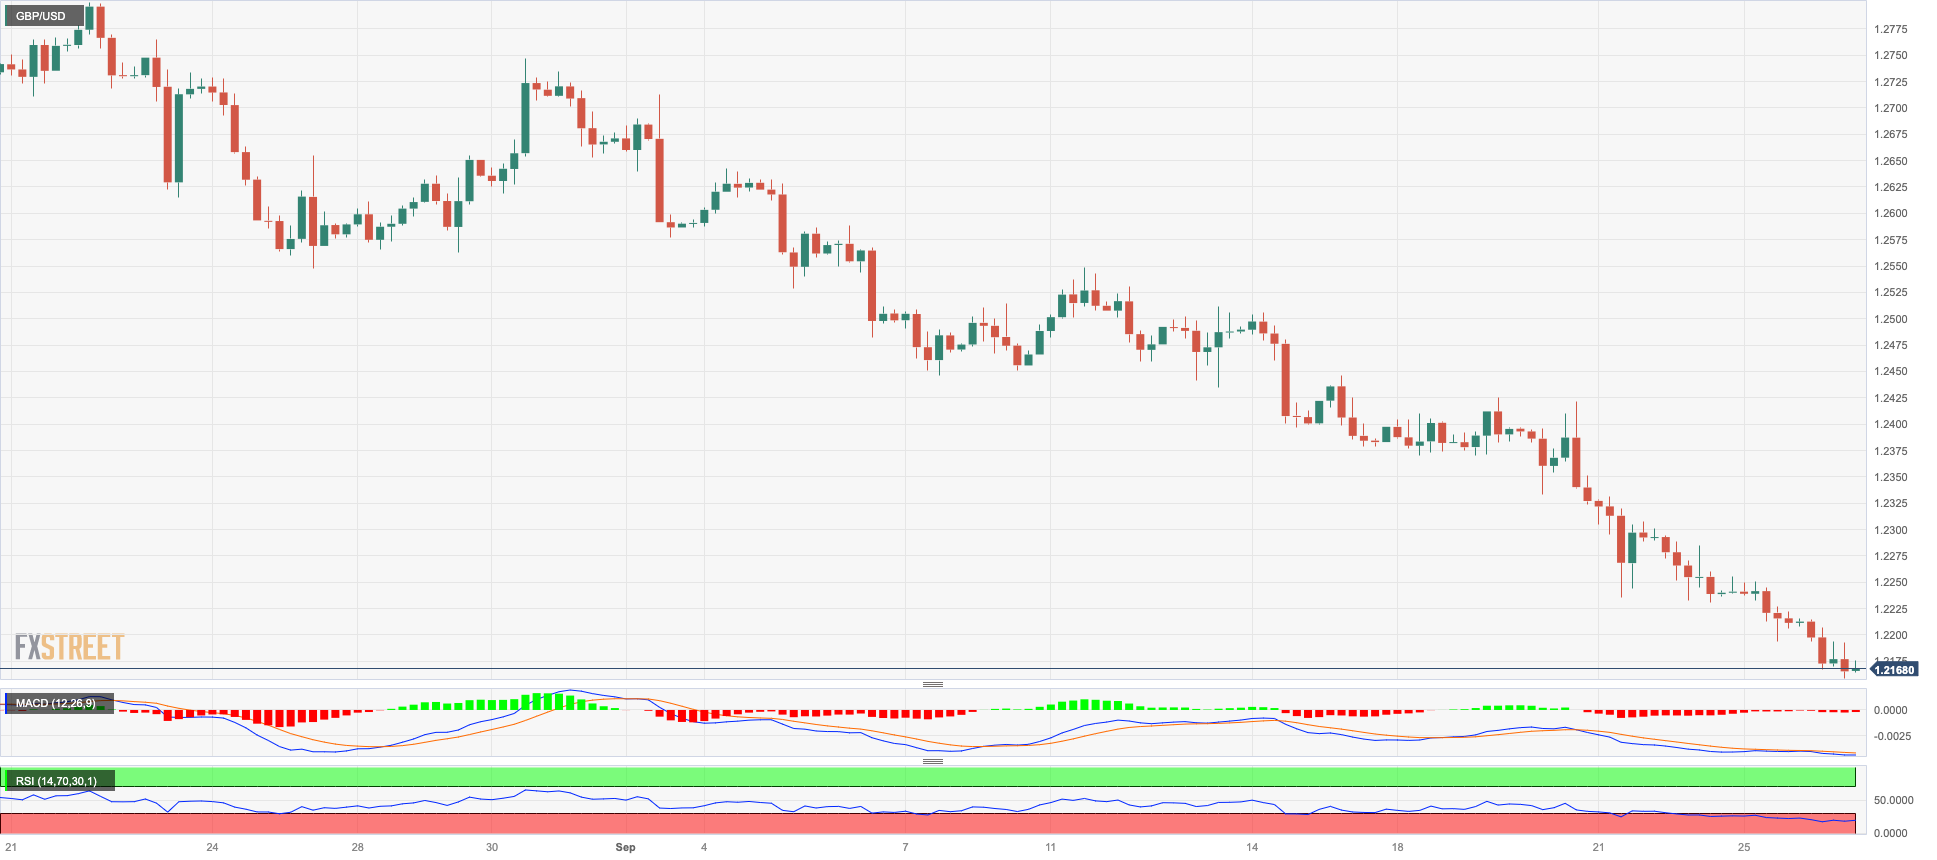
GBP/USD accelerated its losses on the back of the firmer upside bias in the greenback and dropped for the fifth session in a row on Tuesday, this time breaking below the 1.2200 support with certain conviction.
In fact, further weakness in the British pound dragged Cable to levels last traded in mid-March in the 1.2160/55 band against the backdrop of the underlying strong momentum in the dollar and speculation that the BoE might be done hiking rates for the time being, as per last week’s dovish hold by the central bank.
There were no data releases in the UK calendar on Tuesday.
If GBP/USD breaks the September low of 1.2159 (September 26), it could return to the critical round milestone of 1.2000 before reaching the 2023 low of 1.1802 ( March 8). Instead, the first upside barrier is the 200-day SMA at 1.2432, seconded by the weekly high at 1.2548 (September 11). The preliminary 100-day and 55-day SMAs are at 1.2632 and 1.2669 respectively, prior to the weekly peaks at 1.2746 (August 30), 1.2818 (August 10) and 1.2995 (July 27), all ahead of the psychological 1.3000 level. The daily RSI fell deeper into the oversold zone and approached the 21 yardstick.
Resistance levels: 1.2347 1.2421 1.2548 (4H chart)
Support levels: 1.2159 1.2010 1.1802 (4H chart)
AUDUSD
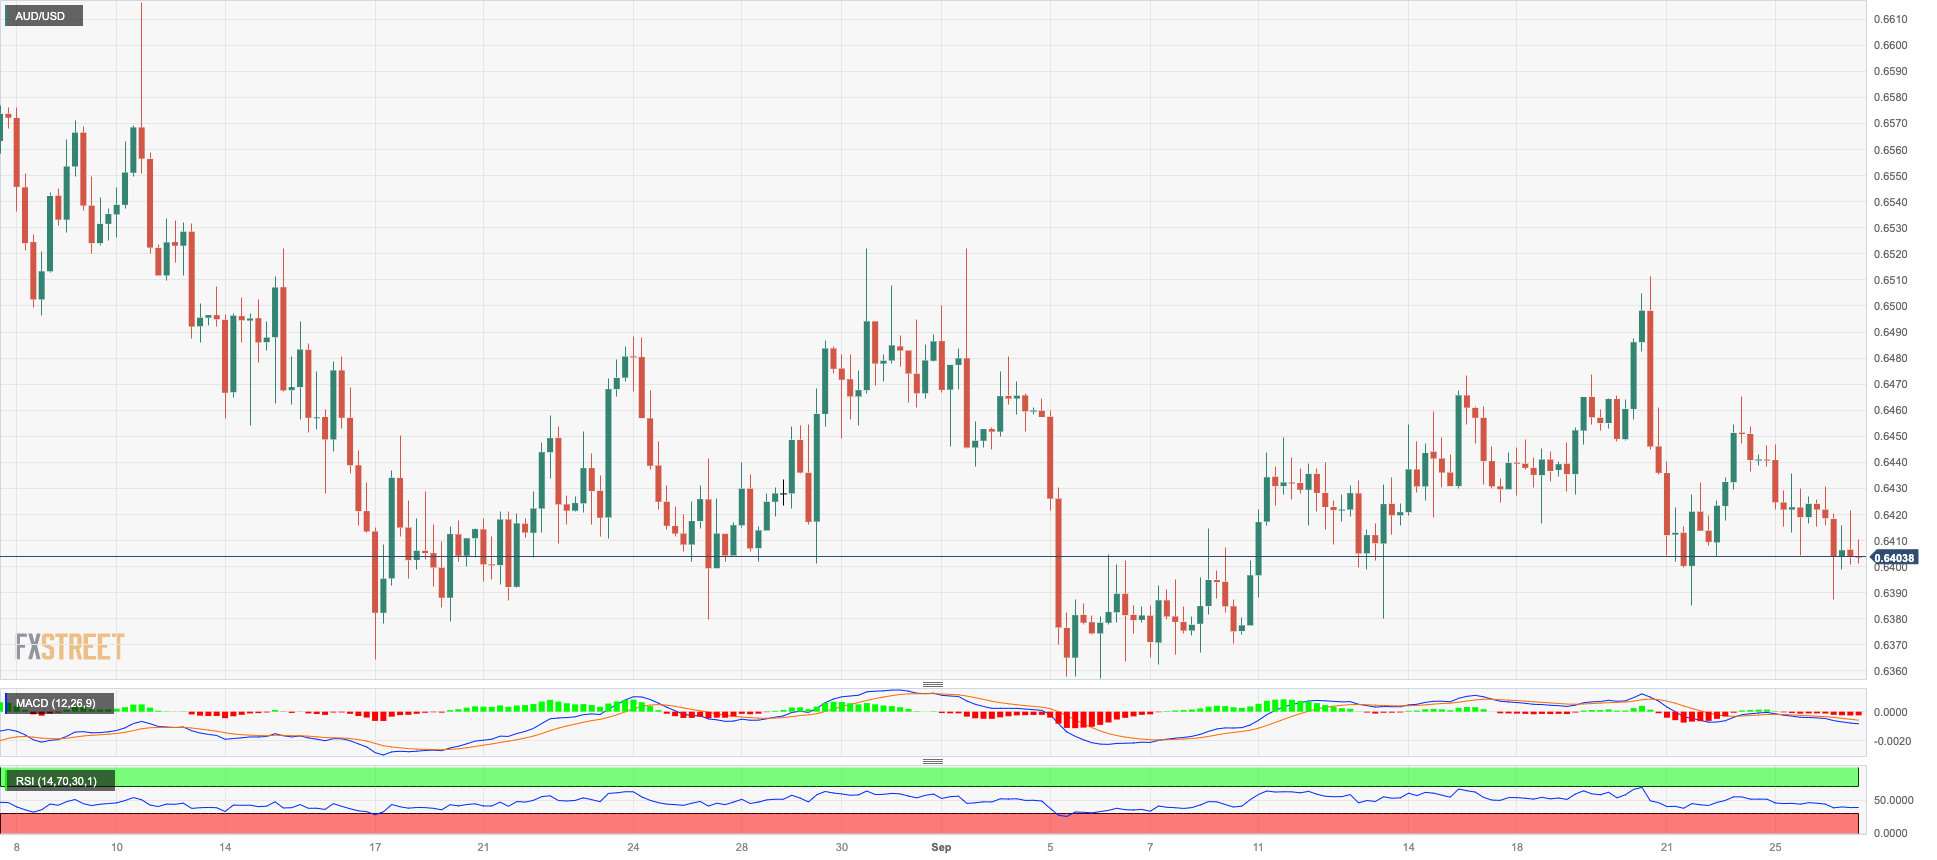
AUD/USD extended the pessimism seen at the beginning of the week and broke below the key support at 0.6400 the figure on Tuesday.
The pair’s daily pullback came once again in response to further strength in the greenback amidst the broad-based risk-off sentiment, while the generalized downbeat mood in the commodity galaxy also collaborated with the extra weakness in the Aussie dollar.
There were no data releases scheduled for Oz on Tuesday.
Next on the downside for AUD /USD appears the 2023 low at 0.6357 (September 5) prior to the November 2022 low at 0.6272 (November 7) and the 2022 low at 0.6179 (October 13). On the other hand, the next up-barrier could be found at the weekly high of 0.6522 (August 30), ahead of another weekly top of 0.6616 (August 10) and the 200-day SMA of 0.6692. Further gains could take the pair to its July peak of 0.6894 (July 14), just ahead of the June high of 0.6899 (June 16) and the critical level of 0.7000, north of which is the weekly high at 0.7029 (February 14) and the 2023 top at 0.7157 (February 2). The RSI on the daily chart deflated to the sub-44 area.
Resistance levels: 0.6465 0.6511 0.6521 (4H chart)
Support levels: 0.6385 0.6357 0.6272 (4H chart)
GOLD
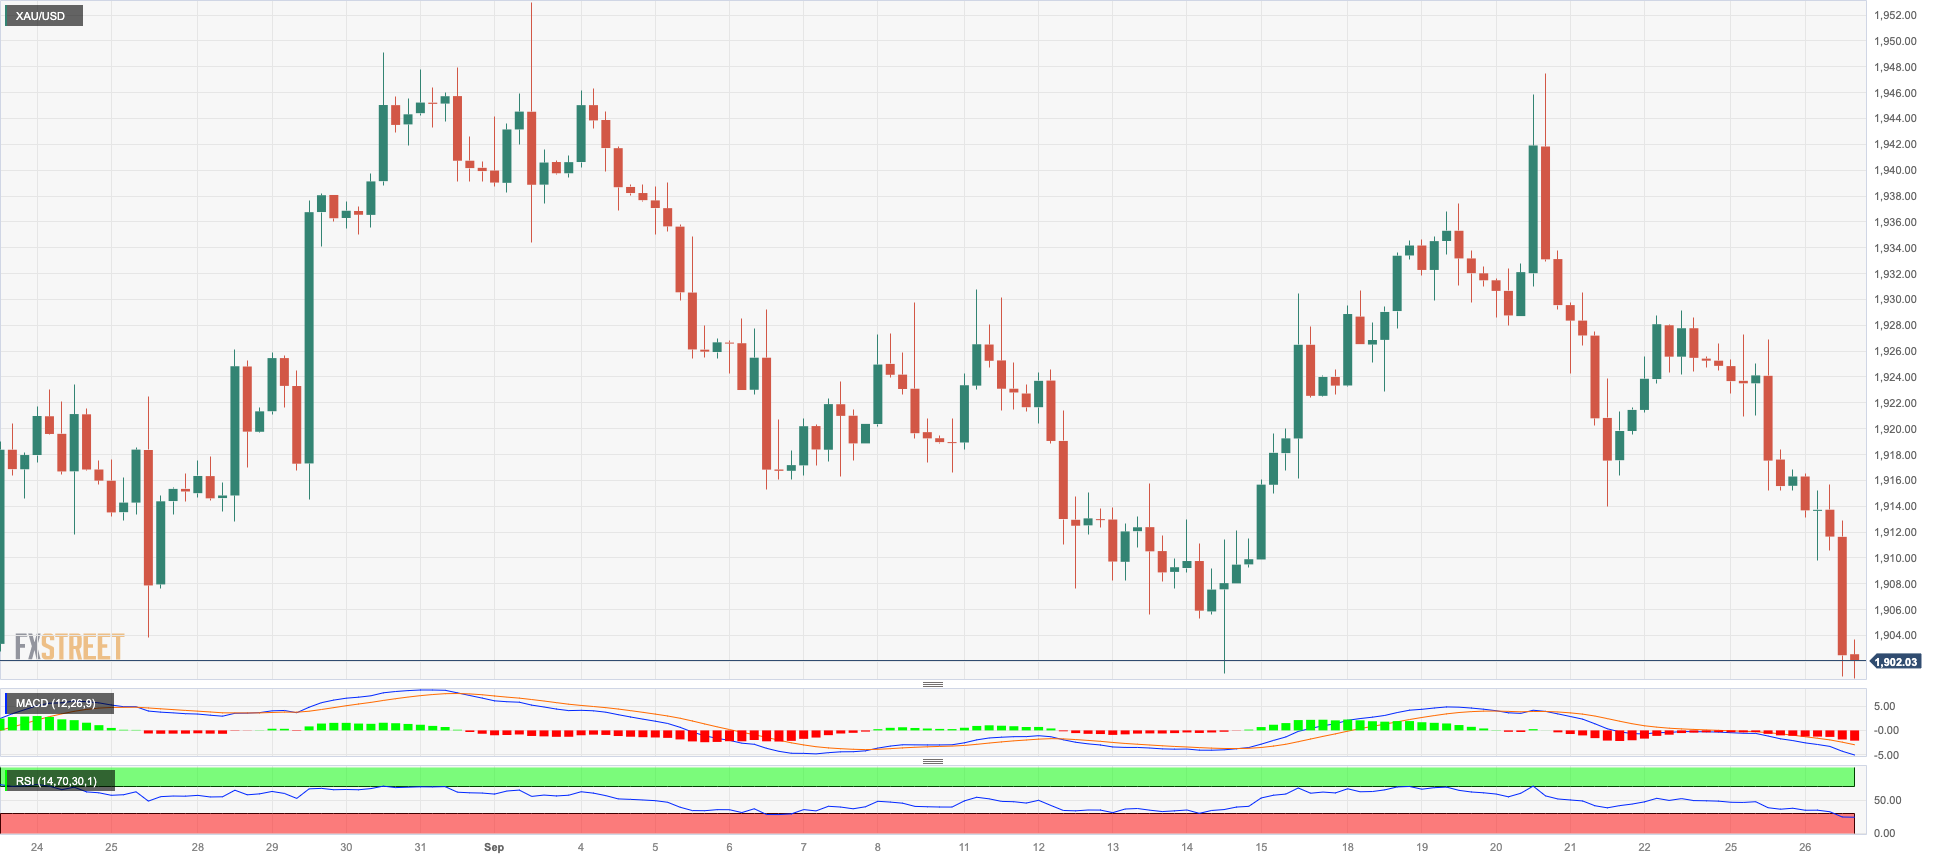
The marked upside momentum in the greenback put the yellow metal under extra selling pressure and dragged it to new five-week lows around the key $1900 neighbourhood on Tuesday.
Indeed, the continuation of the rally in the buck in combination with US yields navigating multi-year peaks sponsored the second consecutive daily pullback in the precious metal.
In the upcoming period, there is a prevailing expectation that bullion will remain under careful examination as a result of the revived narrative surrounding the Fed’s extended approach to tightening policy. This encompasses the discernible likelihood of another quarter-point rate hike prior to the conclusion of the year.
Next on the downside for gold comes the August low of $1885 (August 17) prior to the 2023 bottom at $1804 (February 28), just ahead of the crucial contention zone around $1800 per troy ounce. Having said that, bulls should meet initial hurdle at the key 200-day SMA at $1926 ahead of the weekly high of $1947 (September 20) and the September top of $1953 (September 1). If the metal breaks through this zone, it might reach the July peak of $1987 (July 20), which is just below the psychological $2000 mark. The 2023 high is $2067 (May 4), seconded by the 2022 top of $2070 (March 8) and the all-time peak of $2075. (August 7, 2020).
Resistance levels: $1918 $1947 $1953 (4H chart)
Support levels: $1900 $1884 $1804 (4H chart)
CRUDE WTI
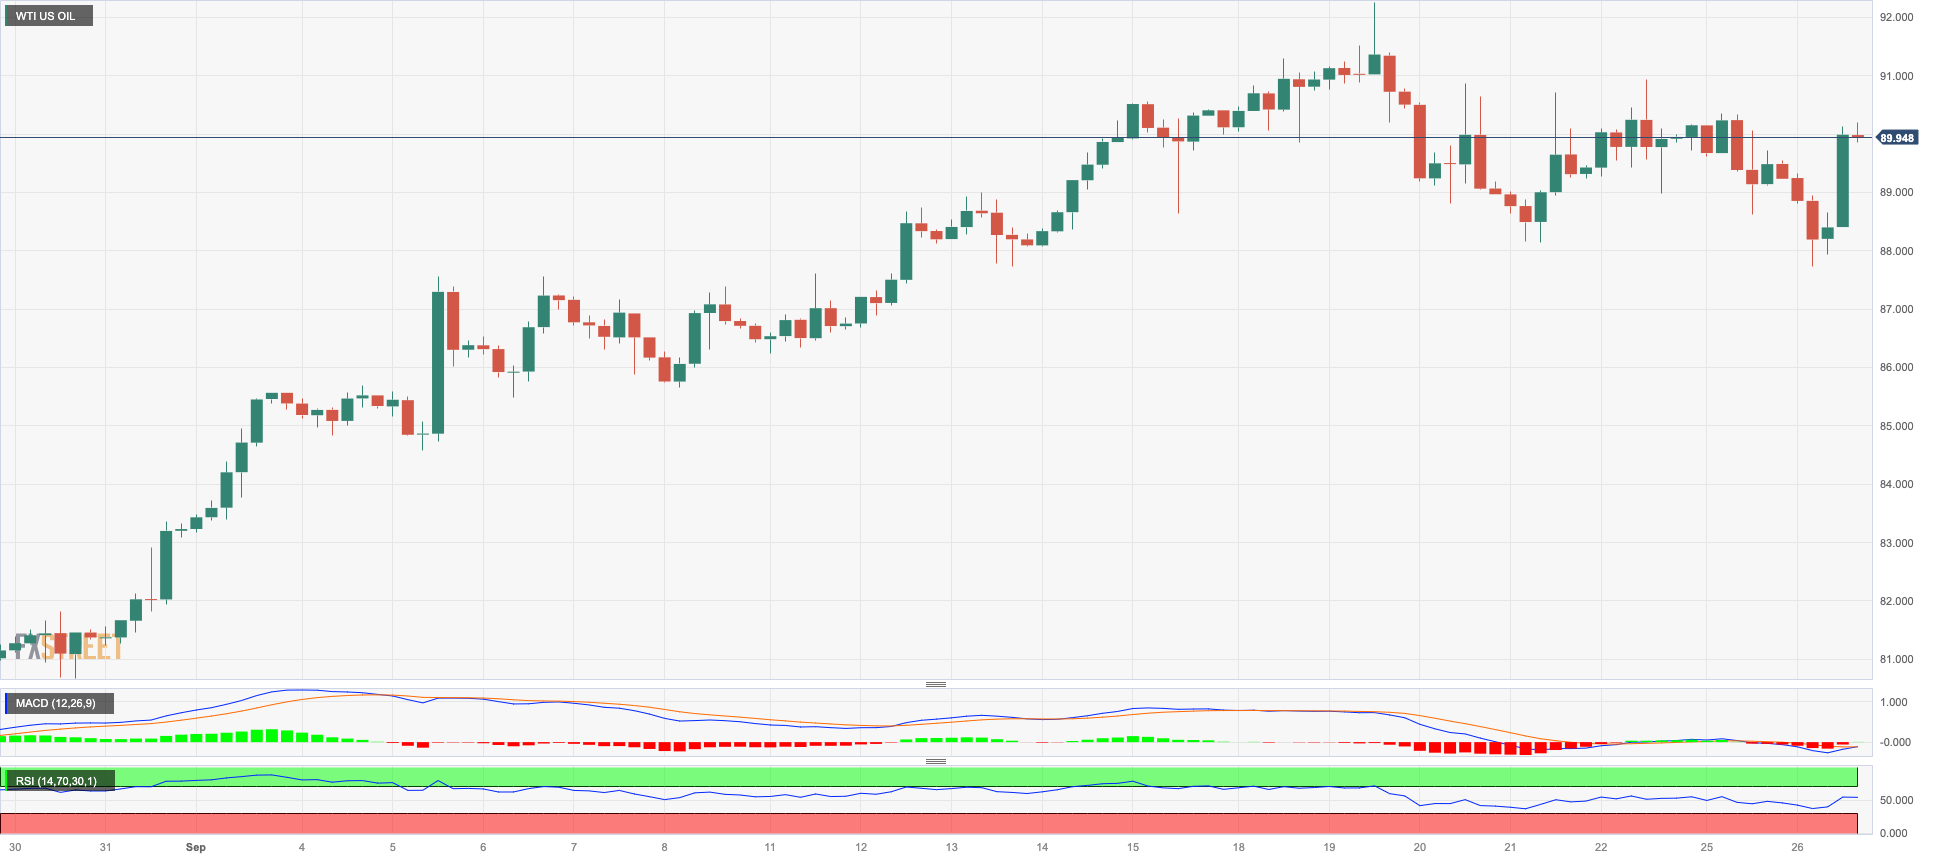
Prices of the American benchmark for the sweet light crude oil rapidly faded Monday’s decline and reclaimed the area above the key $90.00 mark per barrel on Tuesday.
The movement of the commodity's price was influenced by the prevailing narrative of limited supply, which was reinforced when Russia reduced its crude oil exports and Saudi Arabia extended its unilateral oil production cuts. Additionally, concerns about demand due to the possibility of an economic slowdown also impacted traders' decisions.
Later in the session, the API will report on US crude oil inventories in the week to September 22.
The resumption of the upside pressure could prompt WTI to revisit the 2023 high of $92.63 (September 19) ahead of the November 2022 top of $93.73 (November 7) and the weekly peak of $97.65 (August 30 2022), all prior to the psychological 100.00 mark per barrel. By contrast, the 55-day SMA at $82.78 offers interim contention ahead of the August low of $77.64 (August 24). The loss of the latter exposes a probable test of the key 200-day SMA at $77.06 before the weekly low of $73.89 (July 17) and the June low of $66.85 (June 12).
Resistance levels: $91.29 $92.63 $93.73 (4H chart)
Support levels: $88.6 $86.12 $84.99 (4H chart)
GER40
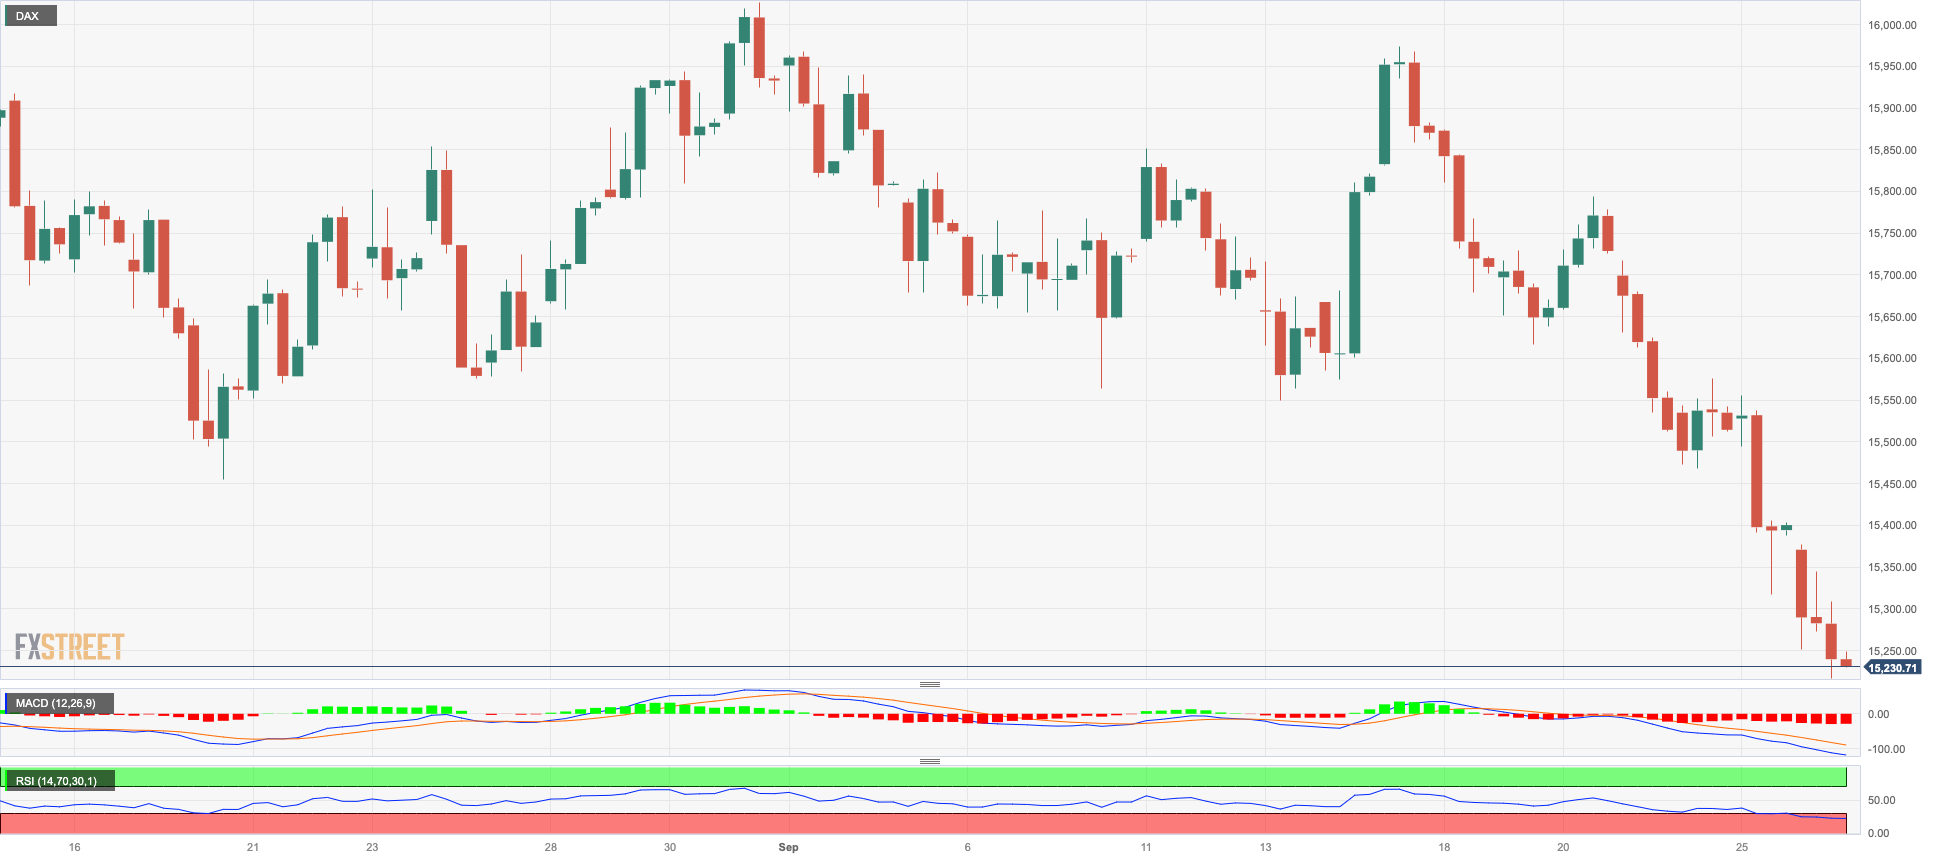
The key German DAX40 retreated for the fourth session in a row and dropped to new six-month lows near the 15200 zone on Tuesday.
The generalized risk-off environment stemming from the likelihood that the Fed could extend its tighter-for-longer stance coupled with the potential recession in the euro bloc all weighed on European investors’ sentiment on Tuesday, dragging most of the regional markets further into negative territory.
Collaborating with the sour mood, crude oil prices resumed their uptrend, while concerns around the Chinese economic recovery remained well on the rise for yet another day.
The loss of the September low of 15229 (September 26), could prompt the DAX40 to revisit the March low of 14458 (March 20), ahead of the December 2022 low of 13791 (December 20), and the 2022 low of 11862 (September 28). On the upside, the initial barrier seems to be the 200-day SMA at 15557 prior to the September high of 15989 (September 14), followed by the weekly tops of 16042 (August 31) and 16060 (August 10). If the index breaks below this level, investors' attention may be attracted to a potential visit to the all-time peak of 16528. (July 31). The everyday RSI sank to the 32 zone.
Best Performers: Sartorius AG VZO, MTU Aero, Qiagen
Worst Performers: Vonovia, Siemens Energy AG, Porsche
Resistance levels: 15810 15989 16042 (4H chart)
Support levels: 15229 14809 14458 (4H chart)
NASDAQ
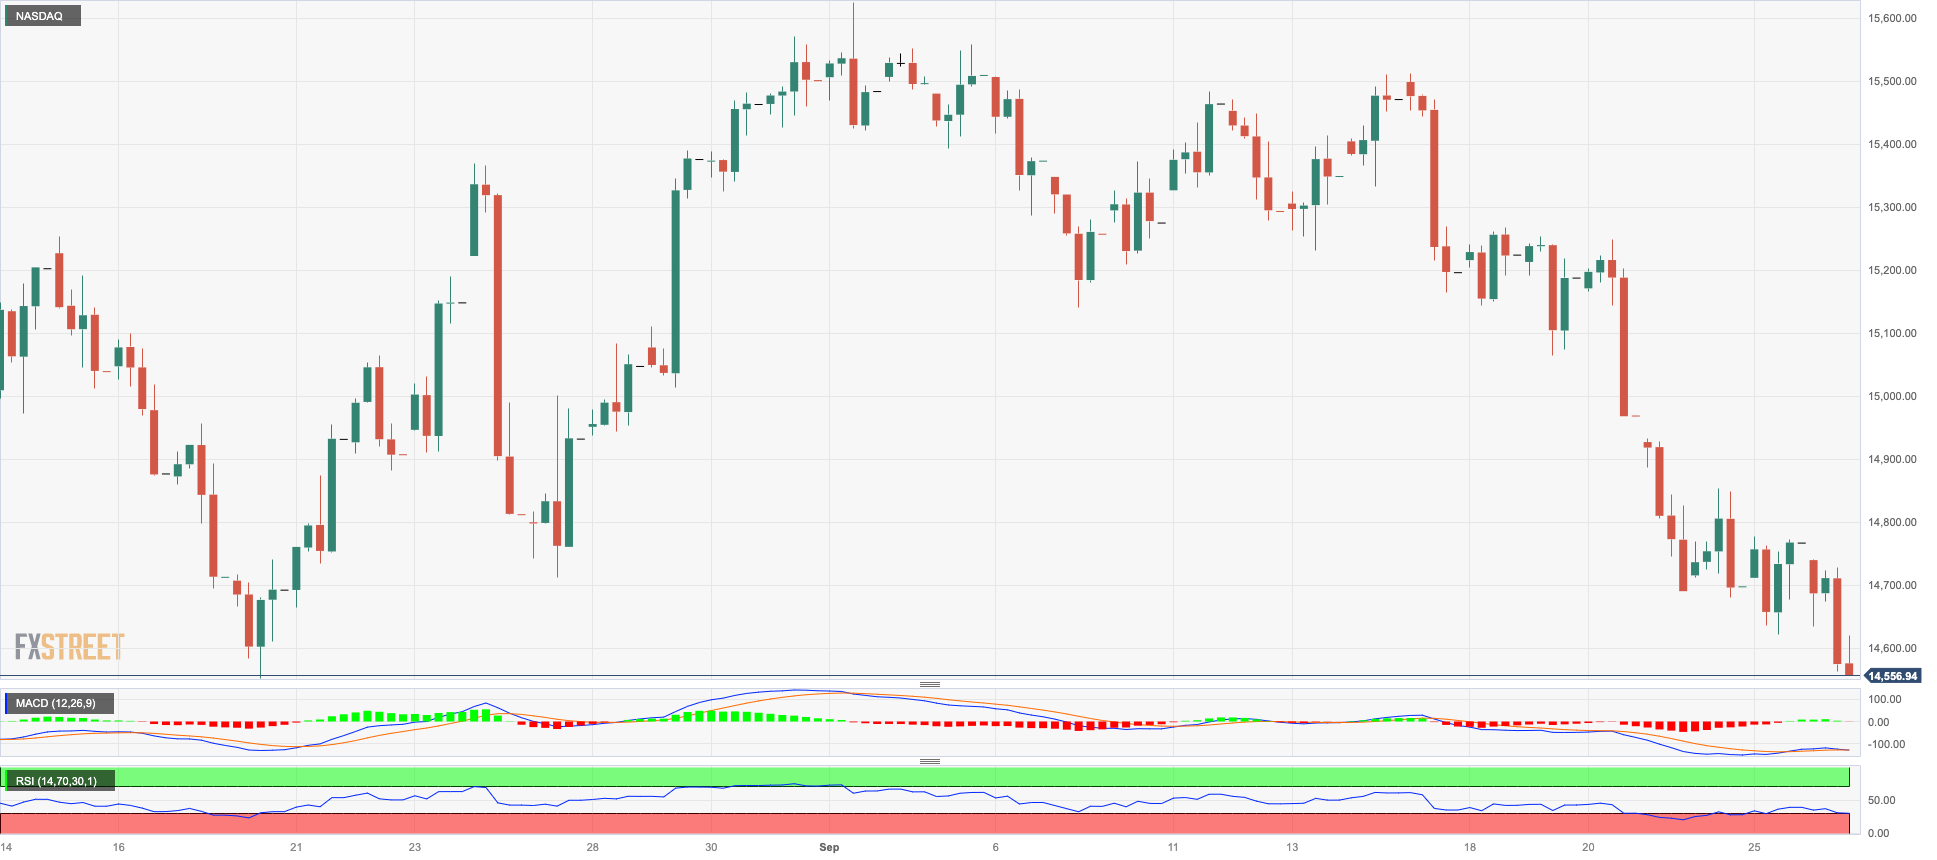
Following its US peers, the tech Nasdaq 100 edged lower and printed new three-month lows around 14500 on Tuesday.
The unabated rally in the greenback along with the equally robust march north in US yields across different maturities kept investors’ sentiment depressed, while extra downside pressure came in the form of rising jitters around the probability of a federal government shutdown as the Saturday, September 30, deadline looms closer.
Further selling pressure remained underpinned by the tighter-for-longer narrative around the Federal Reserve.
The Nasdaq 100 remains under pressure. Against that, the index may be forced to retarget the August low of 14557 (August 18) before reaching the weekly lows of 14283 (June 7) and 13520 (May 24). The loss of the latter could pave the way for a test of the important 200-day SMA around 13512. Instead, the index faces a minor up-barrier at the 55-day SMA at 15263 ahead of the weekly high of 15512 (September 14) and the September top of 15618 (September 1). Further gains from here could expose the weekly peak of 15803 (July 31) prior to the 2023 high of 15932 (July 19) and the round 16000 level. The RSI on the daily chart eased to the 35 area.
Top Gainers: Lucid Group, DexCom, Gilead
Top Losers: Cintas, Sirius XM, ON Semiconductor
Resistance levels: 15512 15618 15803 (4H chart)
Support levels: 14563 14283 13520 (4H chart)
DOW JONES
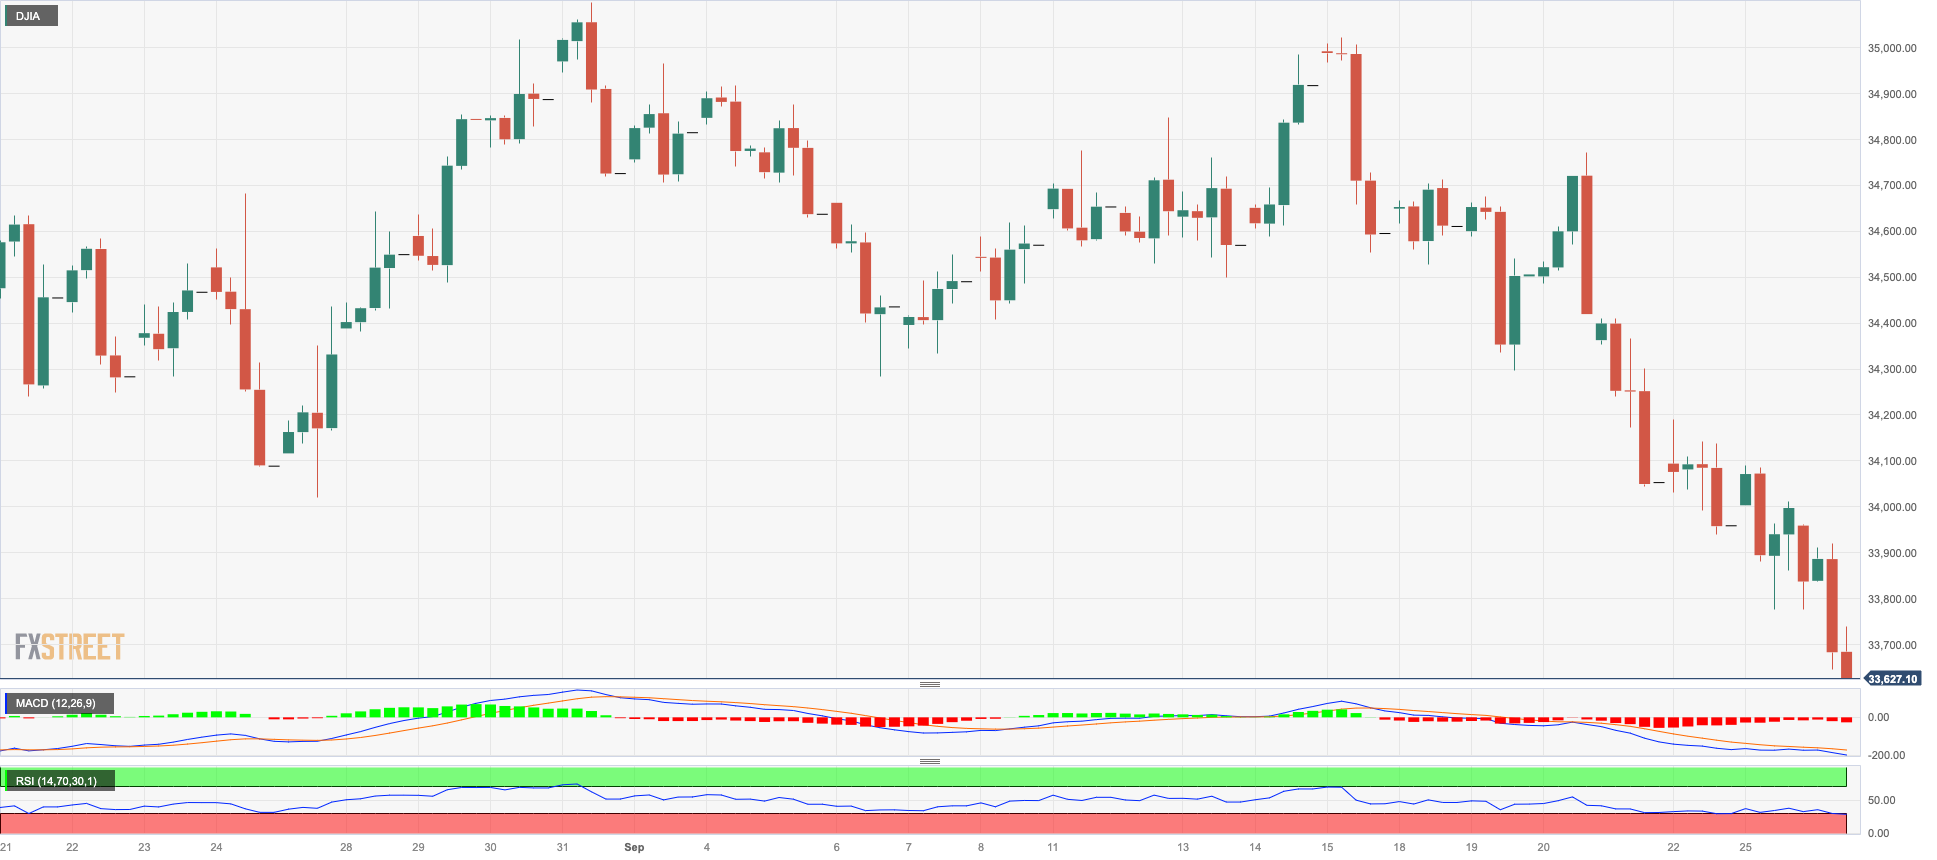
US equities measured by the Dow Jones extended the decline to new three-month lows near the 33600 region on Tuesday.
The negative performance of the index came in tandem with persistent concerns surrounding a palpable chance that the Fed might maintain its restrictive stance for a longer period, while renewed jitters surrounding a probable federal government shutdown added to the already sour mood among market participants on Tuesday.
All in all, the Dow Jones dropped 0.82% to 33726, the S&P500 retreated 1.07% to 4290, and the tech-benchmark Nasdaq Composite deflated 1.14% to 13120.
With further losses, the Dow Jones could target the September low at 33658 (September 26). Further south, the index could hit the July low at 33705 (July 10), which would be followed by the May low at 32586 (May 25) and the 2023 low at 31429 (March 15). In contrast, the September high of 34977 (September 14) appears to be the immediate hurdle to the upside before reaching the weekly top of 35070 (August 31) and the 2023 peak of 35679 (August 1). If the latter is surpassed, the 2022 high of 35824 (February 9) could become visible ahead of the all-time top of 36952 (January 5, 2022). The daily chart's RSI grinded lower to the vicinity of 31.
Top Performers: Amgen, Travelers, Merck&Co
Worst Performers: Salesforce Inc, IBM, Apple
Resistance levels: 34276 34977 35070 (4H chart)
Support levels: 33658 33610 32586 (4H chart)
MACROECONOMIC EVENTS

All Information & Updates provided by:

All information relating to the financial markets available on this page has been prepared and issued by FXStreet (Forexstreet SL, Spain, Reg: B62498233) on the basis of publicly available information and all information believed to be reliable and does not conflict with Kuwaiti local laws, and all necessary care has been taken to before the company to ensure that the facts mentioned are correct from the source.
NCM Investment nor any of its directors or employees shall in any way be held responsible for the contents of this news, and the information contained on this page is intended only to provide clients with publicly available information and should not be construed as investment advice, report or analysis and/or constitute an offer or invitation to buy or sell financial instruments of any kind.
RISK WARNING: Forex and CFDs are highly risky leveraged products, as losses can exceed deposits. Please ensure you understand all the risks and take independent advice if necessary. NCM will segregate the clients based on the criteria of the regulator and its bylaws. NCM does not provide any advisory service; the material published does not constitute advice or a recommendation for a transaction in any financial instrument. NCM accepts no responsibility for any use of the content presented and any consequences of that use. Anyone acting on the information provided does so at their own risk.