
- Contact Us:
-

-

-

-


Daily Market Updates
28 Sep 2023
USDJPY
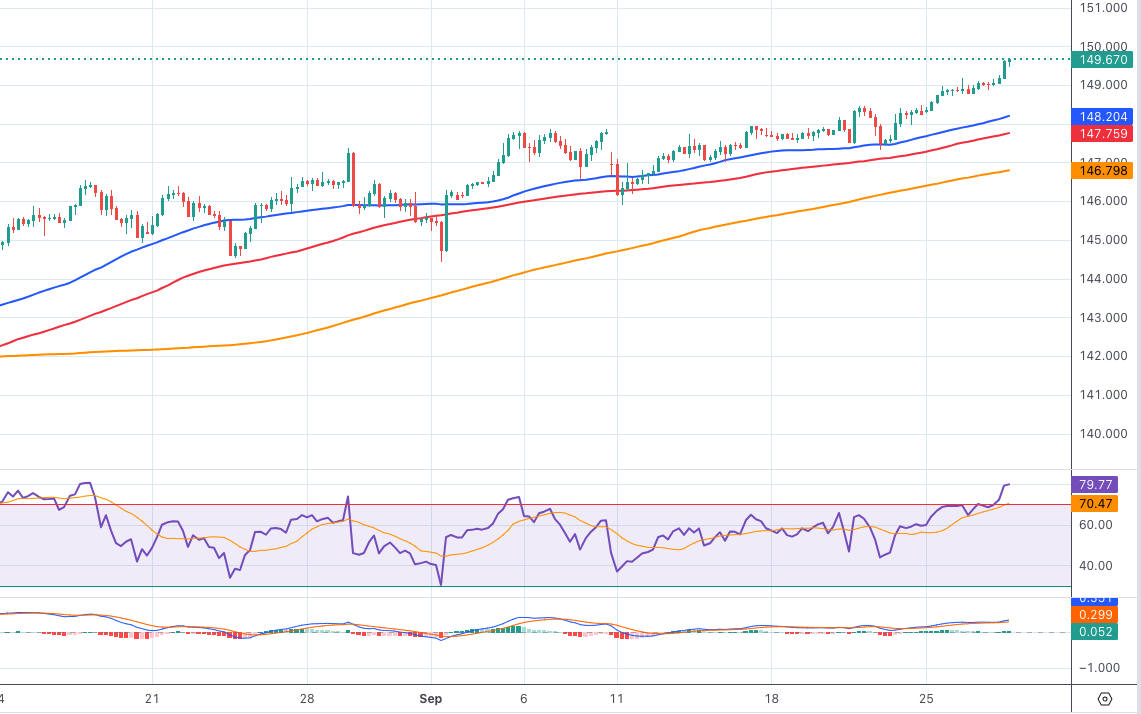
USD/JPY experienced decent gains and advanced to a new YTD high around 149.65 on Wednesday.
Indeed, spot climbed beyond the 149.00 obstacle, entering a territory that was last traded in late October 2022, propelled by the persevering upward movement of the greenback and the late recovery in US yields across various timeframes.
In the meantime, the pair managed to shrug off concerns around the possibility of the BoJ and government officials intervening in the FX markets.
On the domestic calendar, the BoJ Minutes of the July 27–28 gathering reported that certain members expressed the view that it is crucial to provide a clear explanation that adjustments to Yield Curve Control (YCC) are not indicative of a move towards withdrawing accommodation. Additionally, several members conveyed the belief that achieving the BoJ’s inflation target was still not within immediate reach.
Additionally, final readings for the month of July saw the Coincident Index at 114.2 and the Leading Economic Index at 108.2.
If the USD/JPY rises above the 2023 high of 149.69 (September 27), it could attempt a move to the round level of 150.00 prior to the 2022 top of 151.95. (October 21). On the downside, minimal support is found around the weekly low of 145.89 (September 11), which is just above the interim 55-day SMA level of 144.72. The August low of 141.50 (August 7) is south of here, ahead of the weekly low of 138.05 (July 28) and the 200-day SMA at 137.84. A drop from here could threaten the weekly low of 133.01 (April 26) and the lower levels of 132.01 (April 13) and the April low of 130.62. (April 5). The daily chart's RSI surpasses the 68 mark.
Resistance levels: 149.69 151.94 155.80 (4H chart)
Support levels: 147.32 146.74 145.89 (4H chart)
GBPUSD
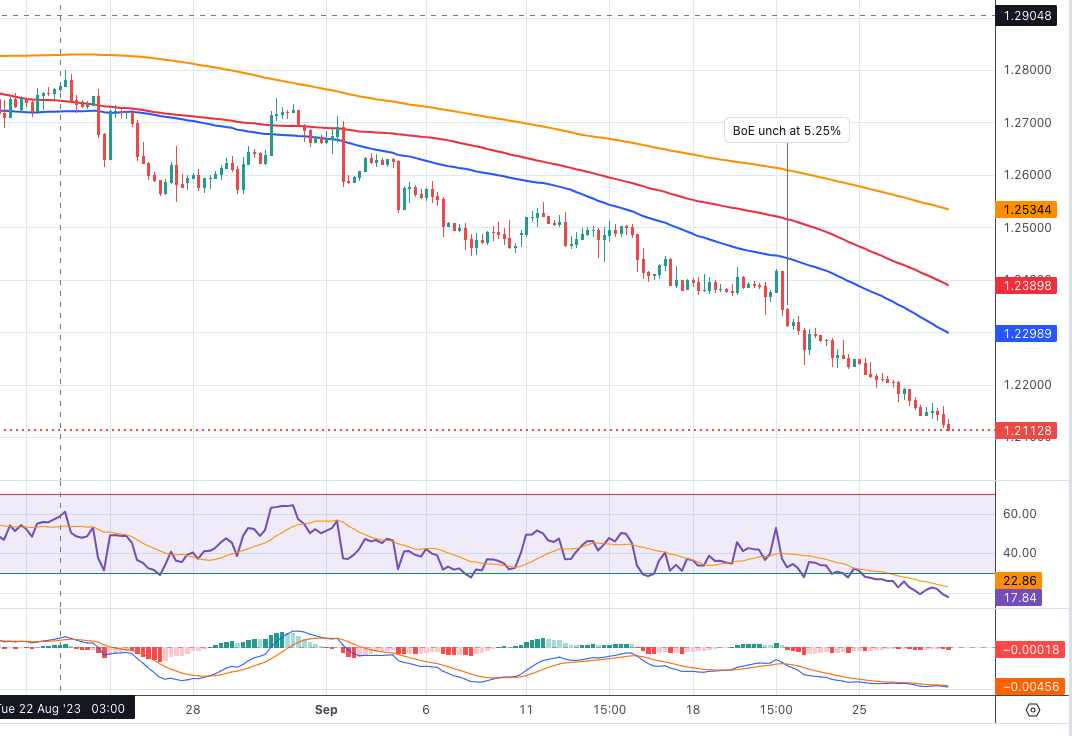
GBP/USD experienced a heightened decline as the greenback gained further strength, resulting in its sixth consecutive session of losses midweek.
In fact, the pair seems to have consolidated the recent breakdown of the key support level at 1.2200 and appears to have embarked on a potential visit to the key 1.2100 yardstick
The British pound exhibited further weakness, pushing Cable to levels last seen in mid-March near 1.2120, mostly in response to the robust momentum in the dollar and speculations that the BoE may temporarily halt its rate hikes, following the central bank's dovish stance expressed last week.
The UK docket remained empty on Wednesday.
If GBP/USD breaches the September low of 1.2116 (September 27), it might return to the key round milestone of 1.2000 before falling to the 2023 bottom of 1.1802. (March 8). Instead, the 200-day SMA at 1.2432, is the first upward obstacle followed by the minor weekly high at 1.2548 (September 11). The preliminary 100-day and 55-day SMAs are at 1.2627 and 1.2653, respectively, ahead of the weekly tops of 1.2746 (August 30), 1.2818 (August 10), and 1.2995 (July 27), all of which are above the psychological 1.3000 mark. The daily RSI moved farther into the oversold territory, breaching the 19 level.
Resistance levels: 1.2310 1.2421 1.2540 (4H chart)
Support levels: 1.2116 1.2010 1.1802 (4H chart)
AUDUSD
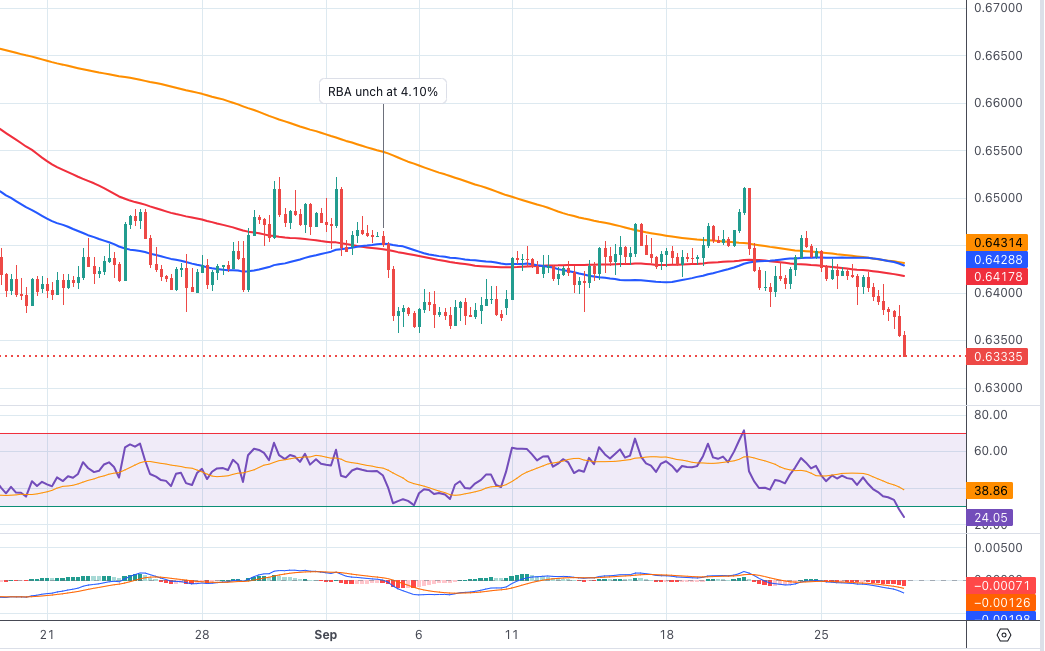
AUD/USD continued to exhibit a negative performance that was observed at the start of the week, resulting in a so-far decisive break below the significant support level at 0.6400 to print new yearly lows near 0.6330 on Wednesday.
The daily decline of the pair can be attributed, once again, to the prevailing strength of the buck amidst a widespread aversion to risk. Furthermore, the overall pessimistic sentiment in the commodity galaxy and the lack of news from China contributed to the intense weakness surrounding the Australian currency.
Data-wise Down Under, the Monthly CPI Indicator rose to 5.2% in August (from 4.9%).
The 2023 bottom at 0.6336 (September 27) comes next for the AUD/USD, followed by the November 2022 low at 0.6272 (November 7) and the 2022 low at 0.6179 (October 13). The next up-barrier, on the other hand, may be located at the weekly high of 0.6522 (August 30), ahead of another weekly top of 0.6616 (August 10) and the 200-day SMA of 0.6690. Further increases might propel the pair to its July peak of 0.6894 (July 14), slightly ahead of the June high of 0.6899 (June 16) and the important milestone of 0.7000. North from here emerges the weekly top of 0.7029 (February 14) and the 2023 peak of 0.7157 (February 2). The RSI on the daily chart dropped below 39.
Resistance levels: 0.6465 0.6511 0.6521 (4H chart)
Support levels: 0.6336 0.6272 0.6210 (4H chart)
GOLD
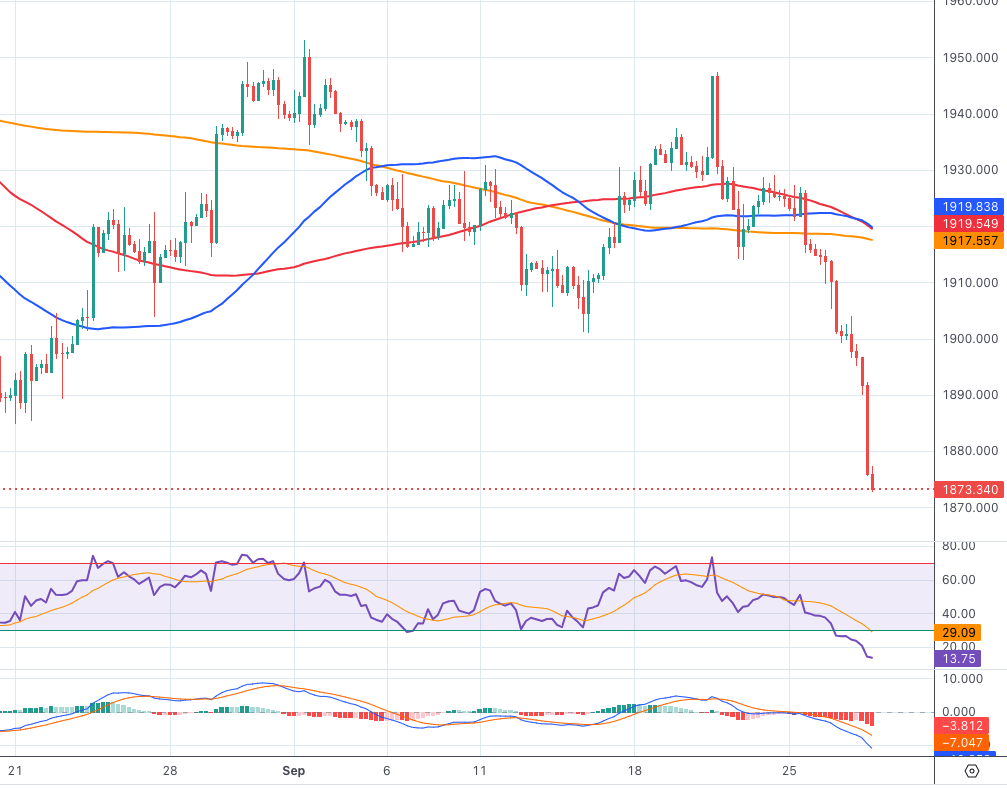
The significant upward momentum in the greenback exerted once again additional downward pressure on the precious metal, pushing it to new six-month lows in the $1875 region per troy ounce on Wednesday.
In fact, the ongoing strength of the dollar mostly sponsored the third consecutive daily pullback in bullion, while the late bounce in US yields also added to the negative price action in the yellow metal.
In the near future, there is a prevalent anticipation that the yellow metal will be closely scrutinized due to the renewed discussion about the Fed’s extended approach to tightening monetary policy. This includes the clear possibility of another quarter-point interest rate hike before the year's end.
The next downtrend for gold is the 2023 low at $1804 (February 28), just ahead of the crucial reversal zone around $1800. Instead, bulls are likely to face a first hurdle at the key 200-day SMA at $1927 prior to the weekly high of $1947 (September 20) and the September top of $1953 (September 1). If the metal breaks above this zone, it could reach the July peak of $1987 (July 20), which is just below the psychological $2000 mark. The 2023 high is $2067 (May 4), followed by the 2022 top at $2070 (March 8) and the all-time peak at $2075 (August 7, 2020).
Resistance levels: $1917 $1947 $1953 (4H chart)
Support levels: $1874 $1804 $1784 (4H chart)
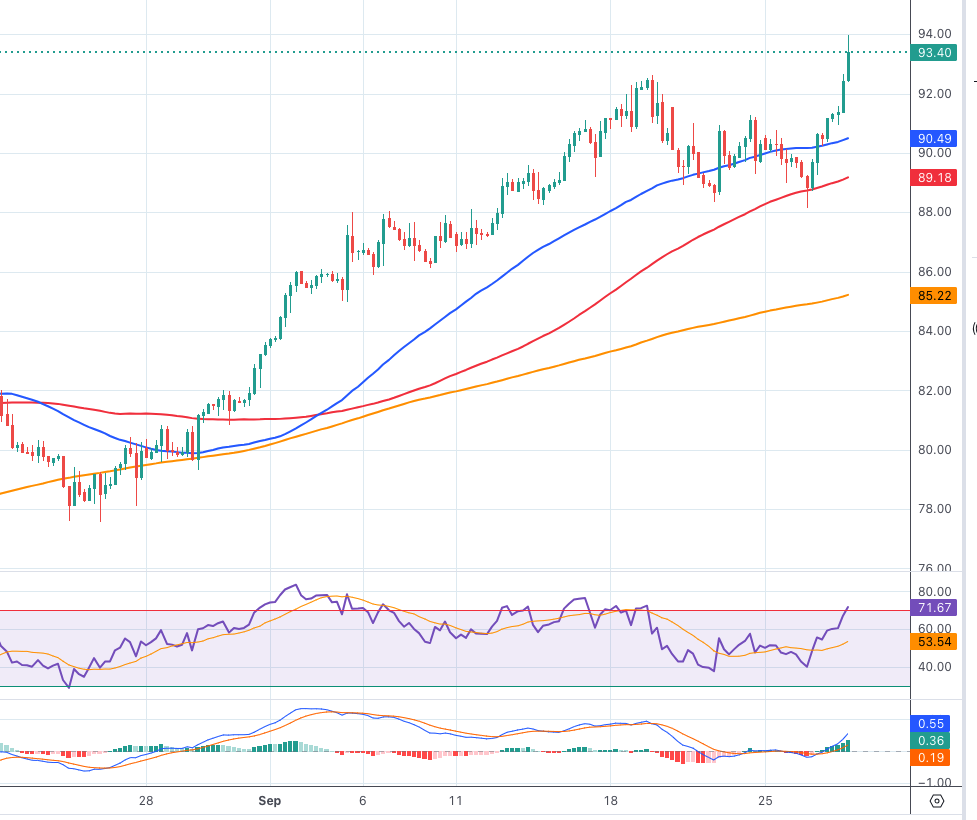
CRUDE WTI
WTI prices rose to fresh highs at levels last seen in late August 2022, just below the key $94.00 mark per barrel on Wednesday.
The fluctuations in the price of the commodity were once again driven by the ongoing narrative of restricted supply, which was further reinforced after US crude oil inventories shrank more than expected, as per the DoE’s weekly report.
On the latter, the EIA reported that US crude oil inventories dropped by 2.170M barrels in the week to September 22, while supplies at Cushing shrank by 0.943M barrels, Weekly Distillate Stocks increased by 0.398M barrels, and gasoline stockpiles went up by 1.027M barrels.
It is worth mentioning that supplies at the Cushing hub dropped to the lowest level since the summer of 2022, below 22M barrels.
Prices of WTI printed a new 2023 high at $93.99 (September 27). The surpass of this level exposes a probable move to the weekly top of $97.65 (August 30, 2022), all ahead of the psychological 100.00 mark per barrel mark. In contrast, the weekly low of $88.24 (September 26) emerges as the immediate contention prior to the temporary 55-day SMA at $83.10. Down from here comes the August low of $77.64 (August 24) ahead of the important 200-day line SMA at $77.15 and the weekly low at $73.89 (July 17). The loss of this level could put the June low at $66.85 (June 12) back on the radar prior to the 2023 low of $63.61 (May 4).
Resistance levels: $93.99 $97.65 $101.87 (4H chart)
Support levels: $88.16 $86.12 $84.99 (4H chart)
GER40
European markets extended the weakness and closed in a “sea of red” on Wednesday.
Against that, Germany’s benchmark DAX40 slipped back to new six-month lows around 15200, down for the fifth consecutive session at the same time.
The prevailing risk-averse atmosphere, driven by the possibility of the Fed maintaining its restrictive approach for an extended period as well as concerns about a potential economic downturn in the region and the US, kept buyers at bay and contributed further to the already sour mood among market participants.
Adding to the overall pessimism, crude oil prices continued their rally, fueling further inflation jitters, while worries regarding the Chinese economic recovery persisted for yet another day.
The continuation of the selling momentum may cause the DAX40 to retarget the March low of 14458 (20 March) before reaching the December 2022 low of 13791 (December 20) and the 2022 low of 11862 (September 28). On the upside, the first barrier seems to be the 200-day SMA at 15563 before the September high of 15989 (September 14) and followed by the weekly highs of 16042 (August 31) and 16060 (August 10). If the index falls below this level, investors' attention could be drawn to a possible visit to the all-time high of 16528 (July 31). The RSI on a daily basis grinded lower to the 31 region.
Best Performers: Siemens AG, Deutsche Bank AG, MTU Aero
Worst Performers: Fresenius SE, Daimler Truck Holding, Vonovia
Resistance levels: 15665 15810 15989 (4H chart)
Support levels: 15194 14809 14458 (4H chart)

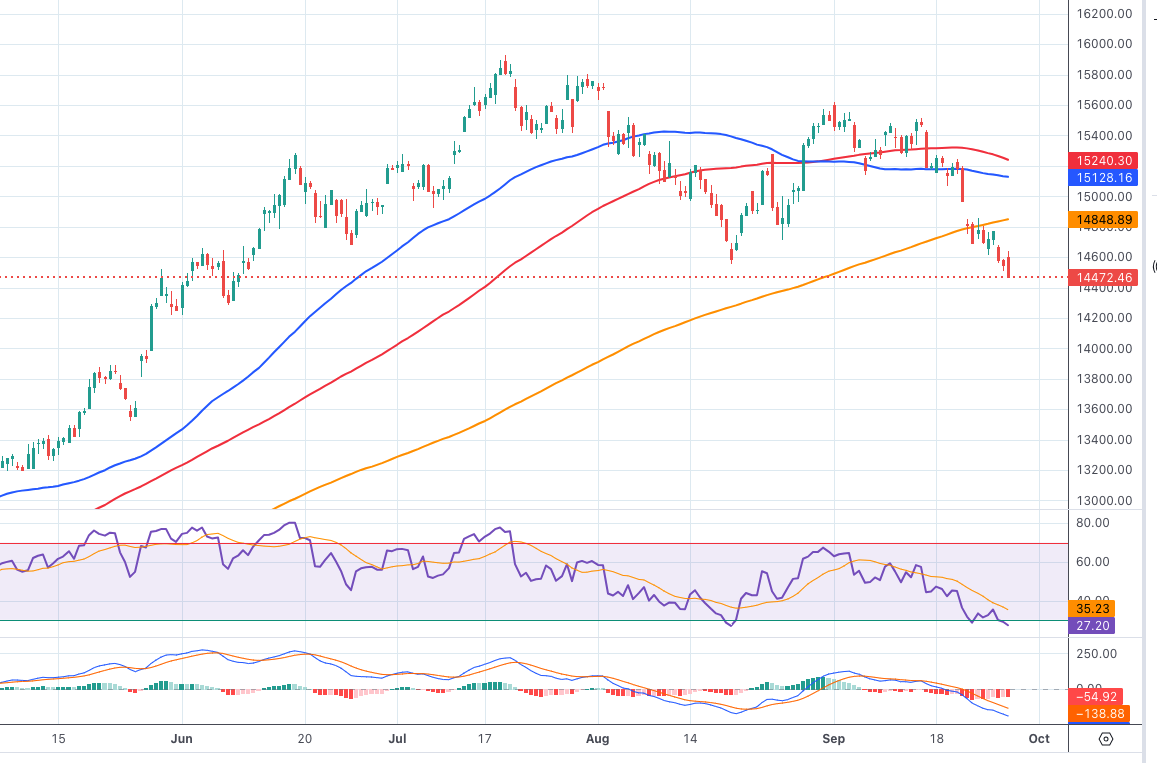
NASDAQ
Once again, and following in the footsteps of its US peers, the tech reference Nasdaq 100 added to Tuesday’s losses and set new three-month lows just below the 14500 yardstick on Wednesday.
The unabated rally in the US dollar, combined with the late rebound in US yields across various maturities, kept investors’ mood under pressure, while another source of weakness came from growing jitters about the possibility of a federal government shutdown.
In addition, recession concerns seem to have been reignited in response to firmer market expectations of further tightening by the Fed before the end of the year.
Extra pullbacks could see the Nasdaq 100 revisiting the weekly low of 14283 (June 7) prior to the 200-day SMA at 13526 and the April low of 12724 (April 25). Once this region is cleared, the index could test the March low of 11695 (March 13) ahead of the 2023 low at 10696 (January 6). Having said that, the index confronts a small uphill challenge at the transitory 55-day SMA of 15251, before the weekly high of 15512 (September 14) and the September top of 15618 (September 1). Further increases from here might take us to the weekly peak of 15803 (July 31) ahead of the 2023 high of 15932 (July 19) and the round 16000 mark. On the daily chart, the RSI retreated to the proximity of 33.
Top Gainers: Paychex, Diamondback, Atlassian Corp Plc
Top Losers: PayPal Holdings Inc, Tesla, Zoom Video
Resistance levels: 14849 15512 15618 (4H chart)
Support levels: 14485 14283 13520 (4H chart)
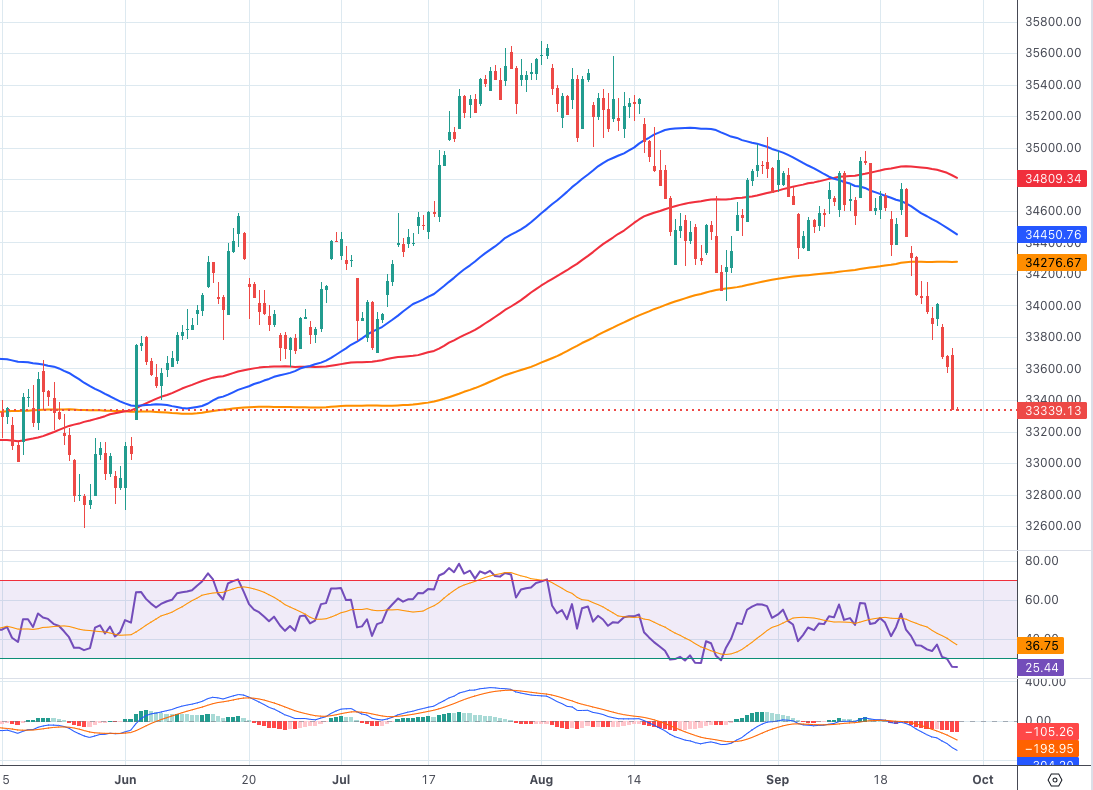
DOW JONES
Further downside pressure saw US stocks tracked by the Dow Jones drop to new three-month lows in the 33400 region on Wednesday.
The index's downward trend was in line with ongoing worries that the Fed might continue its cautious approach for an extended period of time. Additionally, renewed anxiety about a potential government shutdown at the federal level further exacerbated the already gloomy sentiment among market participants on Wednesday.
In addition, the rally in crude oil prices remains a source of concern regarding inflation, while recession concerns appear to have returned to the fore.
All in all, the Dow Jones deflated 0.38% to 33490, the S&P500 dropped 0.24% to 4263, and the tech-focused Nasdaq Composite retreated 0.21% to 13039.
If the Dow Jones continues to fall, it might reach the July low of 33705 (July 10), followed by the May low of 32586 (May 25) and the 2023 low of 31429 (March 15). On the contrary, the September high of 34977 (September 14) looks to be the immediate upward barrier before reaching the weekly top of 35070 (August 31) and the 2023 peak of 35679 (August 1). If the latter is exceeded, the 2022 high of 35824 (February 9) may become visible before the all-time high of 36952 (January 5, 2022). The everyday RSI breached the 30 threshold and entered the oversold zone.
Top Performers: Chevron, Intel, Caterpillar
Worst Performers: J&J, Walgreen Boots, Verizon
Resistance levels: 34276 34977 35070 (4H chart)
Support levels: 33420 32586 31805 (4H chart)
MACROECONOMIC EVENTS

All Information & Updates provided by:

All information relating to the financial markets available on this page has been prepared and issued by FXStreet (Forexstreet SL, Spain, Reg: B62498233) on the basis of publicly available information and all information believed to be reliable and does not conflict with Kuwaiti local laws, and all necessary care has been taken to before the company to ensure that the facts mentioned are correct from the source.
NCM Investment nor any of its directors or employees shall in any way be held responsible for the contents of this news, and the information contained on this page is intended only to provide clients with publicly available information and should not be construed as investment advice, report or analysis and/or constitute an offer or invitation to buy or sell financial instruments of any kind.
RISK WARNING: Forex and CFDs are highly risky leveraged products, as losses can exceed deposits. Please ensure you understand all the risks and take independent advice if necessary. NCM will segregate the clients based on the criteria of the regulator and its bylaws. NCM does not provide any advisory service; the material published does not constitute advice or a recommendation for a transaction in any financial instrument. NCM accepts no responsibility for any use of the content presented and any consequences of that use. Anyone acting on the information provided does so at their own risk.