
- Contact Us:
-

-

-

-


Daily Market Updates
29 Sep 2023
USDJPY
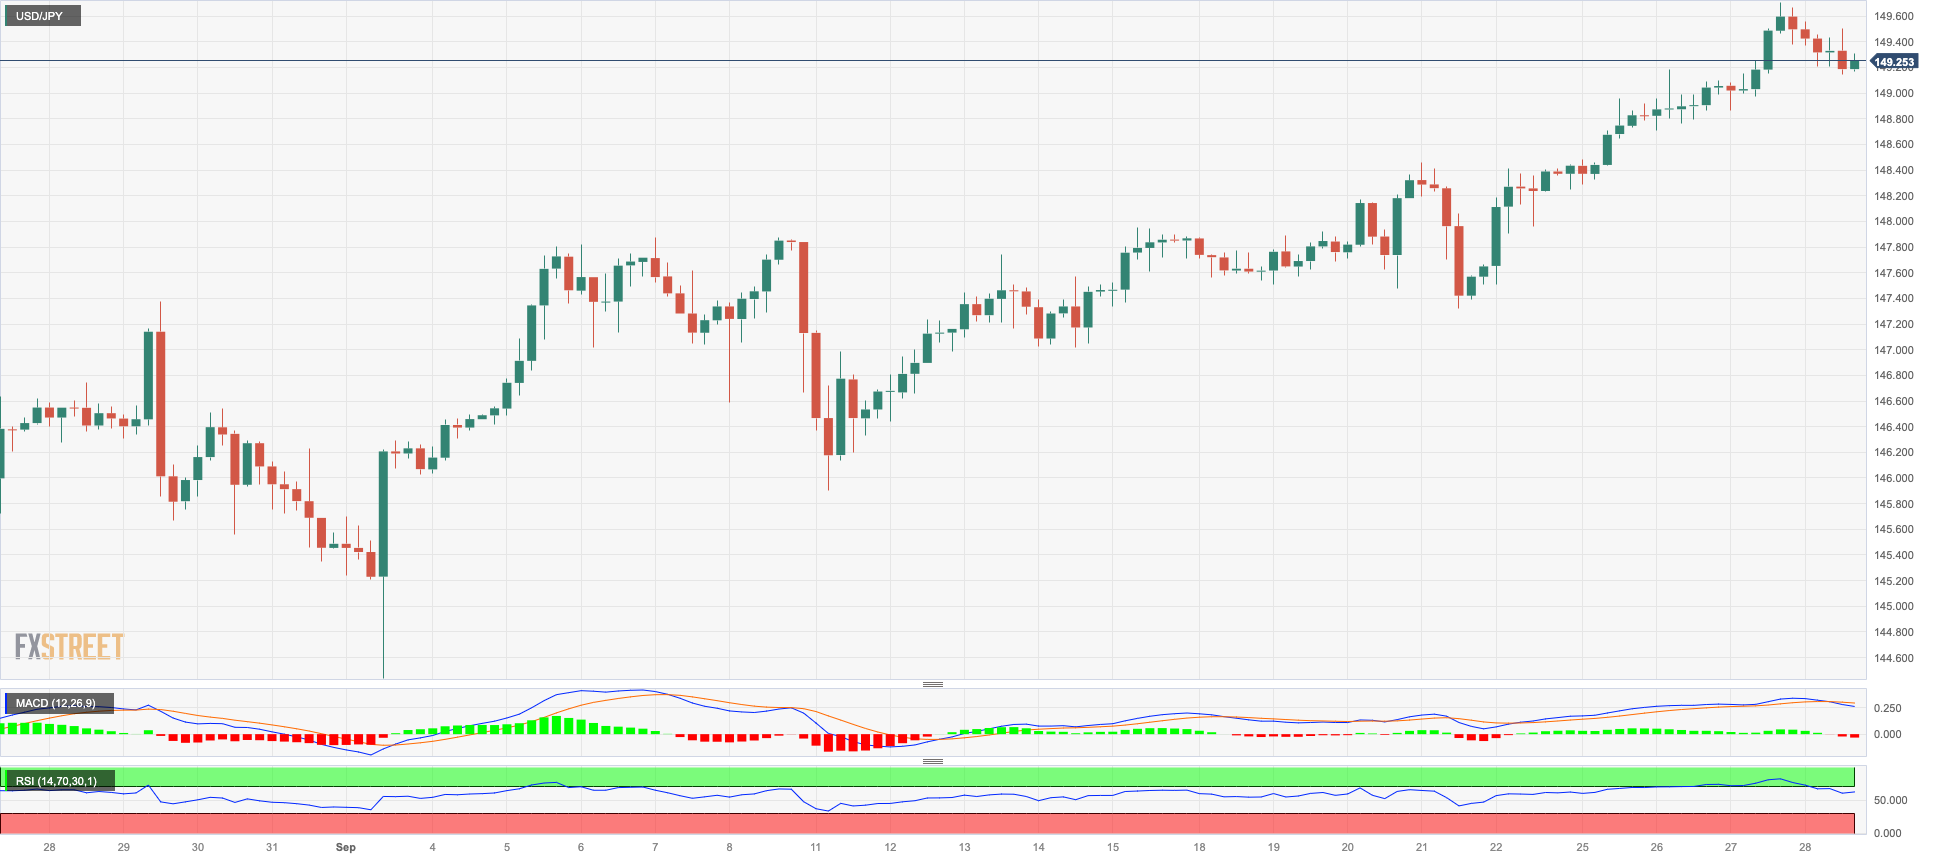
USD/JPY returned to negative territory following another move to the area of Wednesday’s 2023 highs in the 149.60/70 band on Thursday.
That said, the pair halted a four-day positive streak in response to the strong decline in the greenback and mixed performance of US yields, while the Japanese JGB 10-year yields climbed to new highs near 0.80%.
The yen also derived extra strength in response to the likelihood of the BoJ and government officials intervening in the FX markets, particularly as spot gets closer to the 150.00 hurdle.
In Japan, Foreign Bond Investment shrank by ¥544.4b in the week to September 23.
If the USD/JPY goes over the 2023 high of 149.70 (September 27), it may try a move to the round level of 150.00 before the 2022 top of 151.95 (October 21). On the downside, the weekly low of 145.89 (September 11), comes ahead of the intermediate 55-day SMA level of 144.93. The August low of 141.50 (August 7) is south of here, before the weekly low of 138.05 (July 28) and the 200-day SMA of 137.93. The loss of the latter might threaten the weekly low of 133.01 (April 26), as well as the lower levels of 132.01 (April 13) and April low of 130.62 (April 5). The day-to-day RSI deflated to the sub-65 zone.
Resistance levels: 149.70 151.94 155.80 (4H chart)
Support levels: 148.36 147.32 146.90 (4H chart)
GBPUSD
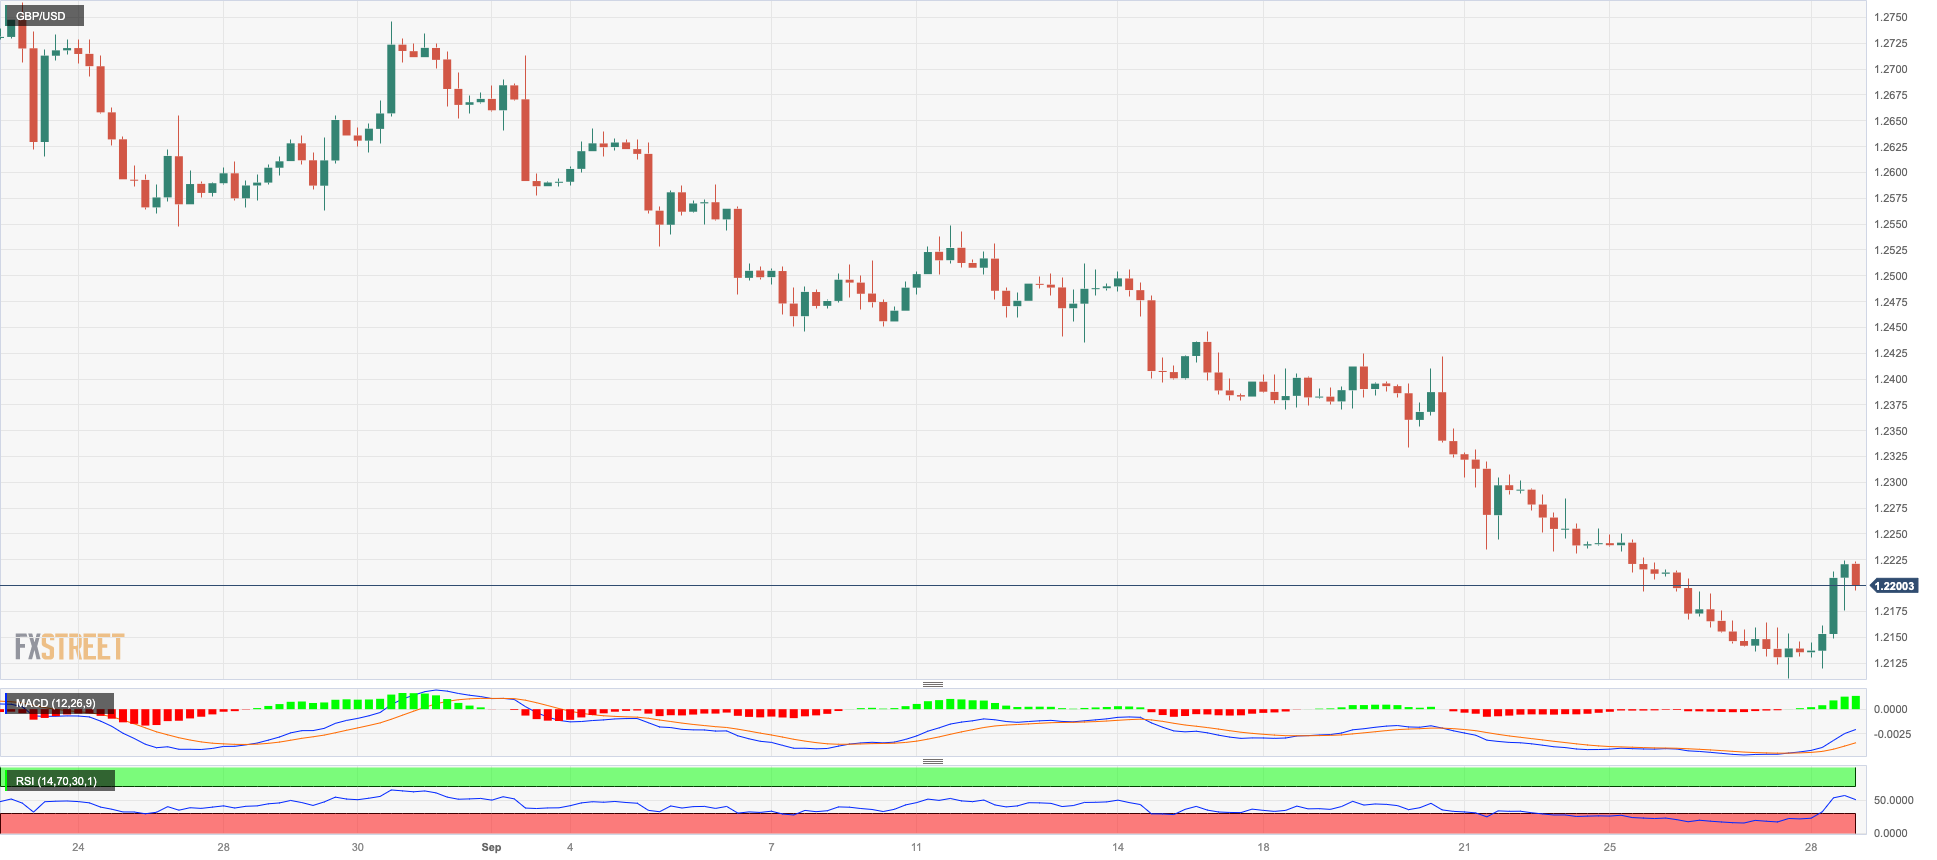
The renewed and marked selling pressure around the greenback finally allowed some breathing space for the risk-associated universe on Thursday.
Against that, GBP/USD printed noticeable gains and managed to regain the key 1.2200 hurdle after six consecutive sessions of losses. The mover higher in Cable was accompanied by a sharp uptick in UK 10-year gilt yields to monthly tops past 4.55%.
On another front, the BoE announced it has started to work on a programme that would allow the central bank to provide direct loans to insurance companies and pension funds.
In the UK, Car Production contracted at an annualized 9.7% during August.
If GBP/USD breaks the September low of 1.2110 (September 27), it could return to the key round milestone of 1.2000 before falling to the 2023 low of 1.1802 (March 8). Instead, the 200-day SMA at 1.2433 is the first hurdle to the upside, followed by the minor weekly high at 1.2548 (September 11). The preliminary 100-day and 55-day SMAs are at 1.2624 and 1.2636 respectively, ahead of the weekly tops of 1.2746 (August 30), 1.2818 (August 10) and 1.2995 (July 27), all above the psychological 1.3000 level. The RSI on the daily chart leapt past the 28 barrier, still in the oversold territory.
Resistance levels: 1.2223 1.2421 1.2521 (4H chart)
Support levels: 1.2110 1.2010 1.1802 (4H chart)
AUDUSD
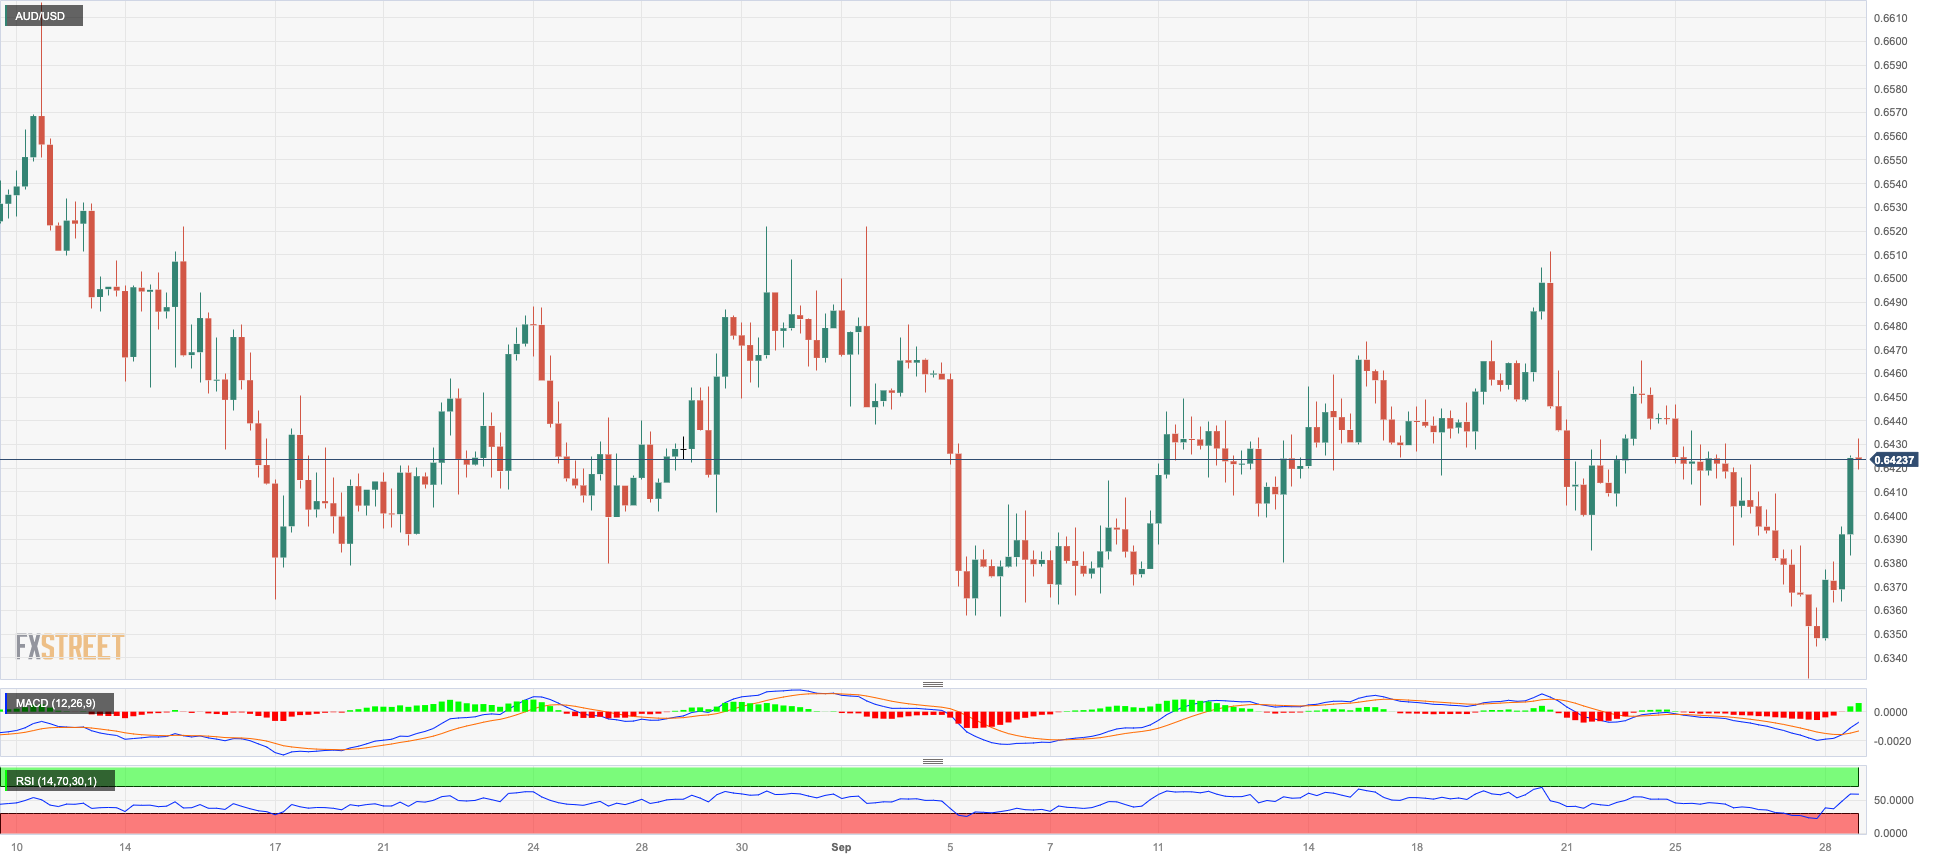
In line with its risky peers, the Aussie dollar set aside part of the intense weekly weakness and printed a marked rebound vs. the greenback on Thursday.
That said, AUD/USD reclaimed the area beyond 0.6400 the figure also helped by the broad-based positive session in the commodity complex.
In the Australian docket, flash Retail Sales are seen expanding at a monthly 0.2% in August.
The 2023 low at 0.6331 (September 27) emerges as the immediate contention for AUD/USD, followed by the November 2022 low at 0.6272 (November 7) and the 2022 low at 0.6179 (October 13). The next upside barrier, on the other hand, aligns at the weekly high of 0.6522 (August 30), ahead of another weekly top of 0.6616 (August 10) and the 200-day SMA of 0.6689. Further rises could take the pair to its July peak of 0.6894 (July 14), just ahead of the June high of 0.6899 (June 16) and the important milestone of 0.7000, north of which is the weekly high of 0.7029 (February 14) and the 2023 top of 0.7157 (February 2). The RSI on the daily chart climbed to the boundaries of 48.
Resistance levels: 0.6432 0.6465 0.6511 (4H chart)
Support levels: 0.6331 0.6272 0.6210 (4H chart)
GOLD
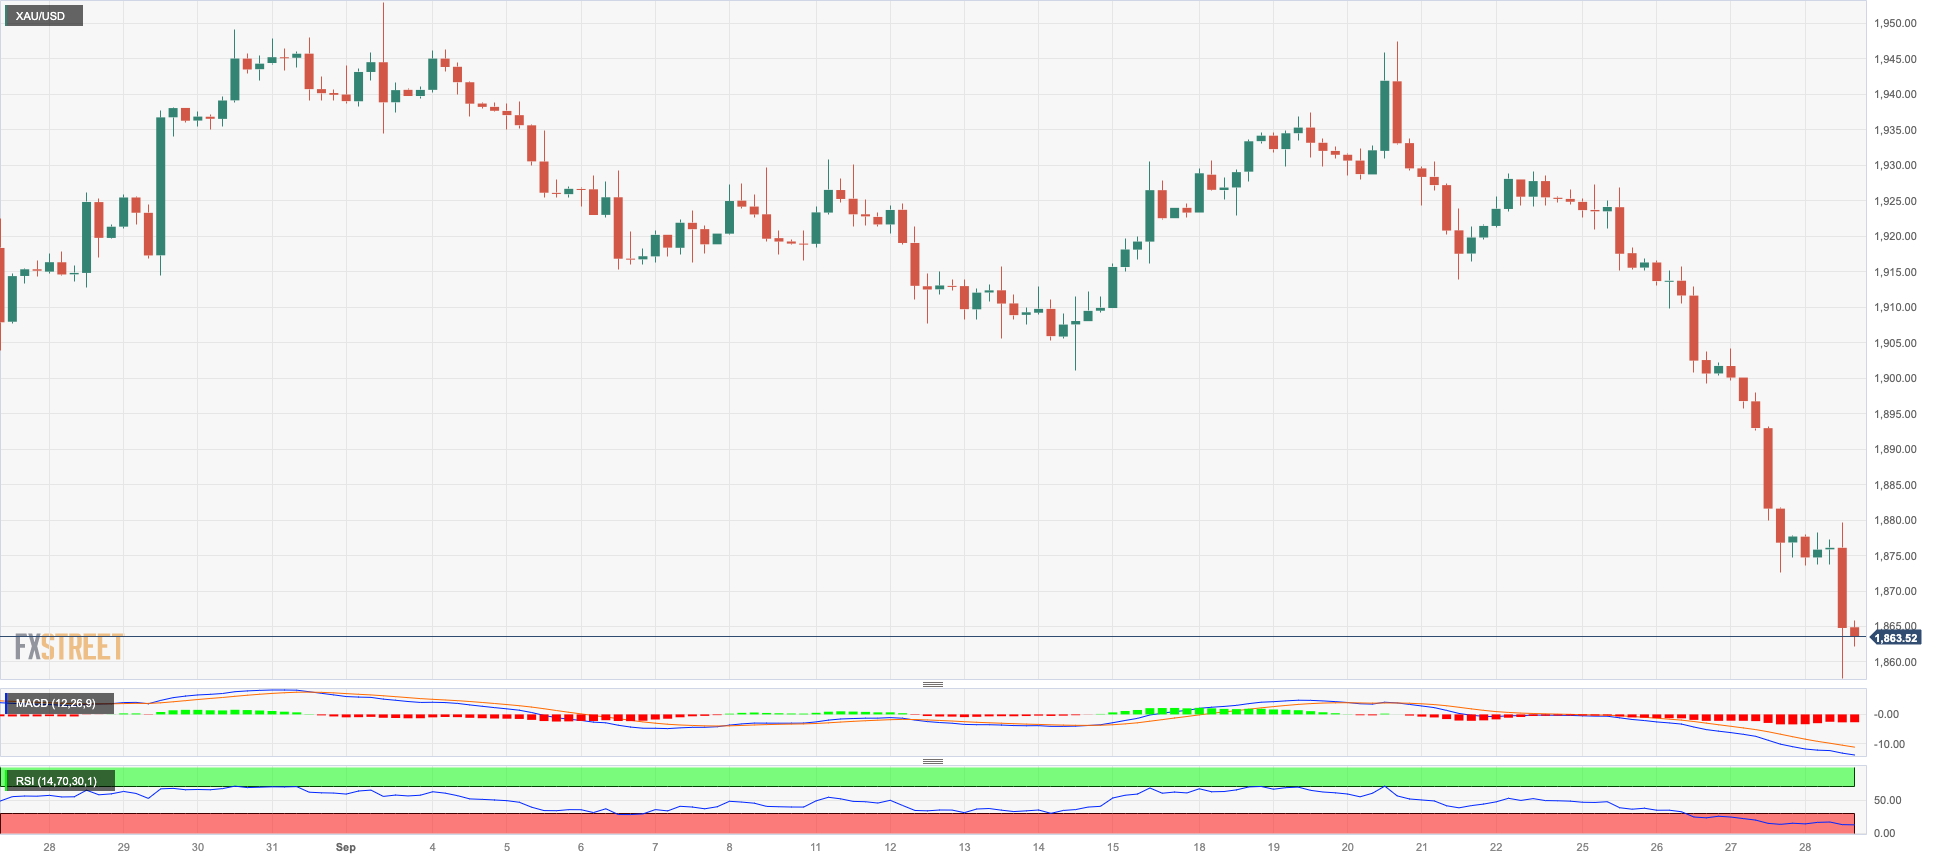
Gold prices extended further its downward bias and revisited levels last traded in early March near $1855 per troy ounce.
The fourth consecutive daily drop in the precious metal came despite the pronounced decline in the greenback and the loss of momentum in US yields across different maturities.
In the coming days, there is widespread expectation that there will be increased scrutiny of the price movements of gold. This is due to the renewed discussion surrounding the Fed’s approach to tightening monetary policy. There is a clear possibility that another 25 bps interest rate hike may occur before the end of the year.
The 2023 low at $1804 (February 28) is the next target for gold bears, just ahead of the critical turnaround zone at $1800. Having said that, occasional bullish attempt should meet initial resistance at the important 200-day SMA of $1927 before reaching the weekly high of $1947 (September 20) and the September top of $1953 (September 1). If the metal breaks above this zone, it might hit the July peak of $1987 (July 20), which is just below the psychological $2000 level. The 2023 high is $2067 (May 4), ahead of the top in 2022 at $2070 (March 8) and the all-time peak at $2075. (August 7, 2020).
Resistance levels: $1916 $1947 $1953 (4H chart)
Support levels: $1857 $1804 $1784 (4H chart)
CRUDE WTI
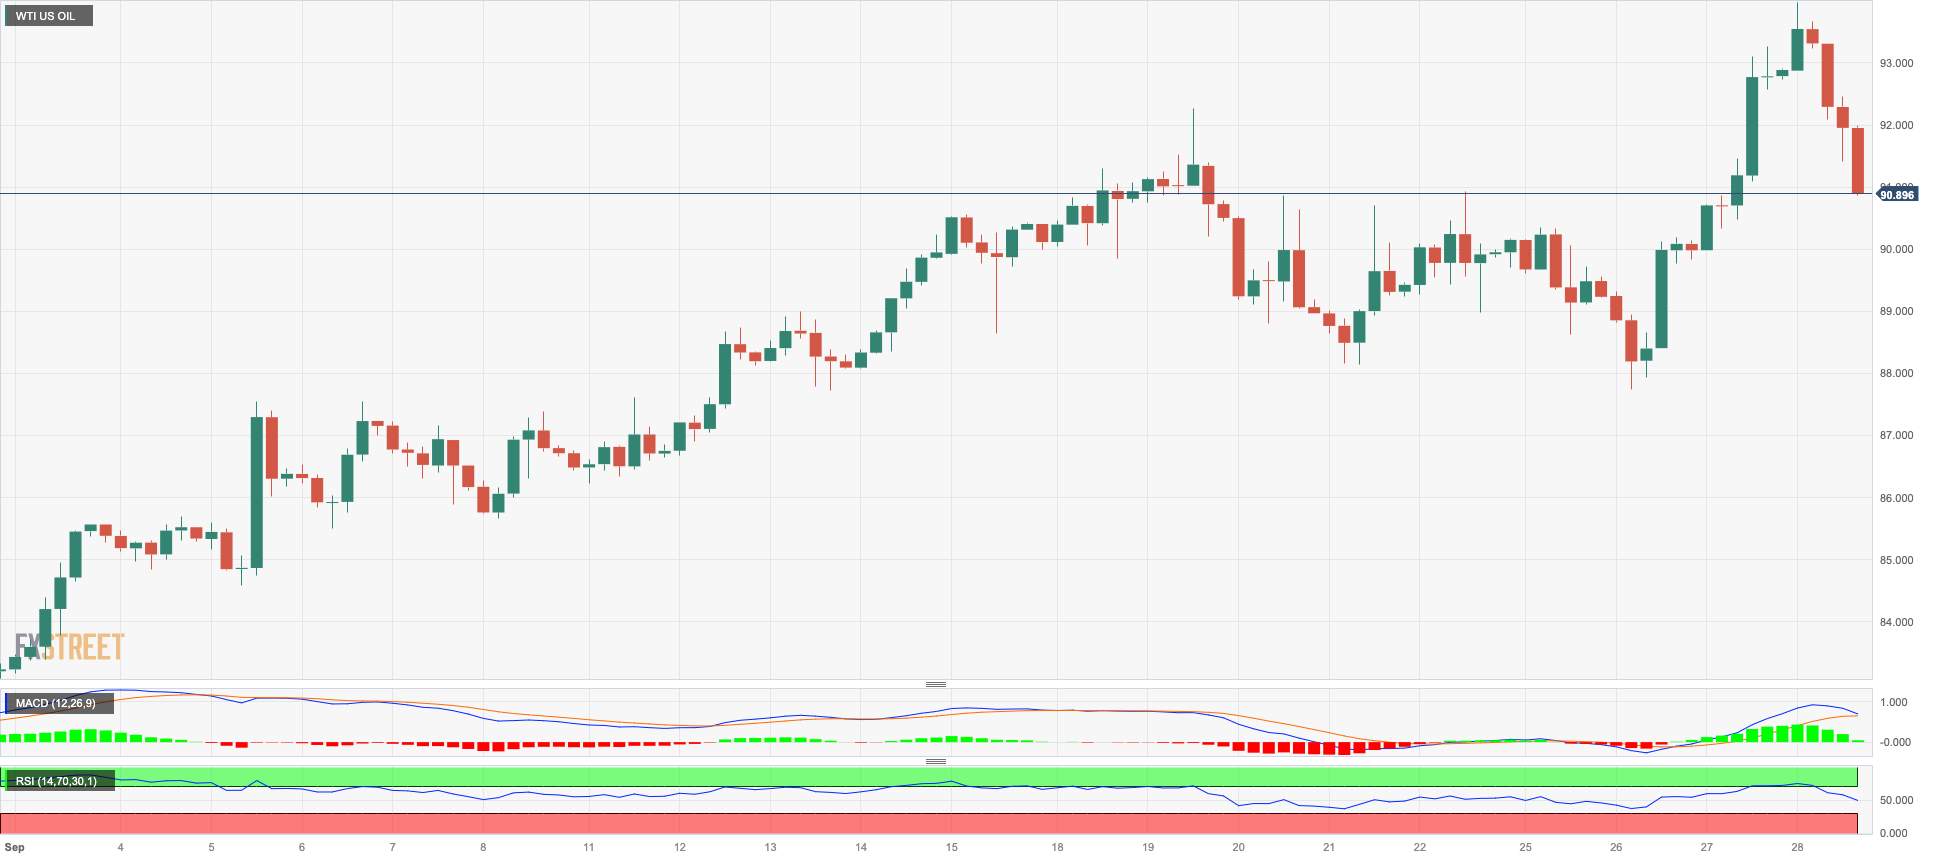
Prices of the WTI could not sustain the earlier move to new 2023 peaks in the $95.00 region per barrel, triggering a subsequent corrective move to the sub-$93.00 zone on Thursday.
Thursday’s knee-jerk in the commodity followed a broad-based profit-taking mood among traders, all in light of the recent intense gains.
In addition, concerns regarding the impact of higher crude oil prices on inflation and, hence, on the central banks’ decisions on monetary policy (interest rates) appear to have started to emerge and could represent a firm headwind for the continuation of the rally in the commodity.
WTI prices recorded a new 2023 high of $94.99 on September 28. If this level is cleared, a possible advance to the weekly top of $97.65 (August 30, 2022) is shown, all ahead of the psychological 100.00 mark per barrel. In contrast, the weekly low of $88.24 (September 26) stands in the way of the temporary 55-day SMA at $83.38. The August low of $77.64 (August 24) comes next and aligns just ahead of the crucial 200-day SMA at $77.23 and the weekly low at $73.89 (July 17). The loss of this region exposes the June low of $66.85 (June 12) before the 2023 low of $63.61 (May 4).
Resistance levels: $94.99 $97.65 $101.87 (4H chart)
Support levels: $92.25 $88.16 $86.12 (4H chart)
GER40
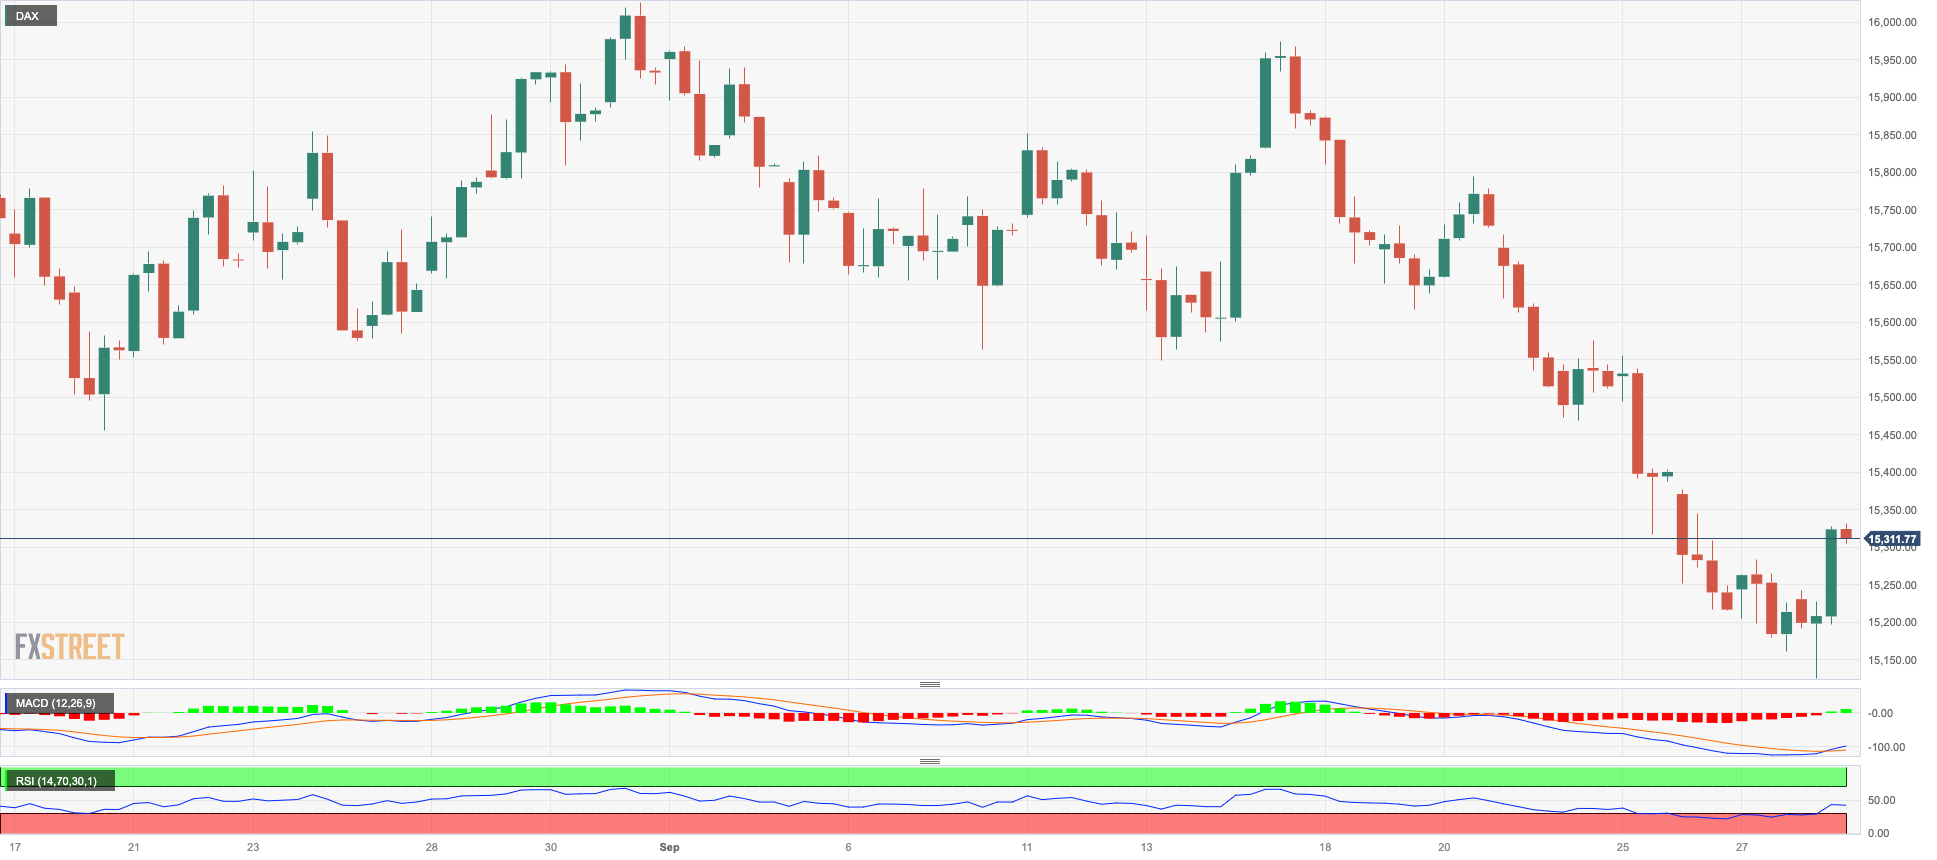
Germany’s stock benchmark DAX40 left behind five consecutive sessions of losses and charted a decent rebound on Thursday.
Indeed, optimism appears to have returned to the markets following lower-than-expected advanced inflation figures in Germany, which in turn reinforces the perception of a potential impasse by the ECB of its tightening campaign.
However, cautiousness is expected to remain high in light of the persistent rally in crude oil prices as well as the firm conviction that the Federal Reserve might extend its restrictive stance for longer.
In the German money markets, the 10-year bund yields rose further and faltered just ahead of the key 3.00% threshold.
If the selling momentum continues, the DAX40 may retarget the March low of 14458 (March 20) before the December 2022 low of 13791 (December 20) and the 2022 low of 11862 September 28). On the upside, the 200-day SMA at 15571 appears to be the first obstacle before the September high of 15989 (September 14), followed by weekly tops of 16042 (August 31) and 16060 (August 10). If the index goes beyond this level, investors' attention may be directed to the all-time peak of 16528 (July 31). On a daily basis, the RSI advanced to the proximity of 37.
Best Performers: MTU Aero, Heidelbergcement, Continental AG
Worst Performers: Zalando SE, E.ON SE, Vonovia
Resistance levels: 15634 15810 15989 (4H chart)
Support levels: 15138 14809 14458 (4H chart)
NASDAQ
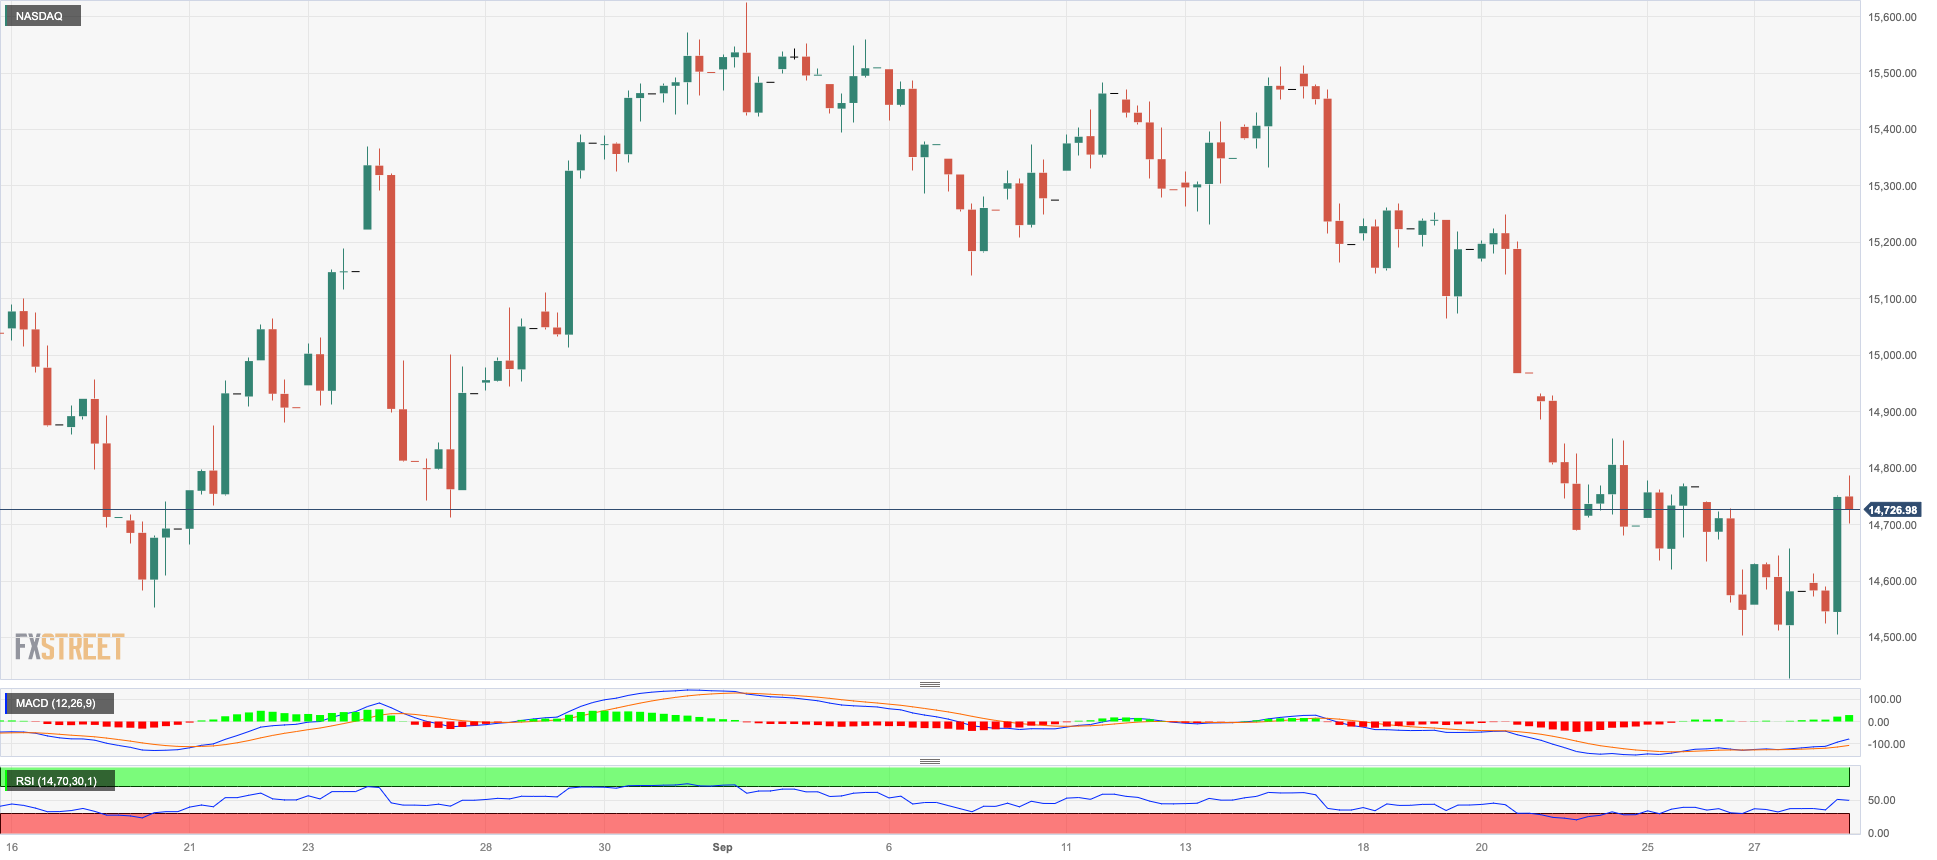
The tech sector extended Wednesday’s gains and lifted the Nasdaq 100 to four-day highs around the 14800 region on Thursday.
The renewed weakness hitting the greenback, mixed US yields across the curve, and optimism around a potential positive outcome from the talks surrounding the federal shutdown propped up the upside bias among tech equities on Thursday.
Extra recovery could put the Nasdaq 100 en route to the transitory 55-day SMA at 15242, prior to the weekly high of 15512 (September 14) and the September top of 15618 (September 1). Further rises from here could take the index to the weekly peak of 15803 (July 31) ahead of the 2023 high of 15932 (July 19) and the round 16000 mark. Just the opposite, a drop below the September low of 14432 (September 27) could retarget the weekly low of 14283 (June 7) ahead of the 200-day SMA at 13542 and the April low of 12724 (April 25). Once this region is breached, the index could test the March low of 11695 (March 13) ahead of the 2023 low of 10696 (January 6). On the daily chart, the RSI bounced further and flirted with 41.
Top Gainers: Sirius XM, AMD, The Trade Desk
Top Losers: Workday, Micron, JD.com Inc Adr
Resistance levels: 14865 15512 15618 (4H chart)
Support levels: 14432 14283 13520 (4H chart)
DOW JONES
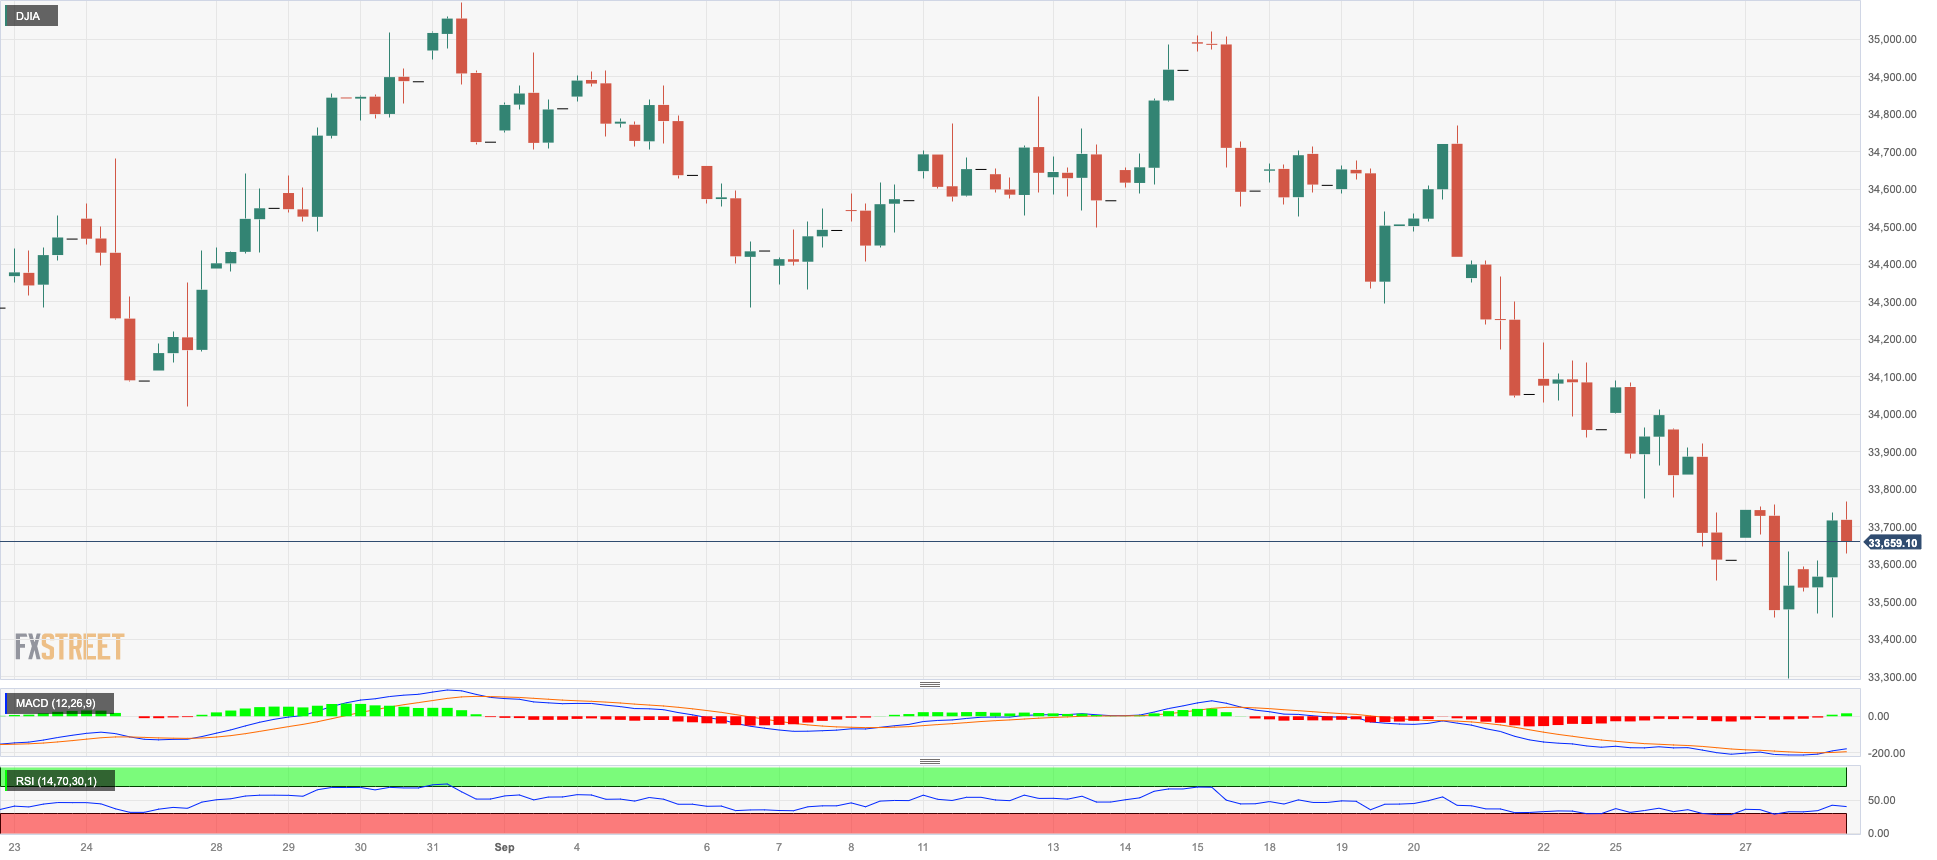
US equities managed to leave behind two consecutive daily declines and rose to two-day highs when measured by the reference Dow Jones on Thursday.
The broad-based optimism among investors was further bolstered by positive results from the final revision of the US GDP for the April–June period, as well as by positive news that a federal government shutdown could be averted.
In addition, the renewed selling pressure around the dollar and the prevailing appetite for the risk complex lent extra legs to the Dow’s recovery.
Overall, the Dow Jones gained 0.58% to 33745, the S&P500 rose 0.85% to 4310, and the tech-heavy Nasdaq Composite advanced 1.18% to 13247.
The resumption of the selling bias could drag the Dow Jones to revisit the September low of 33306 (September 27) ahead of the May low of 32586 (May 25) and the 2023 low of 31429 (March 15). On the contrary, the September high of 34977 (September 14) seems to be the immediate upside barrier before reaching the weekly top of 35070 (August 31) and the 2023 peak of 35679 (August 1). If the latter is exceeded, the 2022 high of 35824 (February 9) could become visible before the all-time top of 36952 (January 5, 2022) is reached. The everyday RSI bounced to the vicinity of 35.
Top Performers: Intel, Cisco, JPMorgan
Worst Performers: IBM, Boeing, Procter&Gamble
Resistance levels: 34280 34977 35070 (4H chart)
Support levels: 33306 32586 31805 (4H chart)
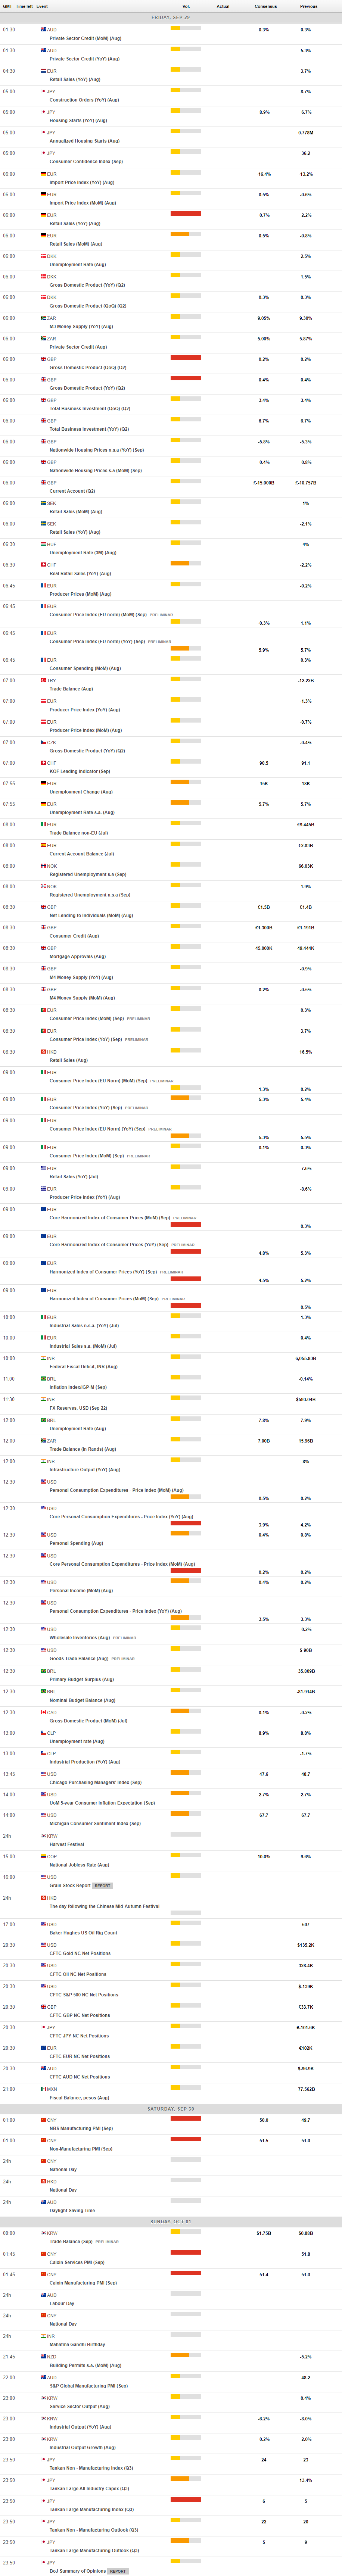
MACROECONOMIC EVENTS
All Information & Updates provided by:

All information relating to the financial markets available on this page has been prepared and issued by FXStreet (Forexstreet SL, Spain, Reg: B62498233) on the basis of publicly available information and all information believed to be reliable and does not conflict with Kuwaiti local laws, and all necessary care has been taken to before the company to ensure that the facts mentioned are correct from the source.
NCM Investment nor any of its directors or employees shall in any way be held responsible for the contents of this news, and the information contained on this page is intended only to provide clients with publicly available information and should not be construed as investment advice, report or analysis and/or constitute an offer or invitation to buy or sell financial instruments of any kind.
RISK WARNING: Forex and CFDs are highly risky leveraged products, as losses can exceed deposits. Please ensure you understand all the risks and take independent advice if necessary. NCM will segregate the clients based on the criteria of the regulator and its bylaws. NCM does not provide any advisory service; the material published does not constitute advice or a recommendation for a transaction in any financial instrument. NCM accepts no responsibility for any use of the content presented and any consequences of that use. Anyone acting on the information provided does so at their own risk.