Daily Market Updates
02 Oct 2023
USDJPY
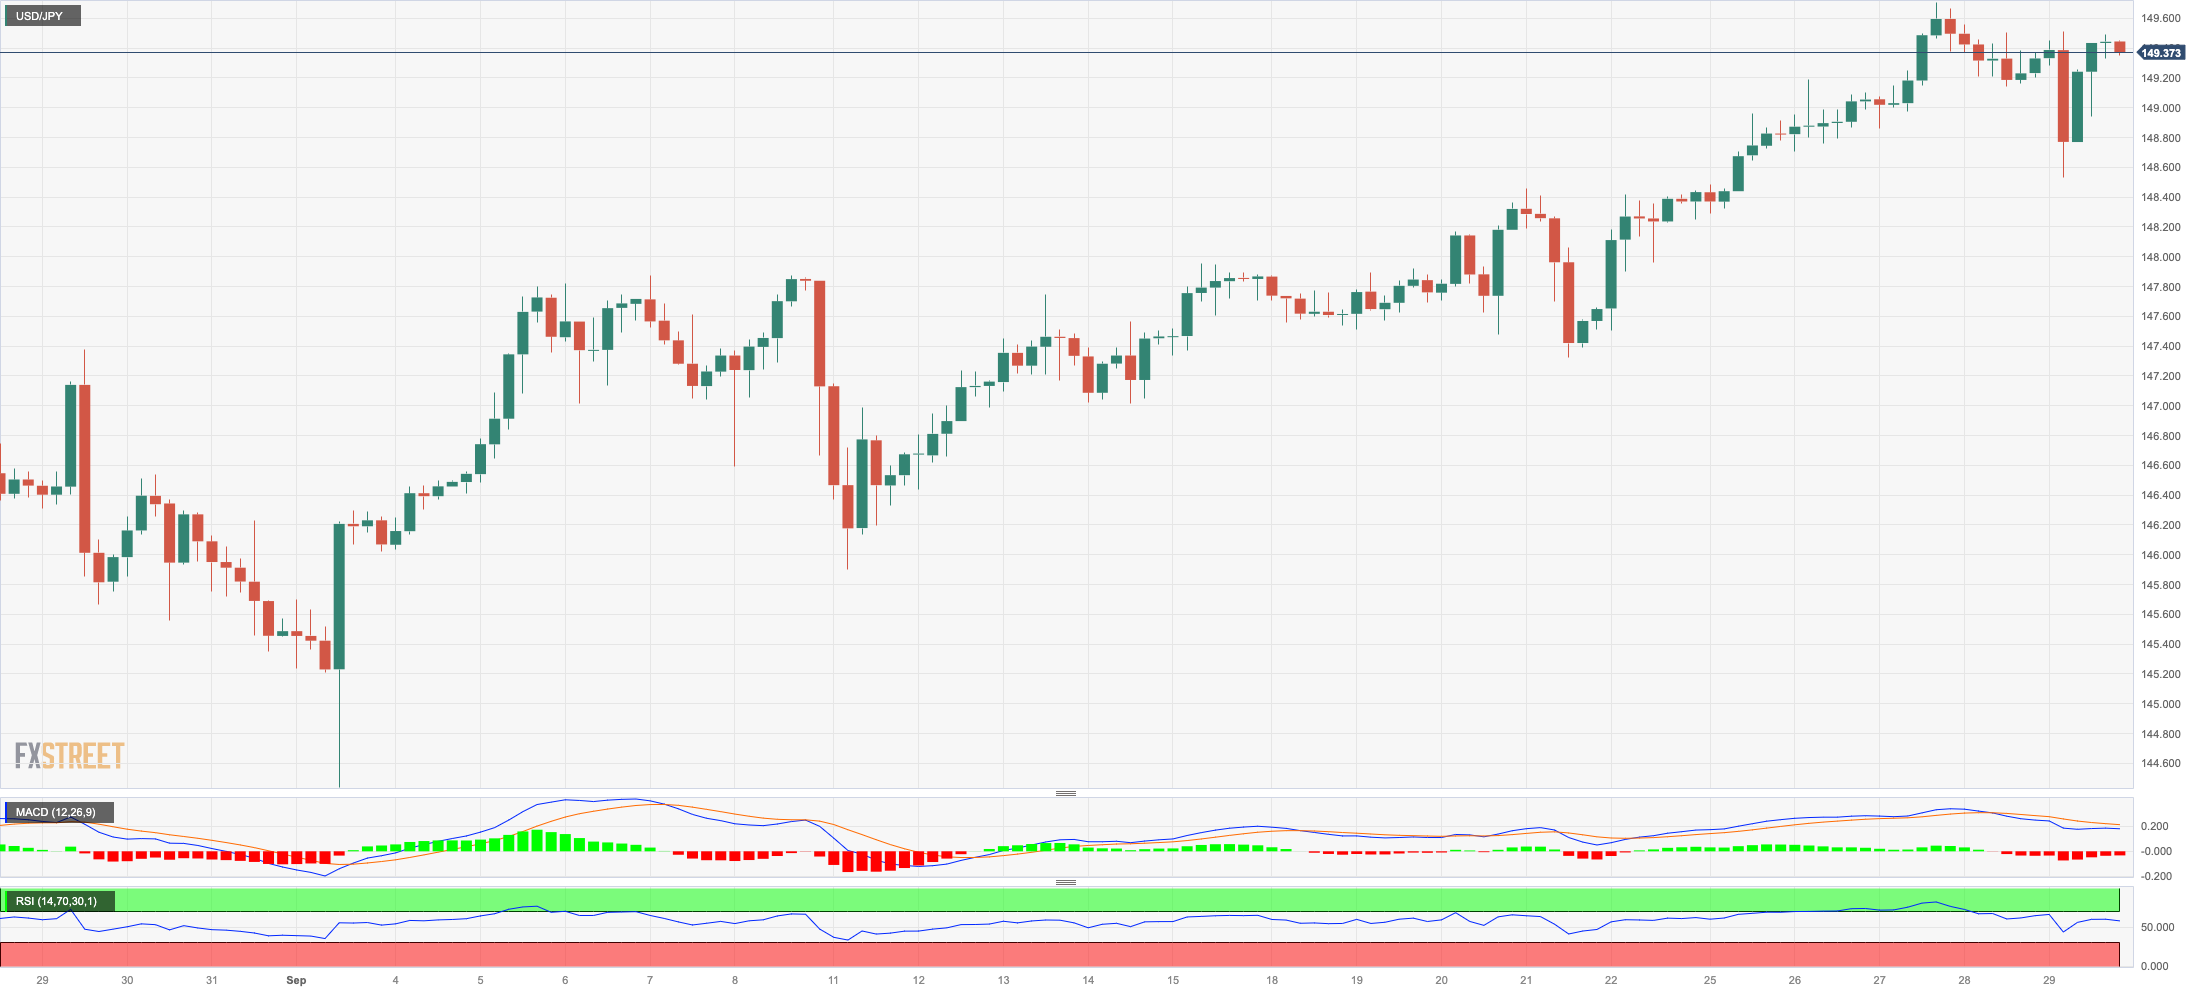
USD/JPY charted an irresolute session on Friday, briefly testing lows in the mid-148.00s to regain the 149.00 hurdle and above towards the end of the session on Wall Street.
Another inconclusive session for the greenback in combination with the continuation of the downside pressure in US yields across different time frames weighed on the pair, while cautiousness surrounding a potential FX intervention by the BoJ and the Japanese government also lent legs to the yen.
Busy day data-wise in Japan, as the Unemployment Rate held steady at 2.7% in August and flash Industrial Production contracted 3.8% from a year earlier. Additionally, Consumer Confidence eased to 35.2 in September and Housing Starts contracted 9.4% in August vs. the same month of 2022.
The breakout of the 2023 high of 149.70 (September 27) should prompt USD/JPY to rapidly challenge the key round level of 150.00 ahead of the 2022 top at 151.94 (October 21). On the flip side, there is immediate contention at the weekly low of 145.89 (September 11) prior to the interim 55-day SMA at 145.12 and the September low of 144.43 (September 1). The breakdown of the latter could expose a move to the transitory 100-day SMA at 143.13 ahead of the August low of 141.50 (August 7). Down from here emerges the key 200-day SMA at 138.01 before the July low of 137.23 (July 14). The day-to-day RSI remained flat above 65.
Resistance levels: 149.70 151.94 155.80 (4H chart)
Support levels: 148.52 147.32 147.04 (4H chart)
GBPUSD
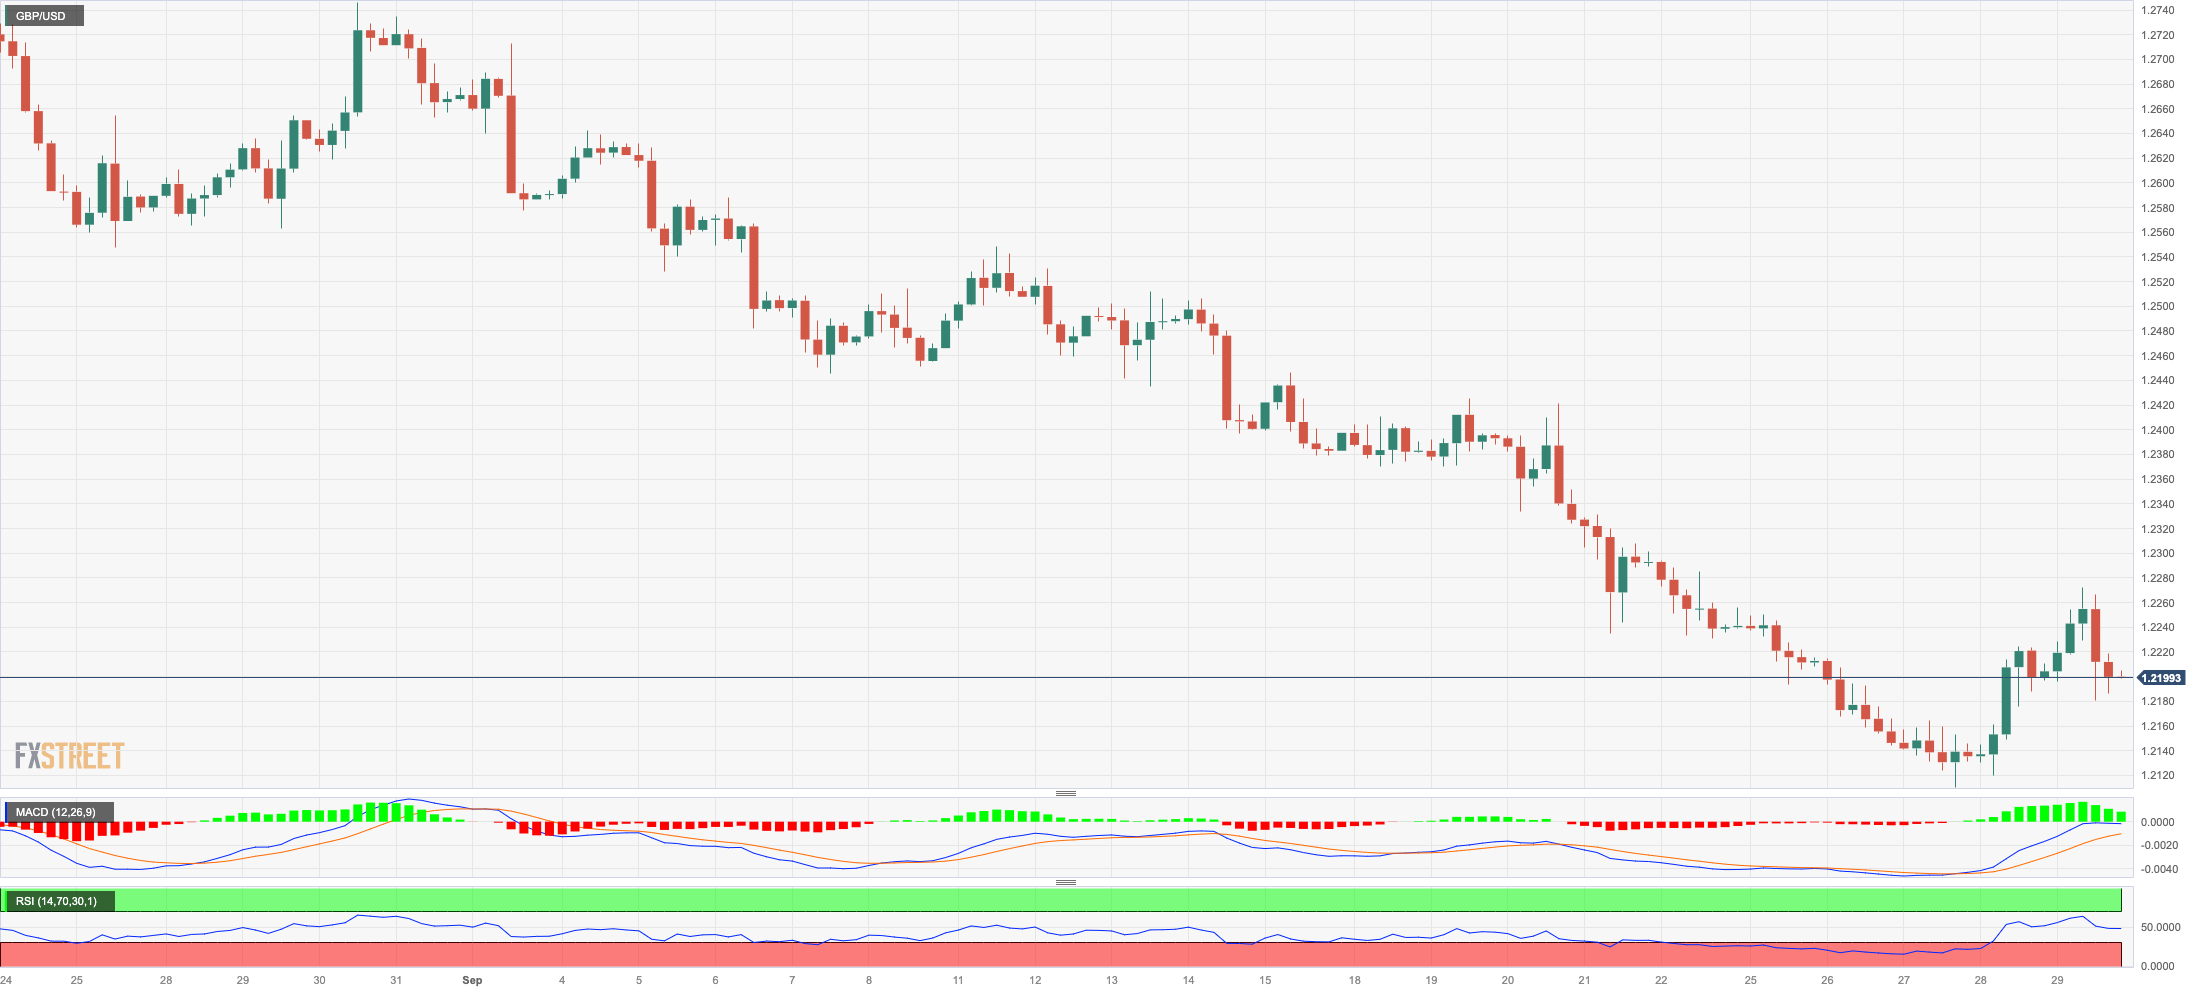
The British pound regained its smile and lifted GBP/USD to multi-day highs near 1.2270 at the end of the week, broadly in line with the generalized optimism in the risk complex. That move, however, fizzled out as the session drew to a close and left the pair with marginal gains around the 1.2200 neighbourhood.
Indeed, Cable managed to extend the upside for the second session in a row in response to the vacillating price action in the greenback, while positive results from the UK calendar also contributed to the quid’s uptick on Friday.
On the latter, final figures saw the GDP Growth Rate expand 0.6% YoY in Q2 and 0.2% QoQ. In addition, Mortgage Approvals came in at 45.354K in August, and Mortgage Lending rose to £1.218B.
If GBP/USD breaks the September low of 1.2110 (September 27), it could return to the key round milestone of 1.2000 before falling to the 2023 low of 1.1802 (March 8). Instead, the 200-day SMA at 1.2434 is the first hurdle on the way up, followed by the minor weekly high at 1.2548 (September 11). The preliminary 55-day and 100-day SMAs are at 1.2620 and 1.2622 respectively, ahead of the weekly tops of 1.2746 (August 30), 1.2818 (August 10) and 1.2995 (July 27), all above the psychological 1.3000 level. The daily RSI hovered just below 29.
Resistance levels: 1.2271 1.2421 1.2505 (4H chart)
Support levels: 1.2110 1.2010 1.1802 (4H chart)
AUDUSD
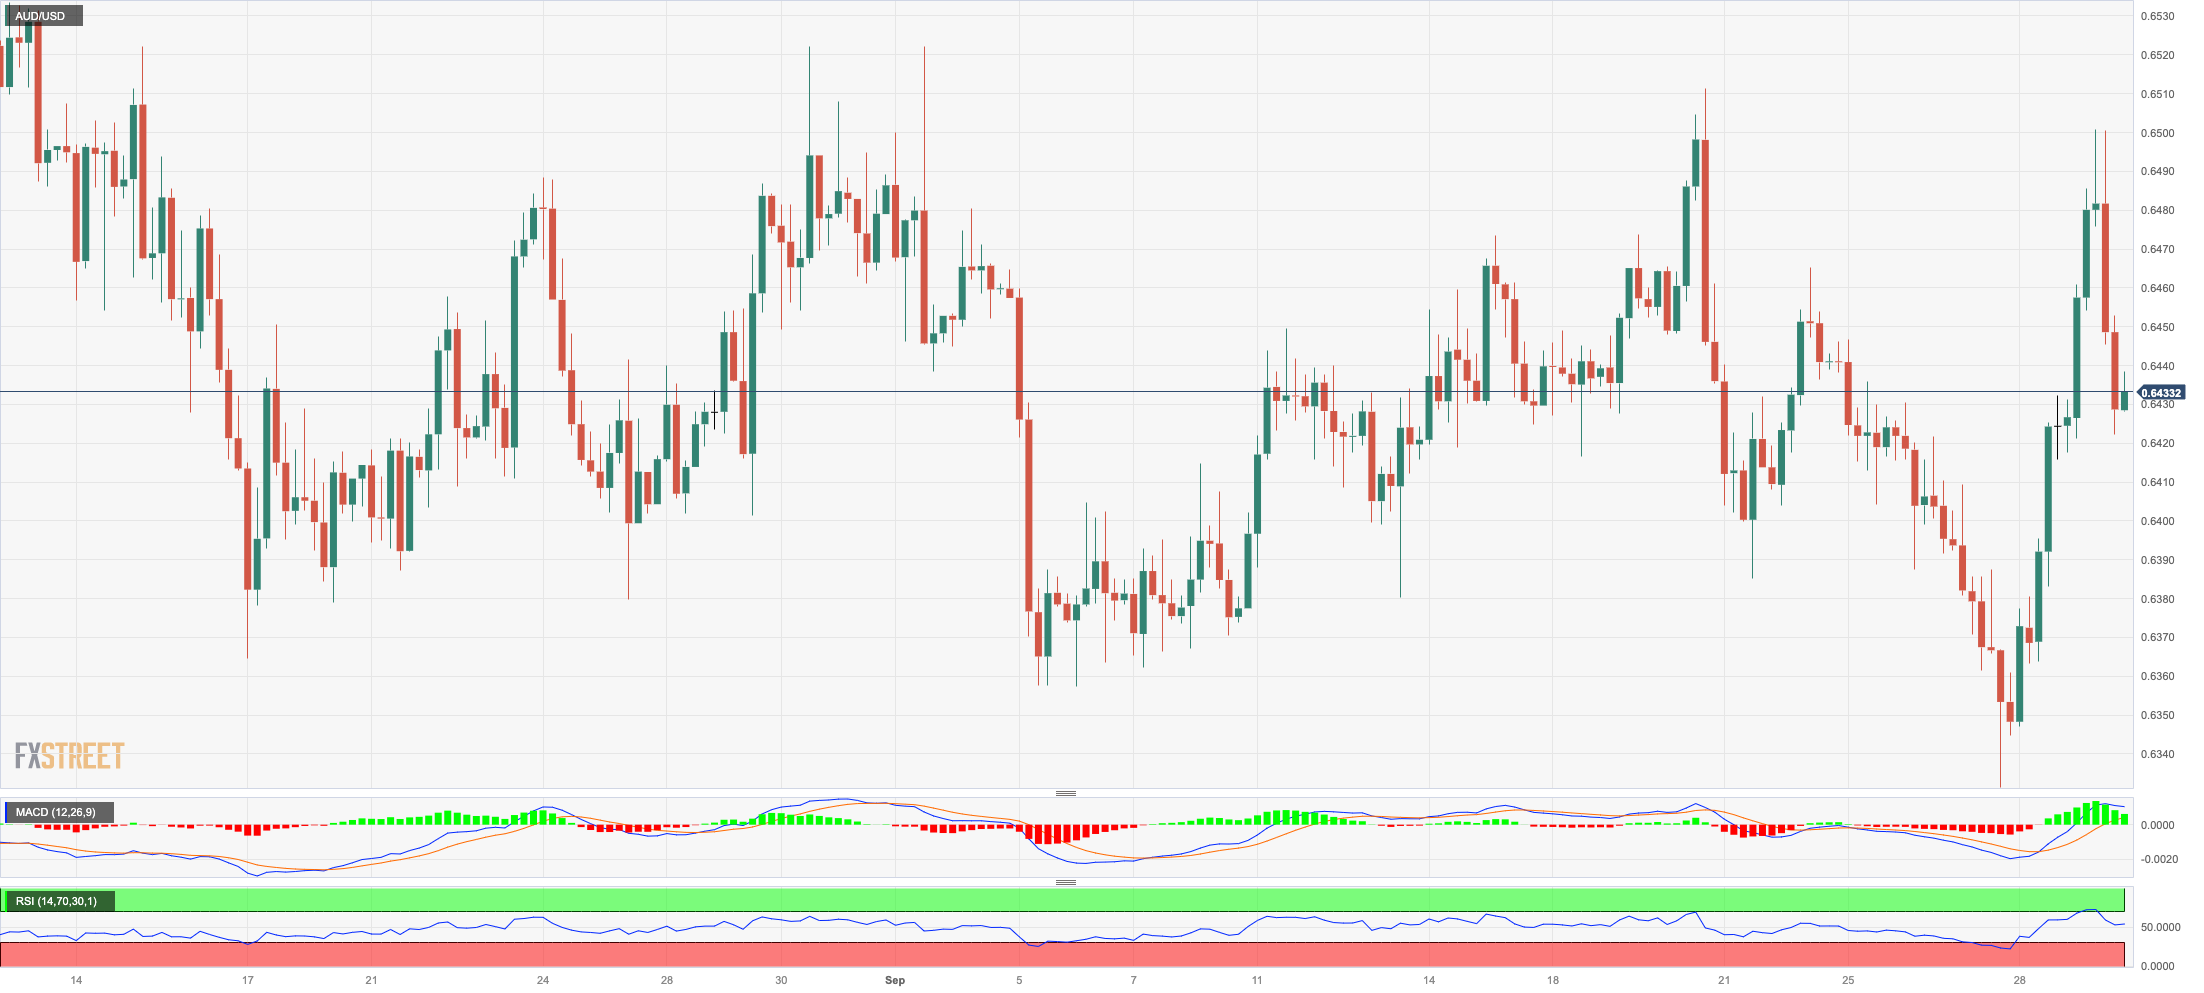
Following an earlier move to the 0.6500 neighbourhood, or multi-session tops, AUD/USD surrendered most of those gains and ended Friday’s session with humble gains around 0.6430.
The late rebound in the greenback forced the riskier assets to give away most of their advance at the end of the week, while the broad-based strong rebound in the commodity universe failed to lend more sustainable support to the Aussie dollar.
In Oz, Housing Credit expanded at a monthly 0.3% during August.
The 2023 low at 0.6331 (September 27) is proving to be the immediate challenge for AUD /USD, followed by the November 2022 low at 0.6272 (November 7) and the 2022 low at 0.6179 (October 13). The next upside barrier, on the other hand, is at the weekly high of 0.6522 (August 30), ahead of another weekly top of 0.6616 (August 10) and the 200-day SMA of 0.6688. Further rises could take the pair to its July peak of 0.6894 (July 14), just ahead of the June high of 0.6899 (June 16) and the important milestone of 0.7000, north of which is the weekly top of 0.7029 (February 14) and the 2023 top of 0.7157 (February 2). The everyday RSI rose marginally to the vicinity of 49.
Resistance levels: 0.6501 0.6511 0.6616 (4H chart)
Support levels: 0.6331 0.6272 0.6210 (4H chart)
GOLD
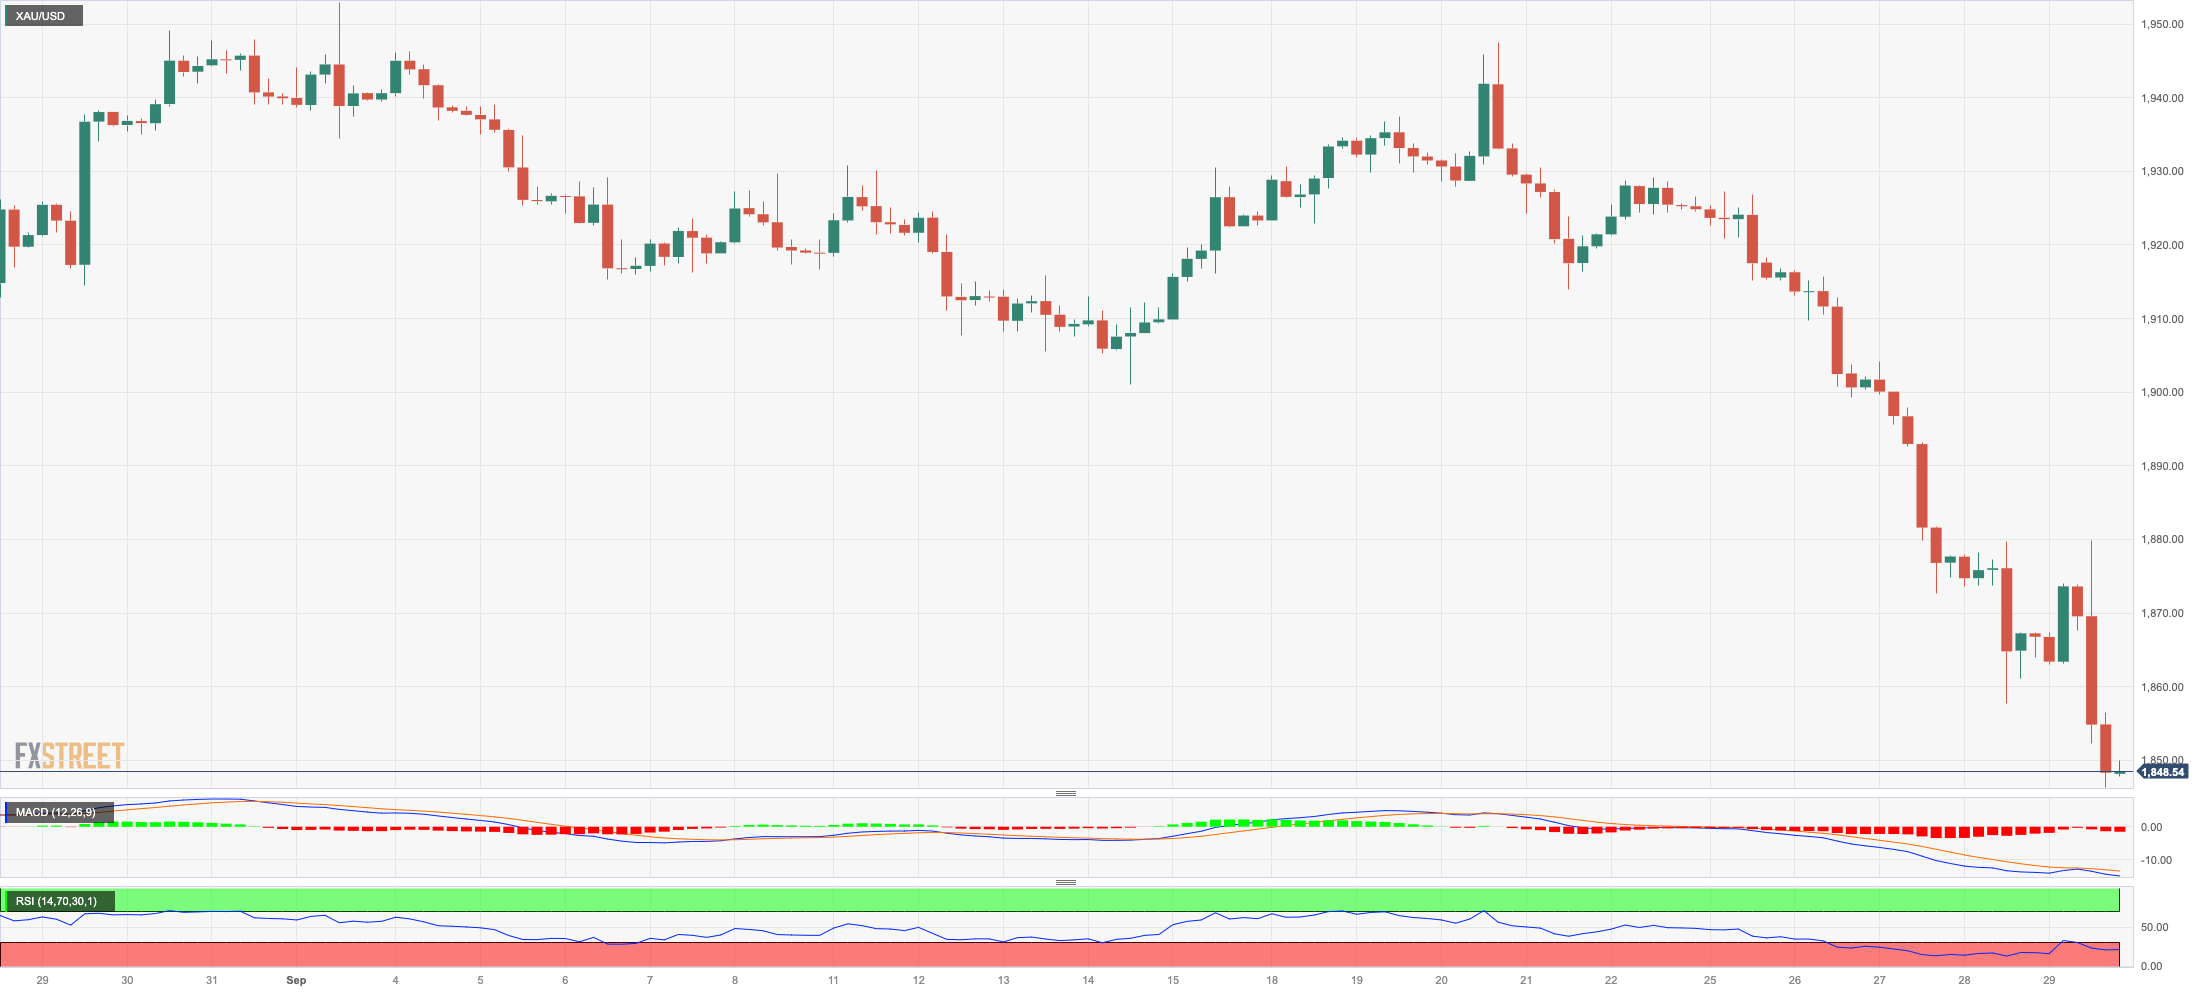
Prices of the yellow metal extended the negative performance for the fifth session in a row on Friday, this time printing new six-month lows around $1845 per troy ounce.
Bullion could not sustain the early advance to the $1880 zone and succumbed to the rebound in the greenback, while US yields also trimmed their initial decline and collaborated with the daily pullback in the precious metal.
There is a prevailing anticipation in the near future that there will be a heightened examination of the fluctuations in the price of gold. This is a result of the renewed discourse surrounding the Fed’s strategy for implementing stricter monetary policies. It is evident that there is a distinct chance of witnessing another 25 bps increase in interest rates prior to the conclusion of the year.
The next target for gold bears is the 2023 low at $1804 (February 28), just before of the important reversal zone at $1800. However, any bullish attempt should encounter first resistance around the critical 200-day SMA of $1927 before hitting the weekly high of $1947 (September 20) and the September top of $1953 (September 1). If the metal breaks above the latter, it might reach the July peak of $1987 (July 20), which is just below the psychological $2000 mark. The 2023 high is $2067 (May 4), which comes ahead of the 2022 top of $2070 (March 8) and the all-time peak of $2075 (7 August 2020).
Resistance levels: $1879 $1915 $1947 (4H chart)
Support levels: $1846 $1804 $1784 (4H chart)
CRUDE WTI
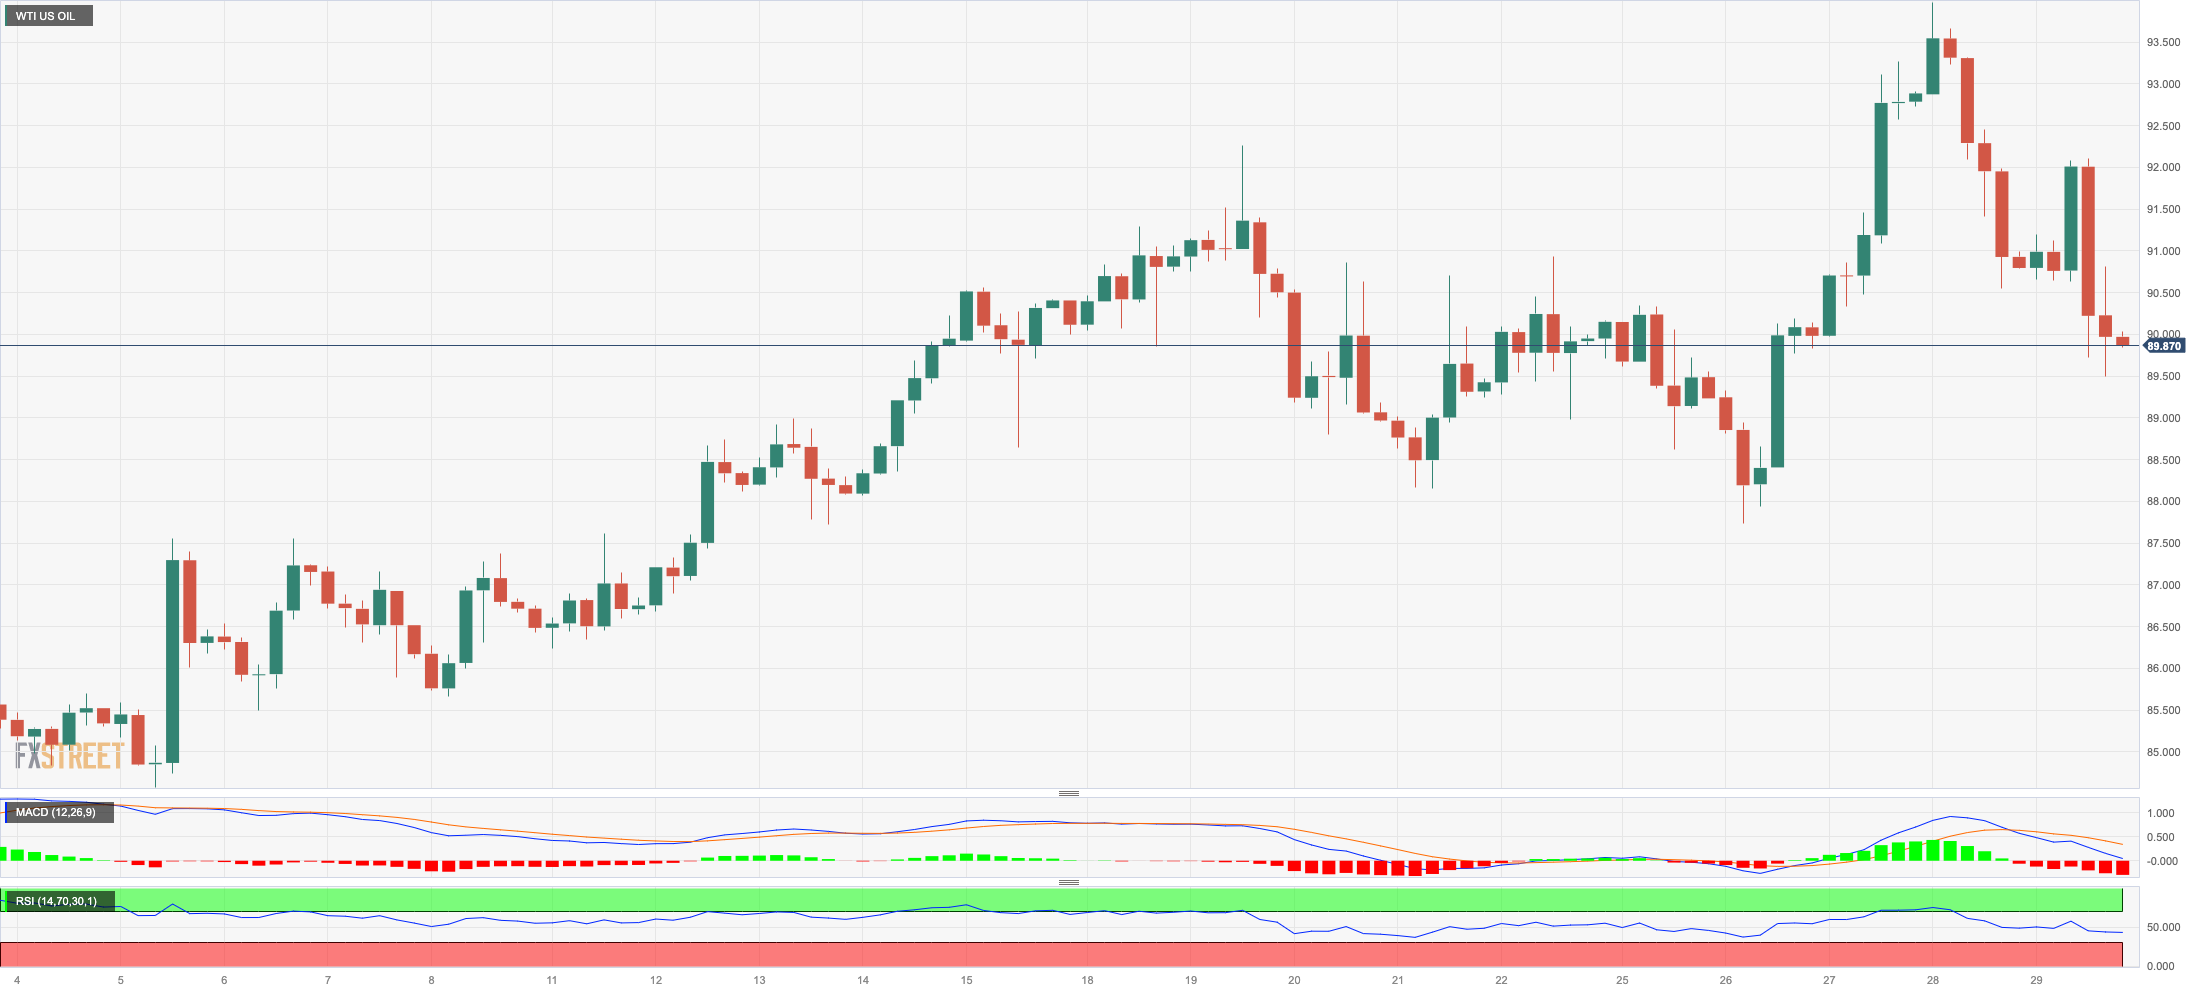
Prices of the American benchmark for the sweet light crude oil kept the negative stance in the latter part of the week, slipping back to two-day lows near the $90.00 mark per barrel on Friday.
The corrective move in the commodity came in response to further profit-taking, while concerns over a potential central bank-driven economic slowdown and its impact on the demand for oil also contributed to the sour sentiment among traders.
Closing the weekly calendar, driller Baker Hughes reported that the US oil rig count went down by 5 in the week ended on September 29, taking the total number of US active oil rigs to 502.
The surpass of the 2023 high of $94.99 (September 28) could prompt WTI prices to challenge the weekly top of $97.65 (August 30, 2022) ahead of the critical 100.00 mark per barrel. In contrast, there is an immediate contention at the weekly low of $88.24 (September 26) seconded by the temporary 55-day SMA at $83.65. The breach of the latter exposes the August low of $77.64 (August 24) prior to the important 200-day SMA at $77.31 and the weekly low at $73.89 (July 17). South from here emerges the June low of $66.85 (June 12), which comes before the 2023 low of $63.61 (May 4).
Resistance levels: $94.99 $97.65 $101.87 (4H chart)
Support levels: $90.32 $88.16 $86.12 (4H chart)
GER40
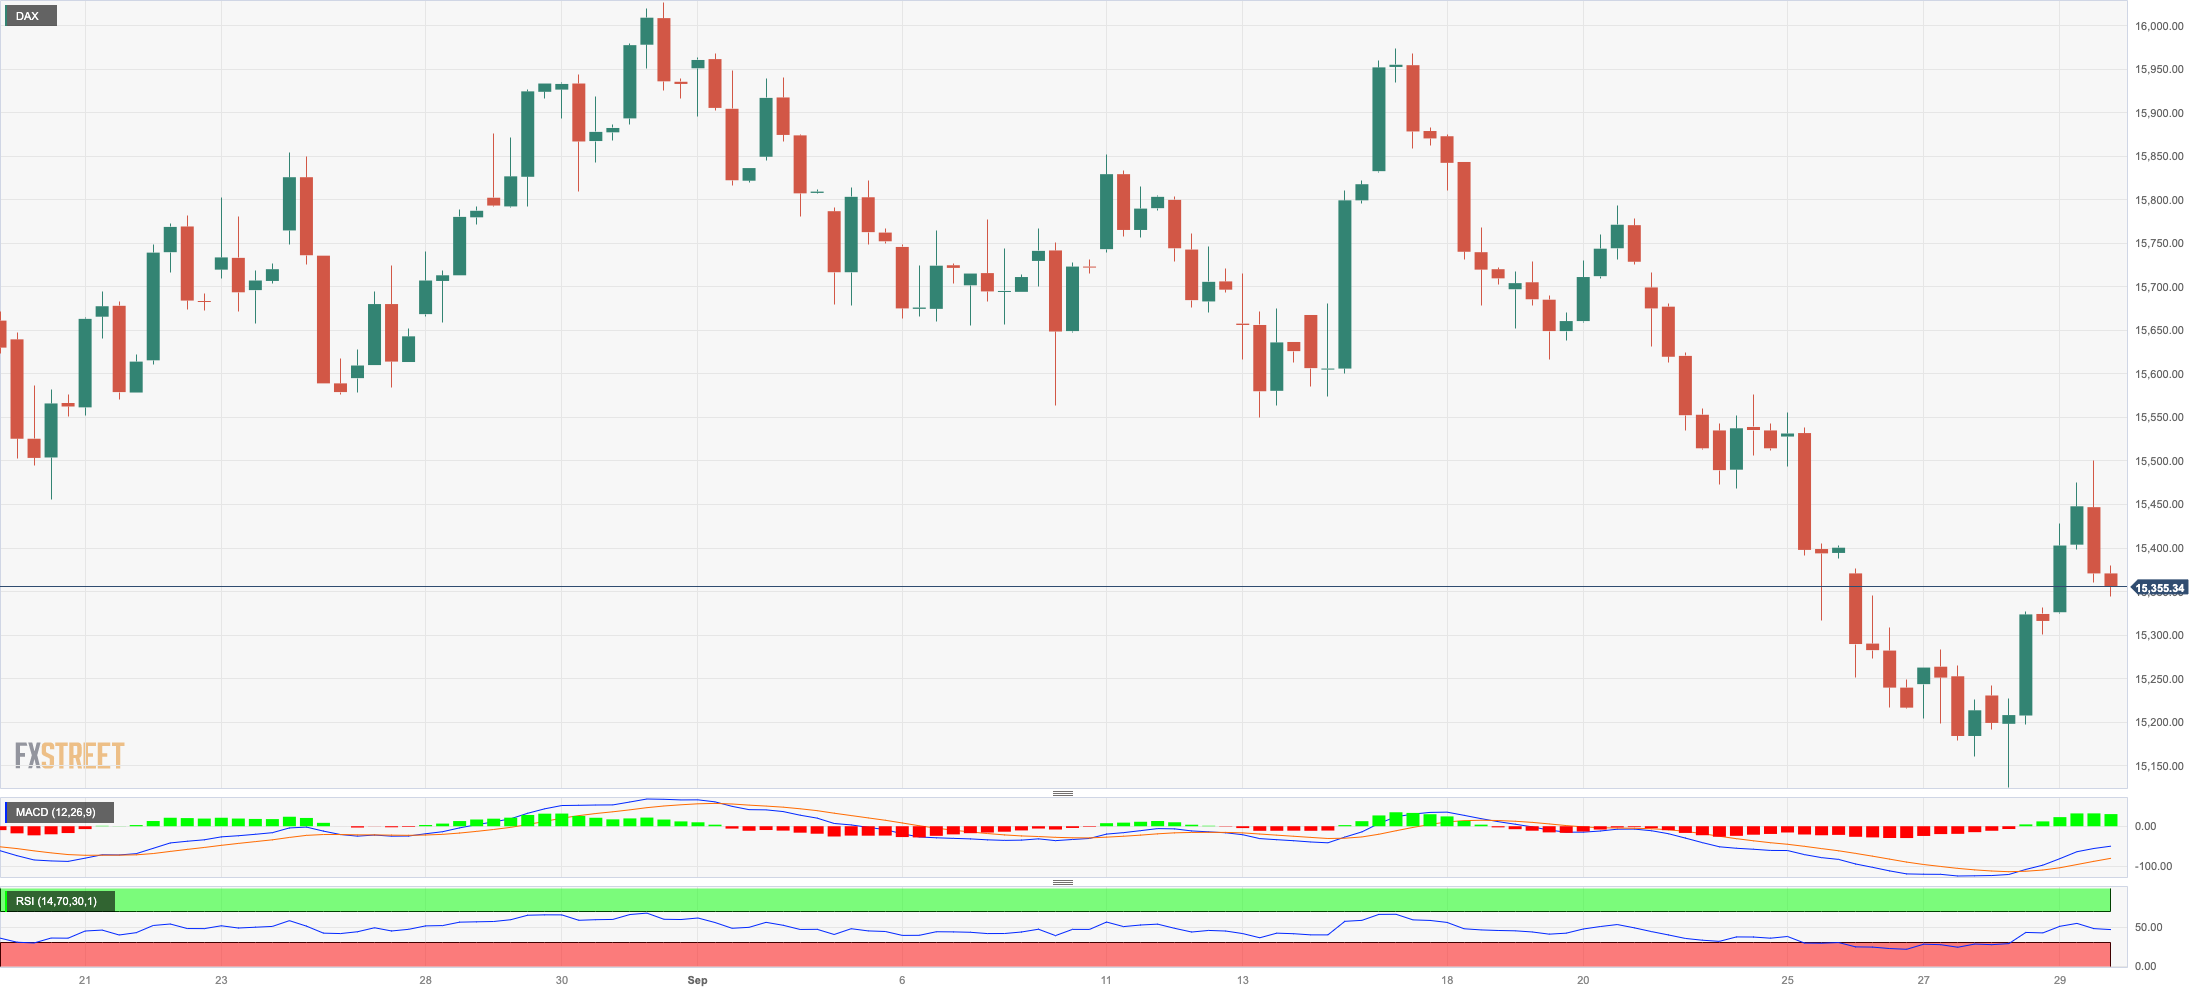
German equities advanced for the second session in a row, initially lifting the DAX40 to four-session tops around 15500, just to shed some ground towards the end of the European trading week on Friday.
Despite the last couple of sessions of gains, the index closed the second straight week in negative territory, including new six-month lows around 15100 on September 28.
The renewed optimism among investors seems to have been reinforced after another signal of disinflation in the euro area, which in turn appears to underpin the case of a pause by the ECB.
However, the gloomy economic outlook for the German economy and the whole region continues to emerge as strong headwinds for stocks in the next few months.
If sellers regain the upper hand, the DAX40 may retarget the September low of 15138 (September 28) prior to the March low of 14458 (March 20) and the December 2022 low of 13791 (December 20), all ahead of the 2022 low of 11862 (September 28). On the plus side, the 200-day SMA at 15578 seems to be the first hurdle before the September high of 15989 (September 14), followed by weekly tops of 16042 (August 31) and 16060 (August 10). The breakout of this level could put a test of the all-time peak of 16528 (July 31) back on the radar. The daily RSI rose to the boundaries of 40.
Best Performers: Commerzbank, Adidas, Vonovia
Worst Performers: Rheinmetall AG, Munich Re Group, Heidelbergcement
Resistance levels: 15515 15810 15989 (4H chart)
Support levels: 15138 14809 14458 (4H chart)
NASDAQ
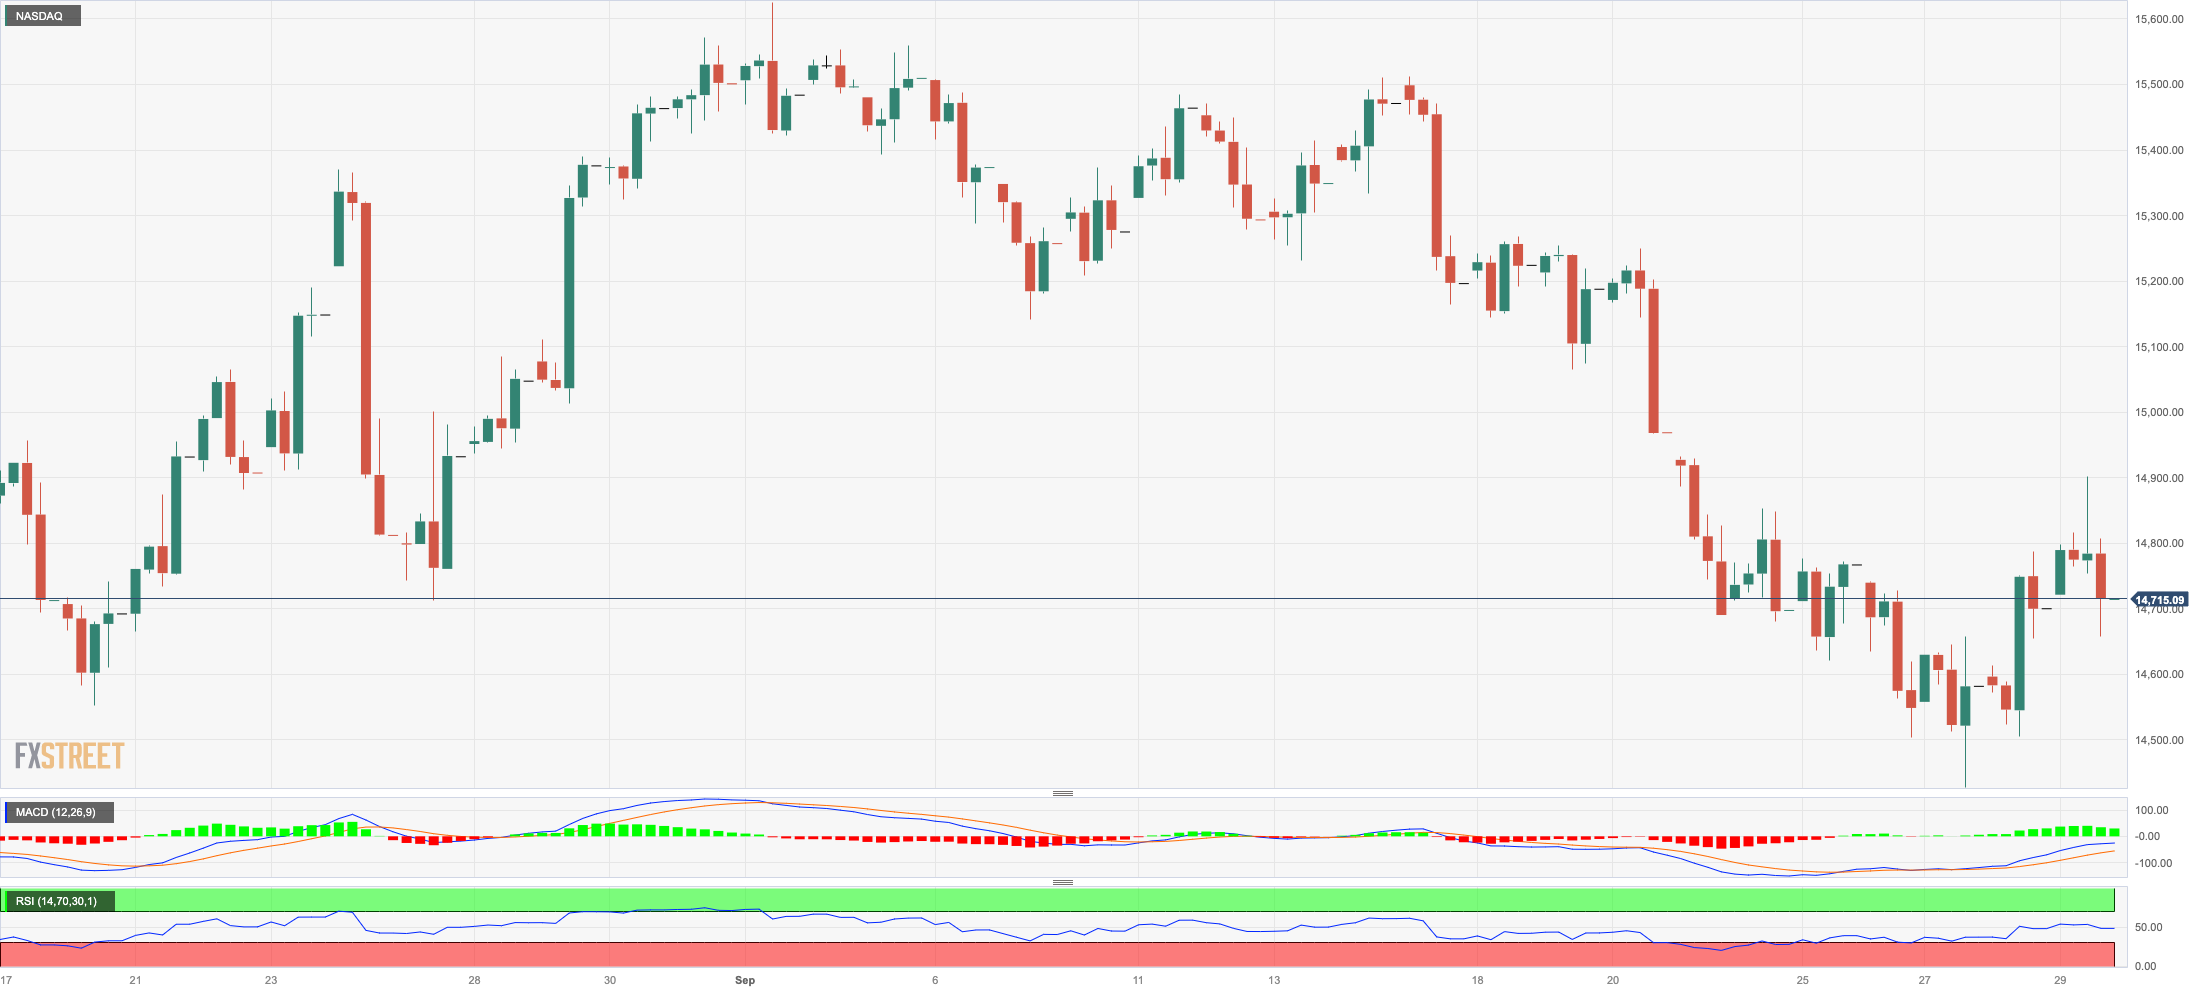
The Nasdaq 100 ended Friday’s session with a modest advance to the 14700 region, and it seems to have been enough to close the first week of gains after three consecutive pullbacks.
In line with the rest of its US peers, the index gave away part of its initial uptick to the 14900 region in response to hawkish comments from the NY Fed’s J. Williams. In addition, the late bounce in the dollar pari passu with yields trimming their daily losses, also put daily gains in the index under pressure.
Further upside could take the Nasdaq 100 to the 55-day SMA at 15226, which is ahead of the weekly high of 15512 (September 14) and the September top of 15618 (September 1). North from here aligns the weekly peak of 15803 (July 31) before the 2023 high of 15932 (July 19) and the round 16000 level. Conversely, a fall below the September low of 14432 (September 27) could retarget the weekly low of 14283 (June 7) ahead of the 200-day SMA at 13557 and the April low of 12724 (April 25). Once this region is breached, the index could test the March low of 11695 (March 13) prior to the 2023 low of 10696 (January 6). On the daily chart, the RSI reclaimed the 40 barrier and above.
Top Gainers: Walgreen Boots, Micron, Illumina
Top Losers: Baker Hughes, Sirius XM, GE HealthCare
Resistance levels: 14901 15512 15618 (4H chart)
Support levels: 14432 14283 13520 (4H chart)
DOW JONES
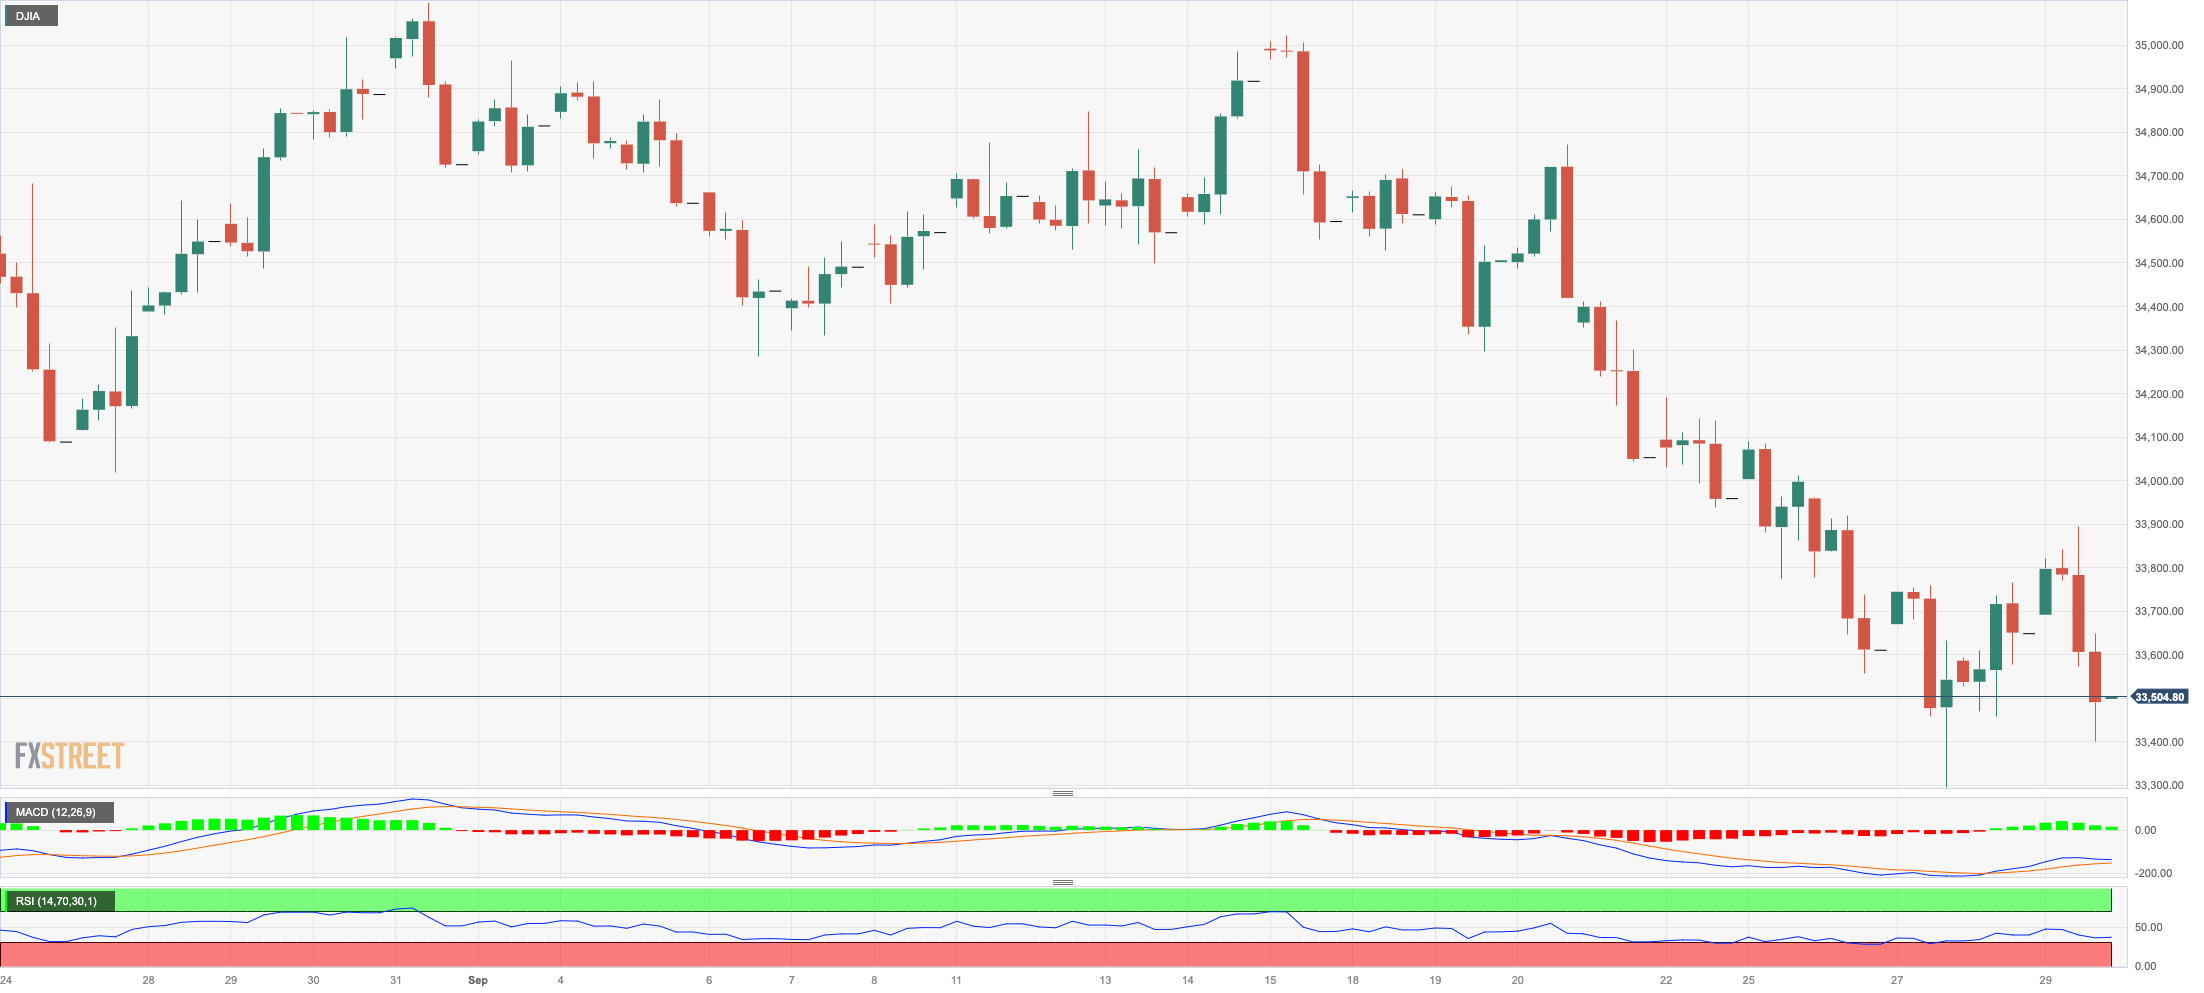
US stocks measured by the blue-chip index Dow Jones resumed the downside and closed with moderated losses around the 33500 region at the end of the week.
Indeed, the index quickly faded Thursday’s recovery attempt and retreated to negative territory after NY Fed J. Williams said interest rates could be at or near their peaks and favoured maintaining the current restrictive stance for a longer period.
Also adding to the already gloomy mood emerged fresh jitters surrounding a potential federal government shutdown as soon as over the weekend.
On the whole, the Dow Jones dropped 0.5847 to 33507, the S&P500 retreated 0.27% to 4288, and the tech-focused Nasdaq Composite gained 0.14% to 13219.
The resumption of the selling trend could push the Dow Jones to regain the September low of 33306 (September 27) ahead of the May low of 32586 (May 25) and the 2023 low of 31429 (March 15). On the contrary, the September high of 34977 (September 14) seems to be the immediate upside barrier before the weekly top of 35070 (August 31) and the 2023 peak of 35679 (August 1). If the latter is exceeded, the 2022 high of 35824 (February 9) could become visible before the all-time top of 36952 (January 5, 2022) is reached. The daily RSI dropped to the proximity of 30.
Top Performers: Nike, Walgreen Boots, Dow
Worst Performers: Travelers, JPMorgan, Walmart
Resistance levels: 33893 34279 34977 (4H chart)
Support levels: 33306 32586 31805 (4H chart)
MACROECONOMIC EVENTS


