
- Contact Us:
-

-

-

-


Daily Market Updates
03 Oct 2023
USDJPY
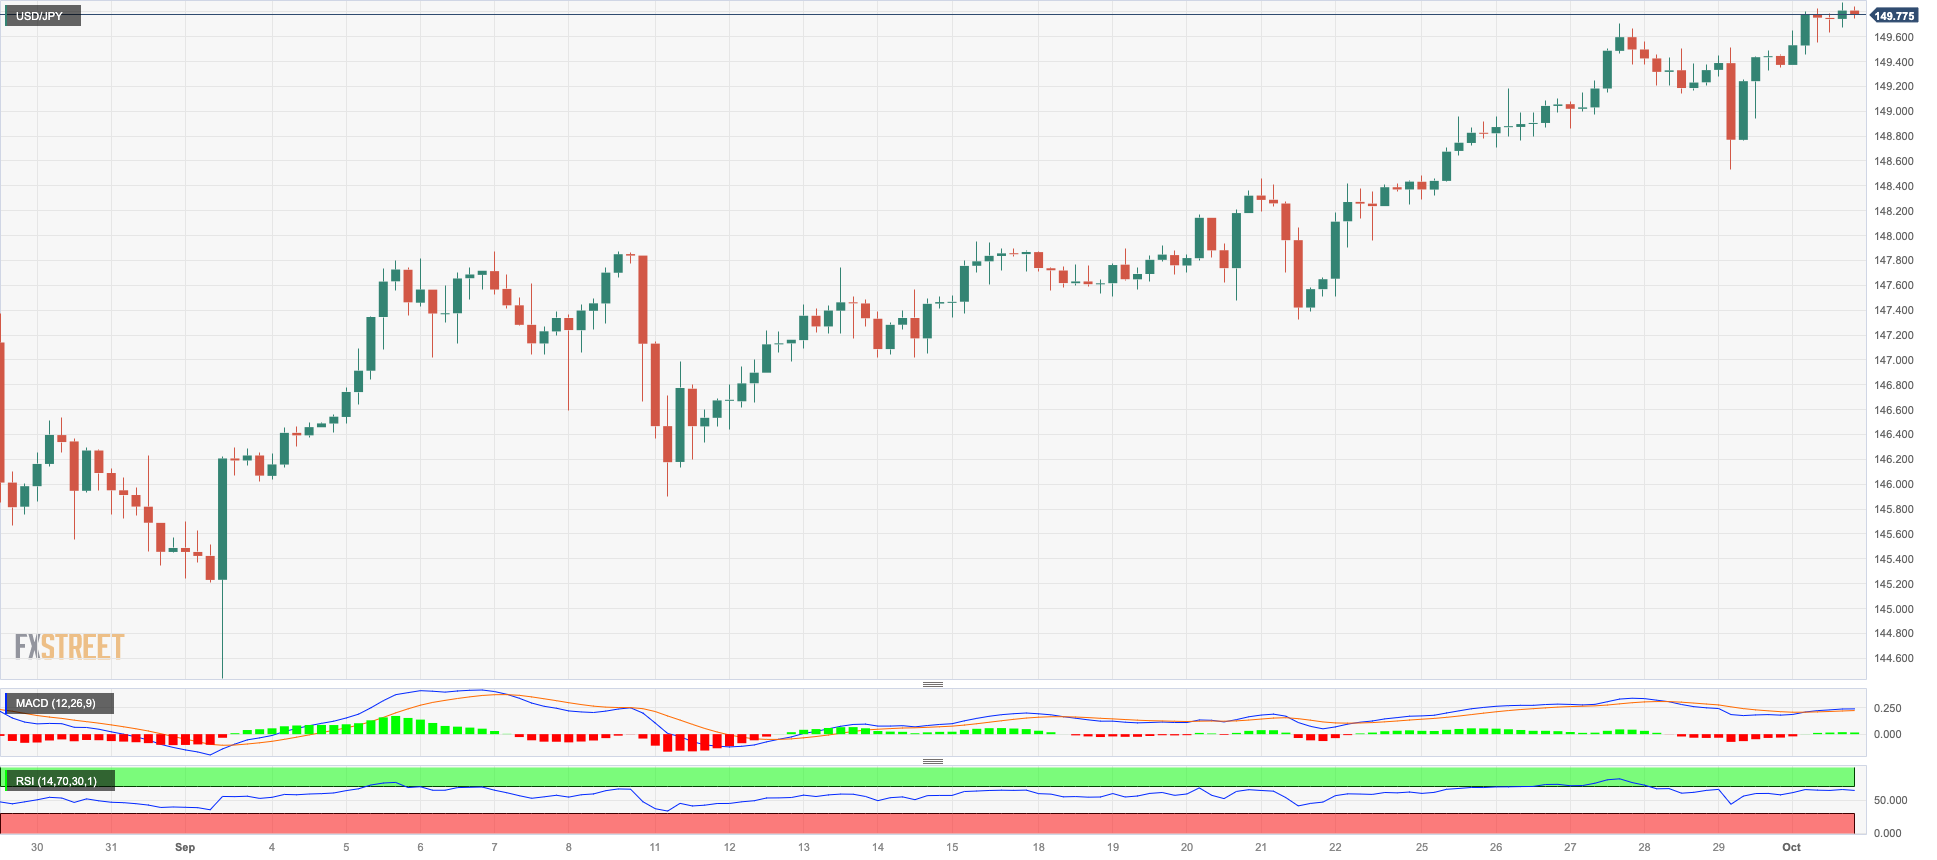
The rally in USD/JPY remained everything but abated at the beginning of the week. That said, the pair clinched new 2023 highs near 149.90, an area last seen in late October 2022.
The upward bias in spot appeared underpinned by the firm note in the greenback, which lifted the USD Index (DXY) to fresh yearly tops just below the 107.00 mark, while the equally robust march north in US yields across the curve also lent legs to the daily uptick. In the meantime, the JGB 10-year yields approached the 0.80% yardstick.
On the central banks’ front, the BoJ published its Summary of Opinions for the September meeting, where the bank leant towards a dovish hold, while it also announced additional bond-buying operations on Wednesday.
In the Japanese calendar, results for Q3 saw the Tankan Large All Industry Capex expand 13.6%, the Tankan Large Manufacturers Index rise to 9, the Tankan Large Manufacturing Outlook improve to 10 and the Tankan Large Non-Manufacturing Index tick higher to 27.
The break above the 2023 high at 149.87 (October 2) should prompt USD/JPY to quickly tackle the key round 150.00 level before reaching the 2022 top at 151.94 (October 21). On the other hand, the weekly low of 145.89 (September 11) is in immediate contention ahead of the 55-day SMA at 145.32 and the September low of 144.43 (September 1). The break of the latter could open a move to the temporary 100-day SMA at 143.27 ahead of the August low of 141.50 (August 7). From here, the key 200-day SMA at 138.10 comes next prior to the July low of 137.23 (July 14). The daily RSI rose to the boundaries of 68.
Resistance levels: 149.82 151.94 155.80 (4H chart)
Support levels: 148.52 147.32 147.14 (4H chart)
GBPUSD
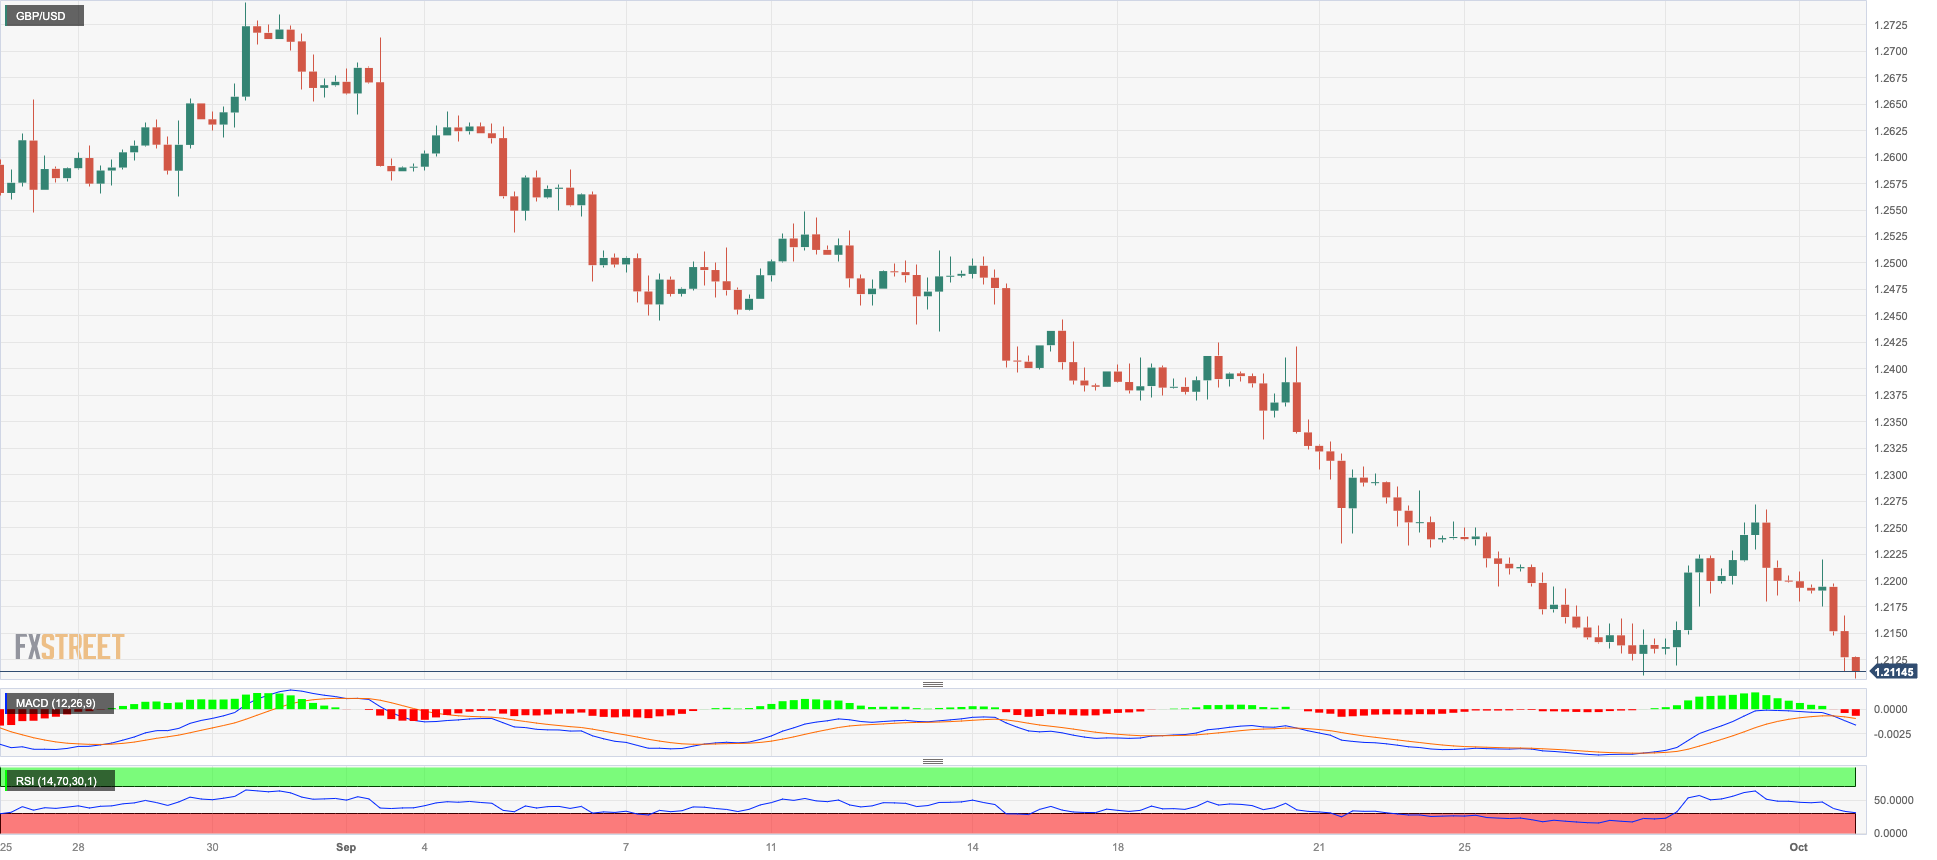
The continuation of the uptrend in the greenback sponsored a sharp correction in the British pound and prompted GBP/USD to resume the downward bias and flirt with the key 1.2100 neighbourhood on Monday.
In fact, the prevailing risk-off sentiment kept the appetite for the risk complex subdued and forced Cable to set aside two daily advances in a row, refocusing at the same time on the lower end of the range near the September lows.
In the UK, house prices measured by the Nationwide Housing Prices index dropped by 5.3% in the year to September, and the final Manufacturing PMI ticked higher to 44.3 in the same period.
If GBP/USD clears the September low of 1.2110 (September 27), it might return to the important round milestone of 1.2000 before sliding to the 2023 low of 1.1802 (March 8). Instead, the 200-day SMA at 1.2434 is the first obstacle to overcome, followed by the minor weekly high at 1.2548 (September 11). The preliminary 55-day and 100-day SMAs are at 1.2603 and 1.2618, respectively, ahead of weekly tops of 1.2746 (August 30), 1.2818 (August 10), and 1.2995 (July 27), all preceding the crucial 1.3000 barrier. The daily RSI remained well in the oversold zone below 25.
Resistance levels: 1.2271 1.2421 1.2505 (4H chart)
Support levels: 1.2107 1.2010 1.1802 (4H chart)
AUDUSD
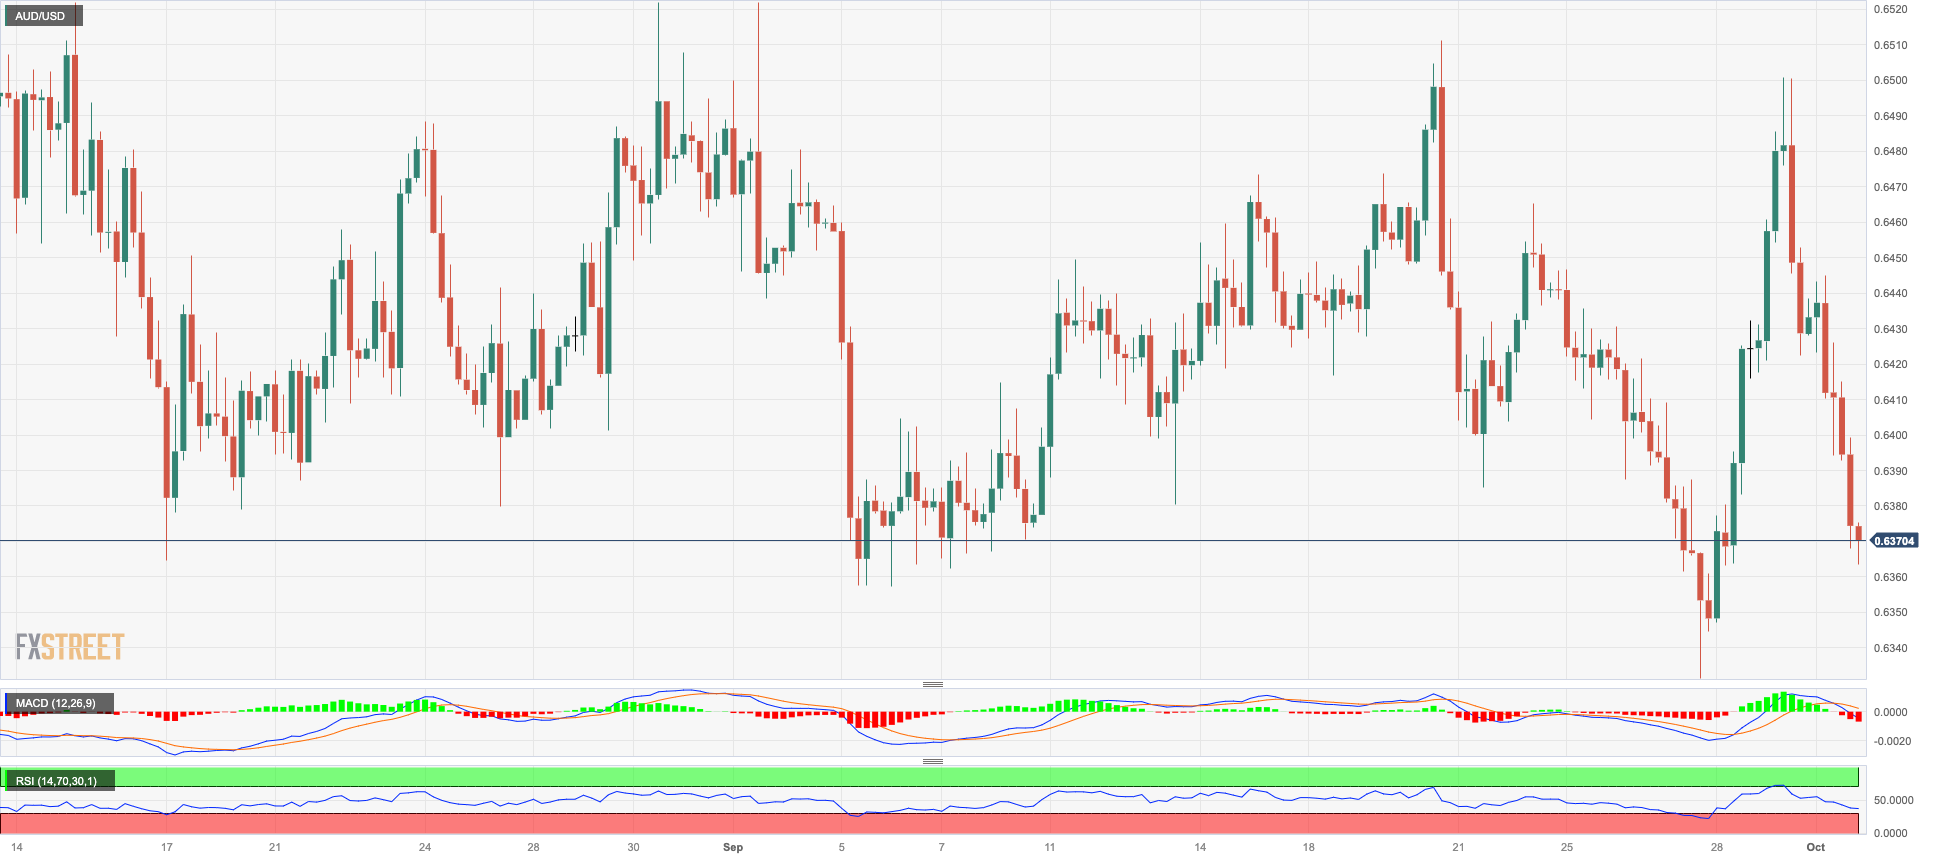
AUD/USD plummeted to the 0.6370/65 band following a failed attempt to surpass the 0.6450 region at the beginning of the week.
Extra buying pressure in the greenback played against any durable bullish attempt from the Aussie dollar, which didn't find any respite from the broad-based positive performance in the commodity galaxy either.
In addition, mixed results from Chinese PMI readings also seem to have added to the selling mood in the pair.
In the domestic calendar, final Judo bank Manufacturing PMI came in at 48.7 for the last month.
The 2023 low of 0.6331 (September 27) is proving to be the most urgent threat for the AUD/USD, followed by the November 2022 low of 0.6272 (November 7) and the 2022 low of 0.6179 (October 13). Having said that, the next upside resistance is at the weekly high of 0.6522 (August 30), followed by another weekly top of 0.6616 (August 10) and the 200-day SMA of 0.6686. Further gains might propel the pair to its July peak of 0.6894 (July 14), slightly ahead of the June high of 0.6899 (June 16) and the significant milestone of 0.7000, which is ahead of the weekly high of 0.7029 (February 14) and the 2023 top of 0.7157 (February 2). The daily RSI dropped to the vicinity of 41.
Resistance levels: 0.6501 0.6511 0.6616 (4H chart)
Support levels: 0.6384 0.6331 0.6272 (4H chart)
GOLD
There was no respite for the precious metal on Monday.
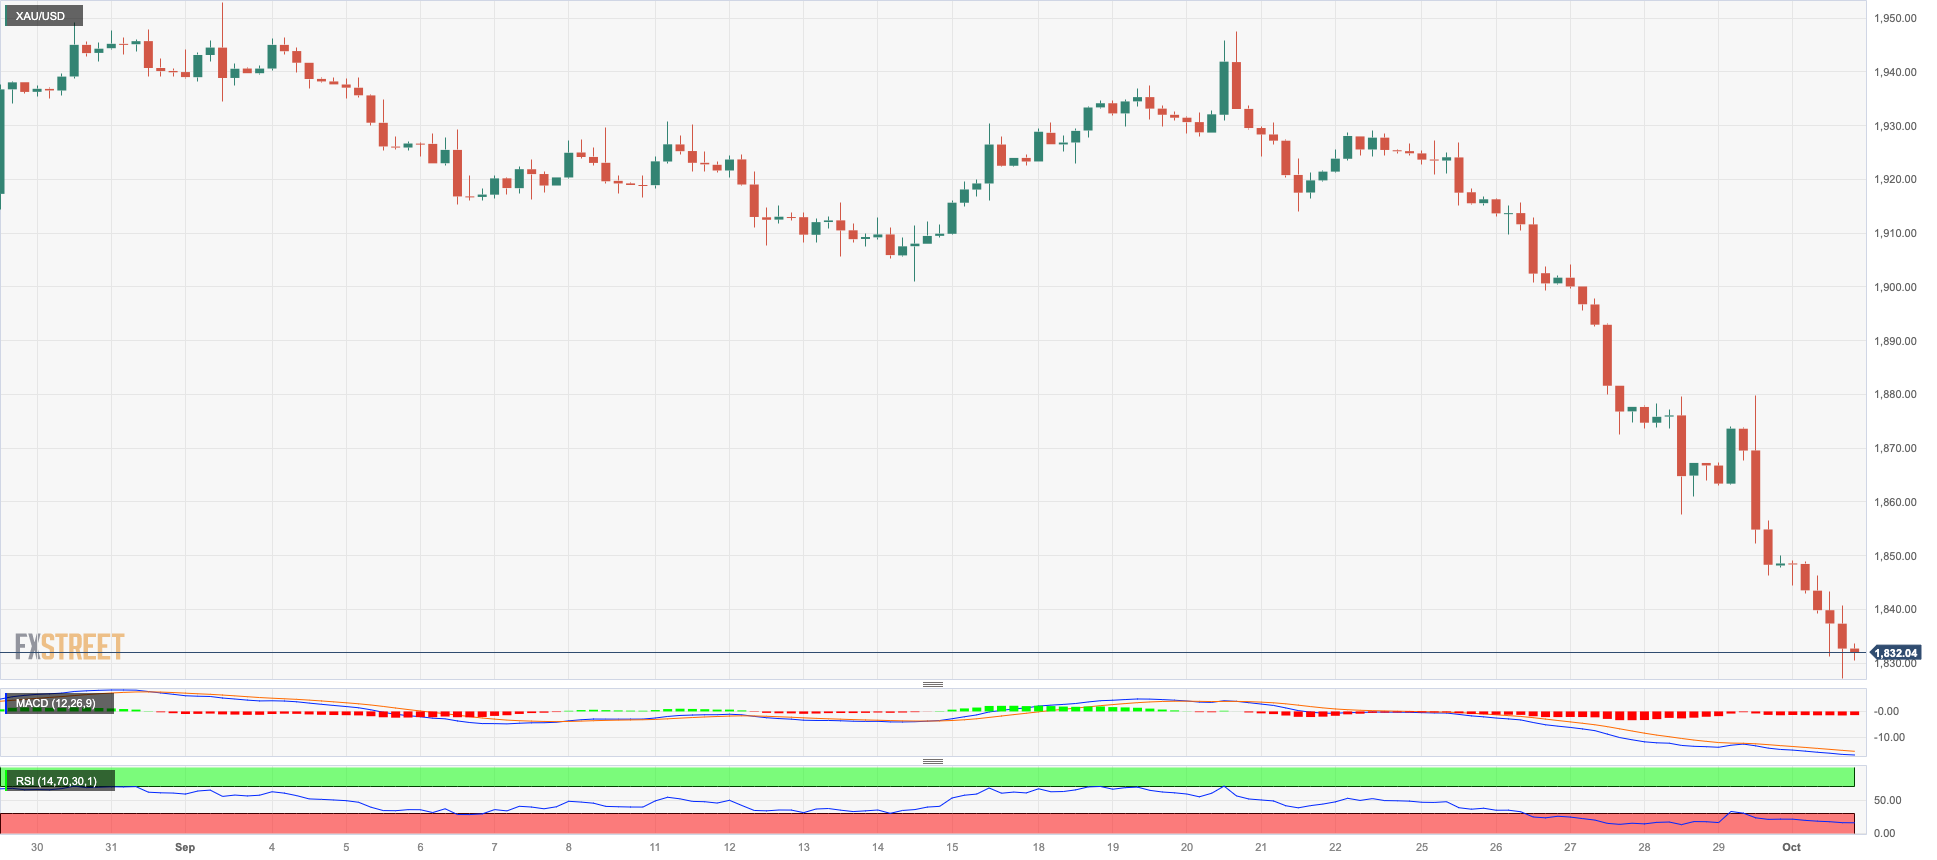
Indeed, prices of the troy ounce of the yellow metal retreated for the sixth session in a row and revisited the area of seven-month lows below $1830 at the beginning of the week.
The sharp contraction in bullion came in response to the strong bounce in the greenback, which came in tandem with rising US yields and seems to have been propped up by hawkish comments from FOMC Governor M. Bowman, who favoured further rate hikes and a tighter-for-longer stance by the Federal Reserve.
The next target for gold bears is the 2023 low at $1804 (February 28), just ahead of the key reversal zone at $1800. Instead, any upside attempt is likely to first encounter resistance around the critical 200-day SMA at $1927 before hitting the weekly high at $1947 (September 20) and the September top at $1953 (September 1). The breakout of the latter could prompt the metal to challenge the July top of $1987 (July) 20, which is just below the psychological $2000 mark. The 2023 high is $2067 (May 4), seconded by the 2022 top of $2070 (March 8) and the all-time peak of $2075 (August 7, 2020).
Resistance levels: $1879 $1913 $1947 (4H chart)
Support levels: $1827 $1804 $1784 (4H chart)
CRUDE WTI
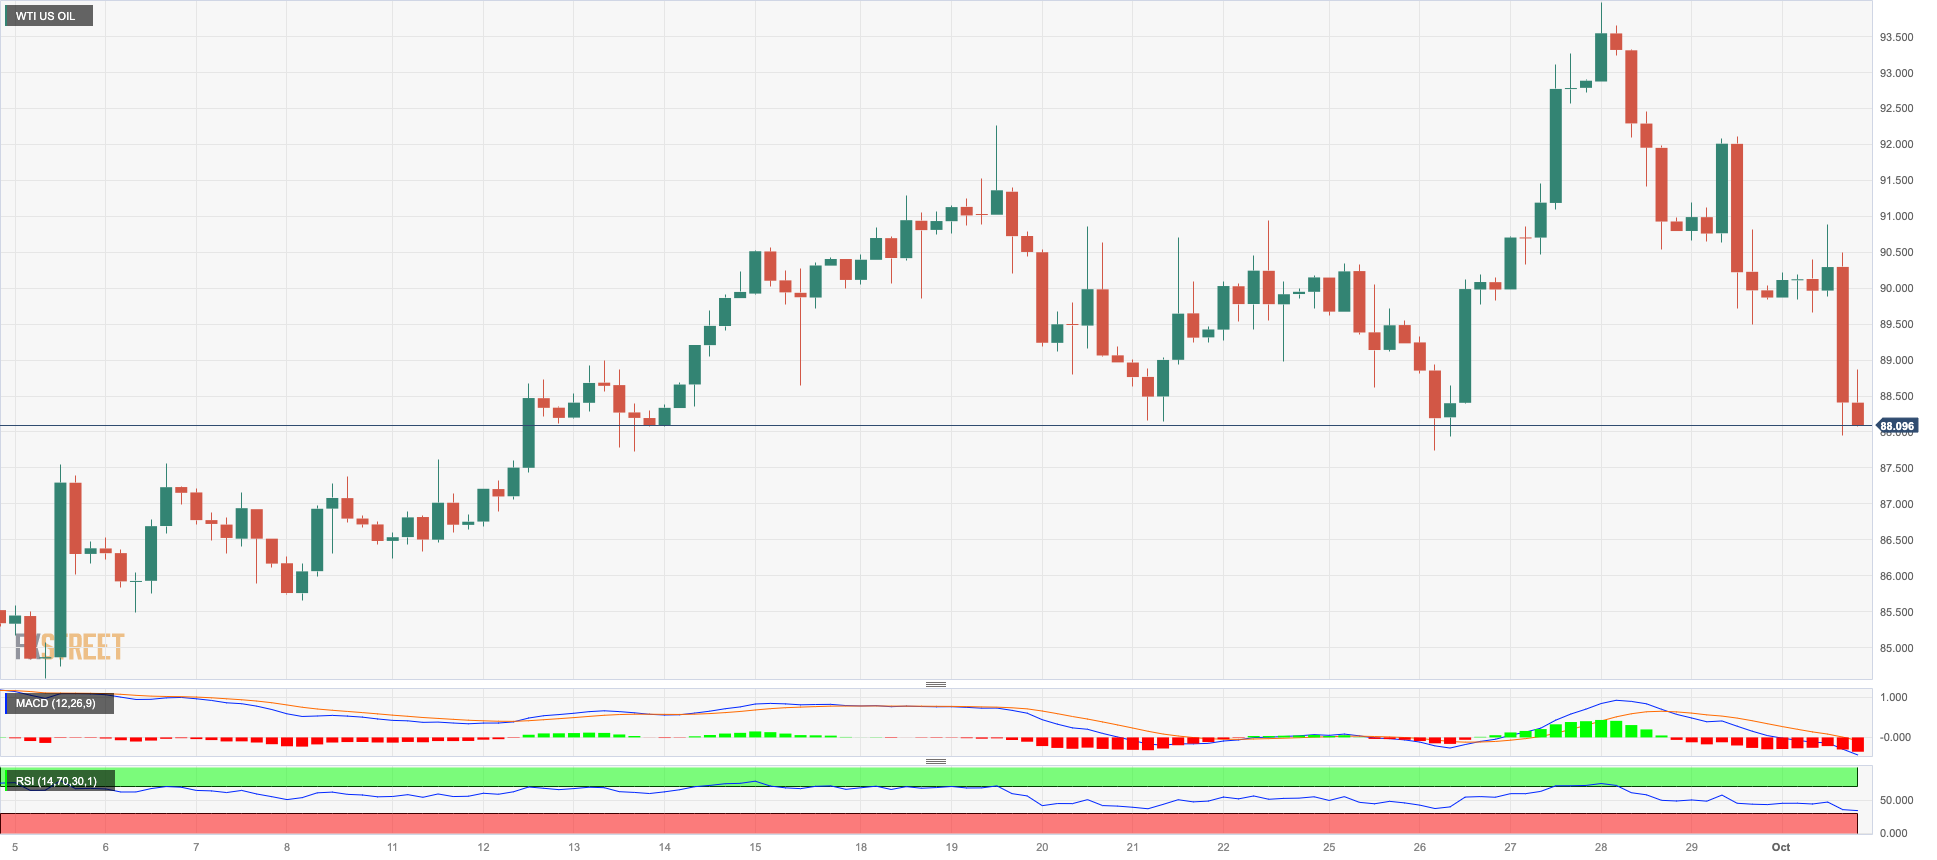
WTI prices dropped for the third consecutive session on Monday, this time breaching the key $90.00 mark per barrel to trade in multi-day lows.
Demand concerns mainly stemming from major central banks’ tightening campaigns in combination with the impact of higher crude oil prices on inflation hurt traders’ sentiment at the beginning of the week, while mixed results from the Chinese manufacturing sector also added to the downbeat mood.
Additionally, speculation that the OPEC would refrain from announcing new measures for the remainder of the year at its meeting later in the week added to the downward bias in prices.
Breaking above the 2023 high of $94.99 (September 28) could prompt WTI prices to challenge the weekly top of $97.65 (August 30, 2022) before hitting the critical $100.00 mark per barrel. In contrast, the weekly low of $88.24 (September 26), emerges prior to the temporary 55-day SMA at $83.93. If the latter is broken, the August low at $77.64 (August 24) will be visible before the important 200-day SMA at $77.37 and the weekly low at $73.89 (July 17). South of this, the June low at $66.85 (June 12) becomes visible, ahead of the 2023 low at $63.61 (May 4).
Resistance levels: $93.06 $94.99 $97.65 $101.87 (4H chart)
Support levels: $88.81 $88.16 $86.12 (4H chart)
GER40
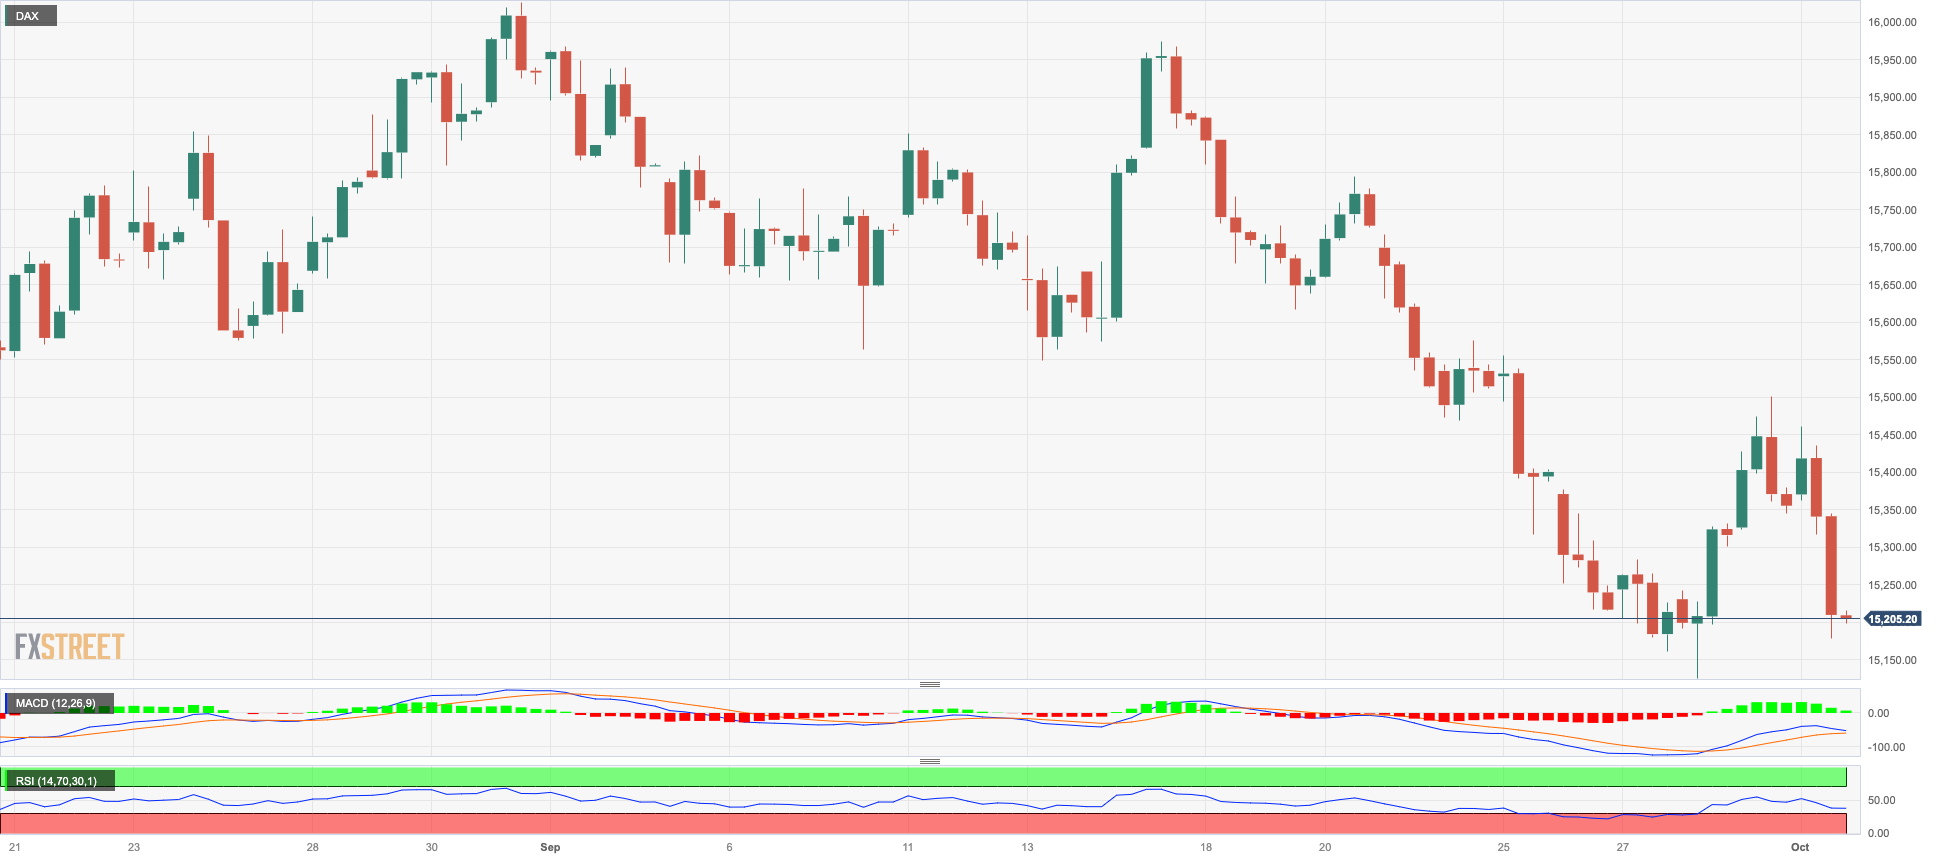
Germany’s benchmark index DAX40 dropped markedly and revisited the 15200 region on Monday.
Recession concerns returned to the fore following poor prints from the manufacturing sector in the euro area for the month of September, showing a noticeable deterioration of the sector across the continent.
In addition, higher crude oil prices and their impact on inflation were another source of concern among market participants, who continued to see the Federal Reserve maintaining its restrictive stance for a longer period.
If sellers regain the upper hand, the DAX40 could target the September low of 15138 (September 28) again before reaching the March low of 14458 (March 20) and the December 2022 low of 13791 (December 20), all before the 2022 low of 11862 (September 28). On the plus side, the 200-day SMA at 15585 appears to be the first hurdle before the September high of 15989 (September 14), followed by the weekly tops of 16042 (August 31) and 16060 (August 10). The breakout of this level could set up a test of the all-time top of 16528 (July 31) again. The RSI on the daily chart receded to the sub-36 area.
Best Performers: Zalando SE, Continental AG, Dr Ing hc F Porsche Prf
Worst Performers: Fresenius SE, Deutsche Bank AG, RWE AG ST
Resistance levels: 15515 15810 15989 (4H chart)
Support levels: 15138 14809 14458 (4H chart)
NASDAQ
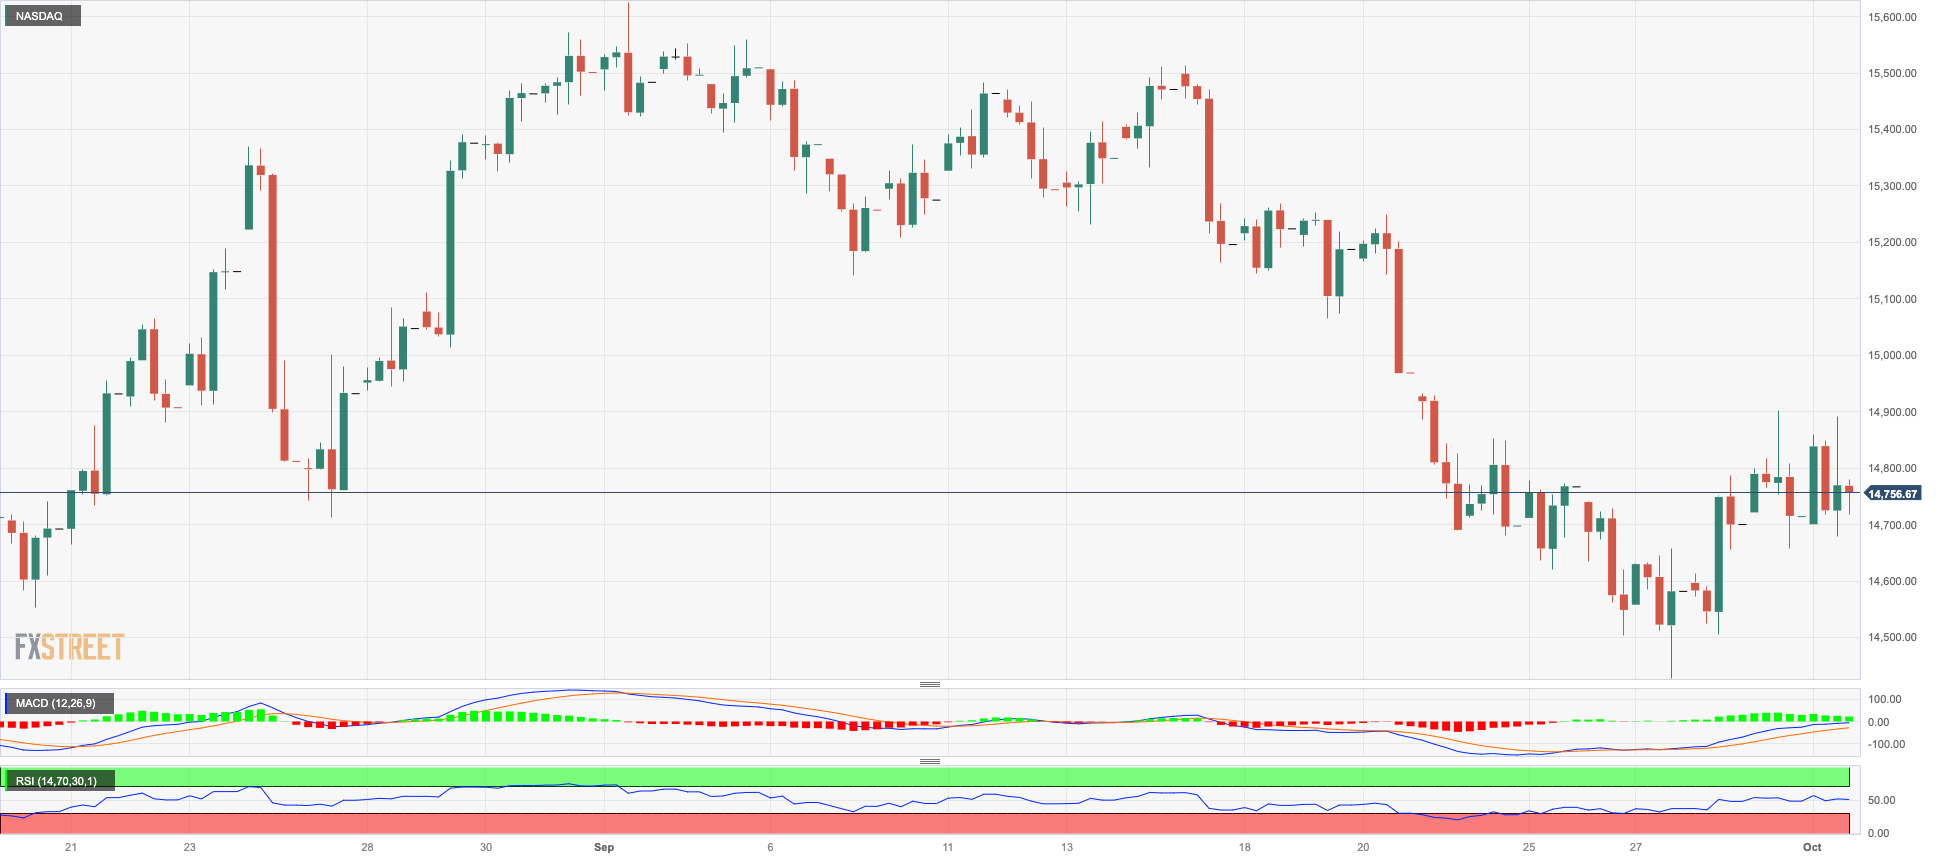
Unlike its US peers, the tech benchmark Nasdaq 100 edged higher for the fourth straight session at the beginning of the week, briefly flirting with the provisional 100-day SMA around 14900, or multi-day highs.
The optimism around the US tech sector remained well and sound on Monday despite fresh yearly highs in the US dollar and the resumption of the upside momentum in US yields across different maturities.
Further gains might propel the Nasdaq 100 to the 55-day SMA of 15211, ahead of the weekly high of 15512 (September 14) and the September top of 15618 (September 1). The weekly peak of 15803 (July 31) is aligned north of here, before the 2023 high of 15932 (July 19) and the round level of 16000. On the flip side, a drop below the September low of 14432 (September 27) might retarget the weekly low of 14283 (June 7), which is ahead of the 200-day SMA at 13572 and the April low of 12724 (April 25). Once this zone is violated, the index may target the March low of 11695 (March 13) before reaching the 2023 low of 10696 (January 6). The everyday RSI recaptured the 42 level on the daily chart.
Top Gainers: Zscaler, NVIDIA, Alphabet A
Top Losers: Constellation Energy, American Electric Power, Sirius XM
Resistance levels: 14901 15512 15618 (4H chart)
Support levels: 14432 14283 13520 (4H chart)
DOW JONES
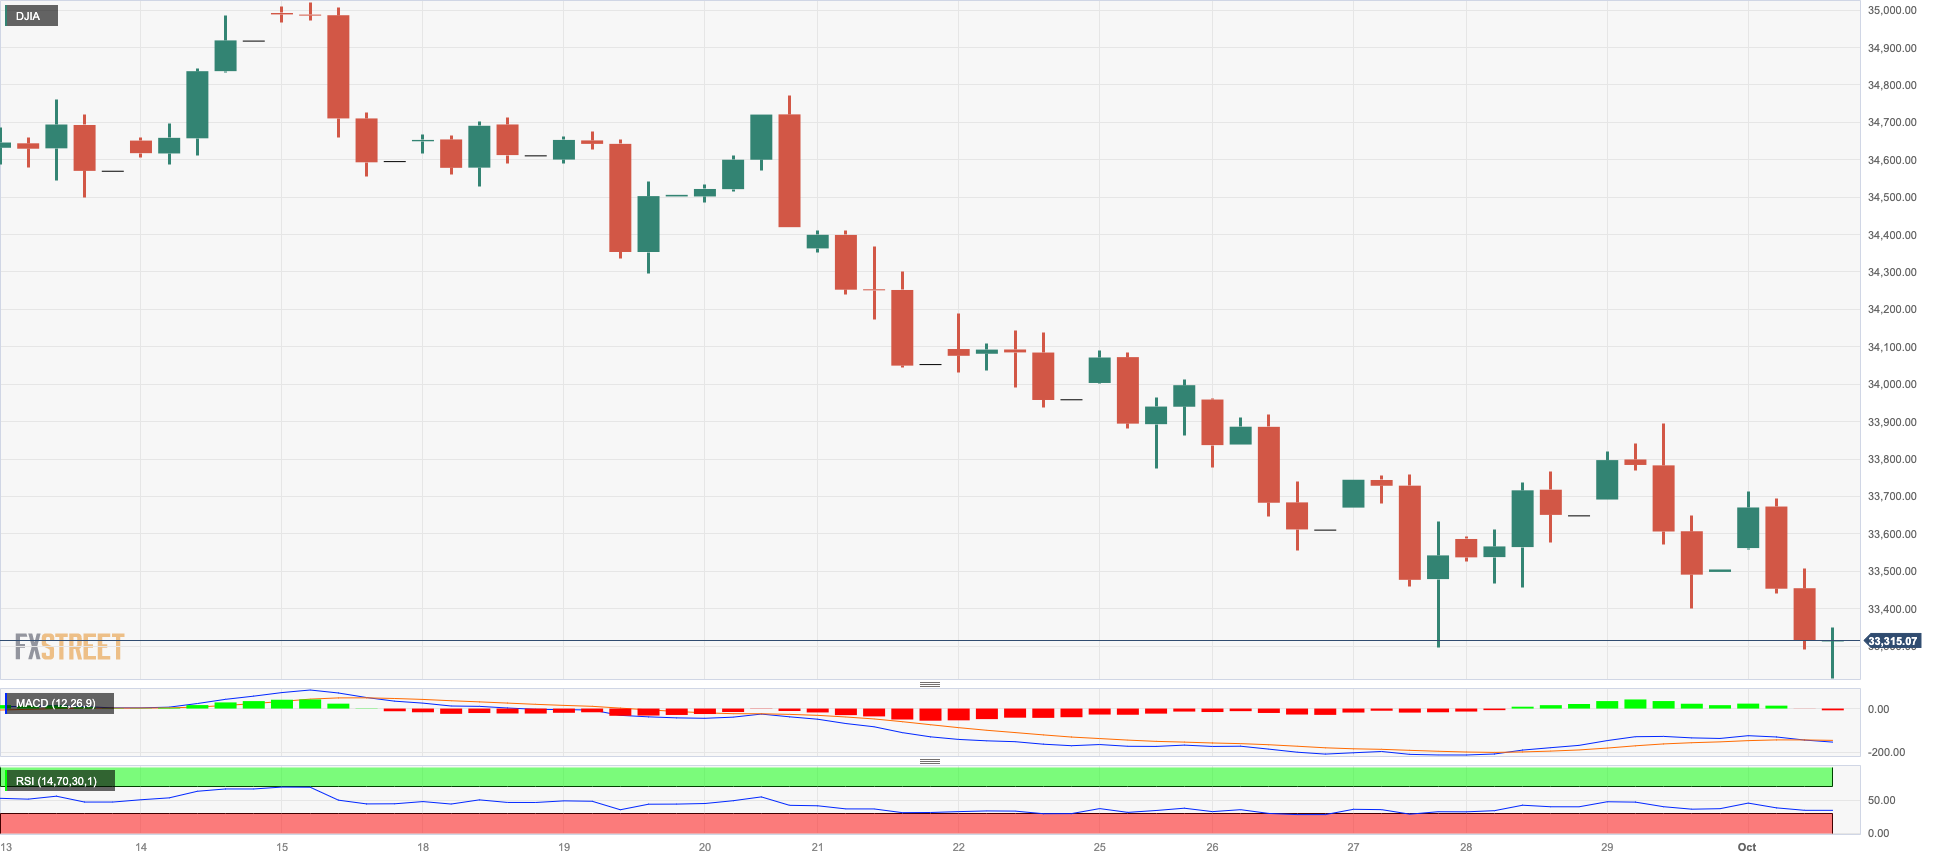
US equities started the week on the defensive and prompted the Dow Jones to retreat for the second session in a row, briefly visiting new lows in levels last seen in early June around the 33200 region.
The blue-chip index succumbed to the continuation of concerns regarding inflation and the perception that the Federal Reserve might keep its restrictive stance for longer than anticipated. In addition, hawkish comments from FOMC M. Bowman supported that view, as she advocated for extra tightening in the next few months.
All in all, the Dow Jones retreated 0.57% to 33317, the S&P500 dropped 0.39% to 4271, and the tech-heavy Nasdaq Composite advanced 0.22% to 13248.
The Dow Jones clinched a new low at 33219 on October 2. The loss of this level exposes a deeper drop to the May low of 32586 (May 25) and the 2023 low of 31429 (March 15). On the contrary, the September high of 34977 (September 14) appears to be the immediate up-barrier before the weekly top of 35070 (August 31) and the 2023 peak of 35679 (August 1). If the latter is surpassed, the 2022 high of 35824 (February 9) may be sighted before the all-time top of 36952 (January 5, 2022). The day-to-day RSI slipped back below 29.
Top Performers: Apple, UnitedHealth, Microsoft
Worst Performers: 3M, McDonald’s. Honeywell
Resistance levels: 33893 34278 34977 (4H chart)
Support levels: 33219 32586 31805 (4H chart)
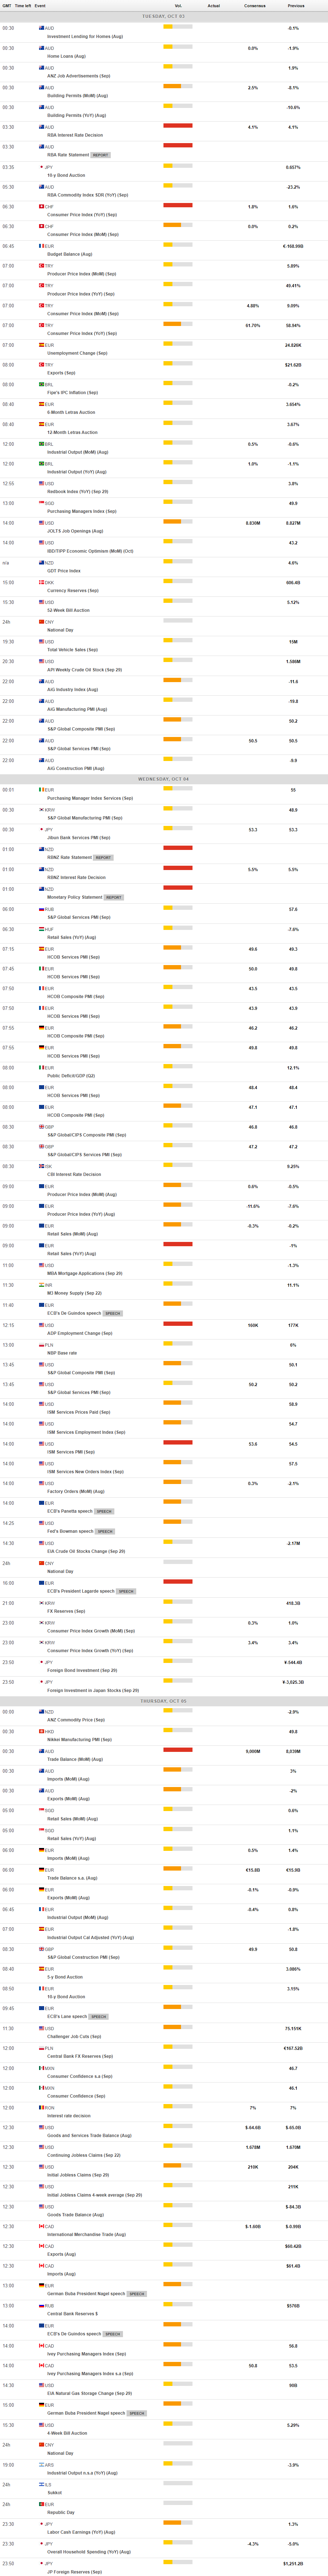
MACROECONOMIC EVENTS
All Information & Updates provided by:

All information relating to the financial markets available on this page has been prepared and issued by FXStreet (Forexstreet SL, Spain, Reg: B62498233) on the basis of publicly available information and all information believed to be reliable and does not conflict with Kuwaiti local laws, and all necessary care has been taken to before the company to ensure that the facts mentioned are correct from the source.
NCM Investment nor any of its directors or employees shall in any way be held responsible for the contents of this news, and the information contained on this page is intended only to provide clients with publicly available information and should not be construed as investment advice, report or analysis and/or constitute an offer or invitation to buy or sell financial instruments of any kind.
RISK WARNING: Forex and CFDs are highly risky leveraged products, as losses can exceed deposits. Please ensure you understand all the risks and take independent advice if necessary. NCM will segregate the clients based on the criteria of the regulator and its bylaws. NCM does not provide any advisory service; the material published does not constitute advice or a recommendation for a transaction in any financial instrument. NCM accepts no responsibility for any use of the content presented and any consequences of that use. Anyone acting on the information provided does so at their own risk.