
- Contact Us:
-

-

-

-


Daily Market Updates
04 Oct 2023
USDJPY
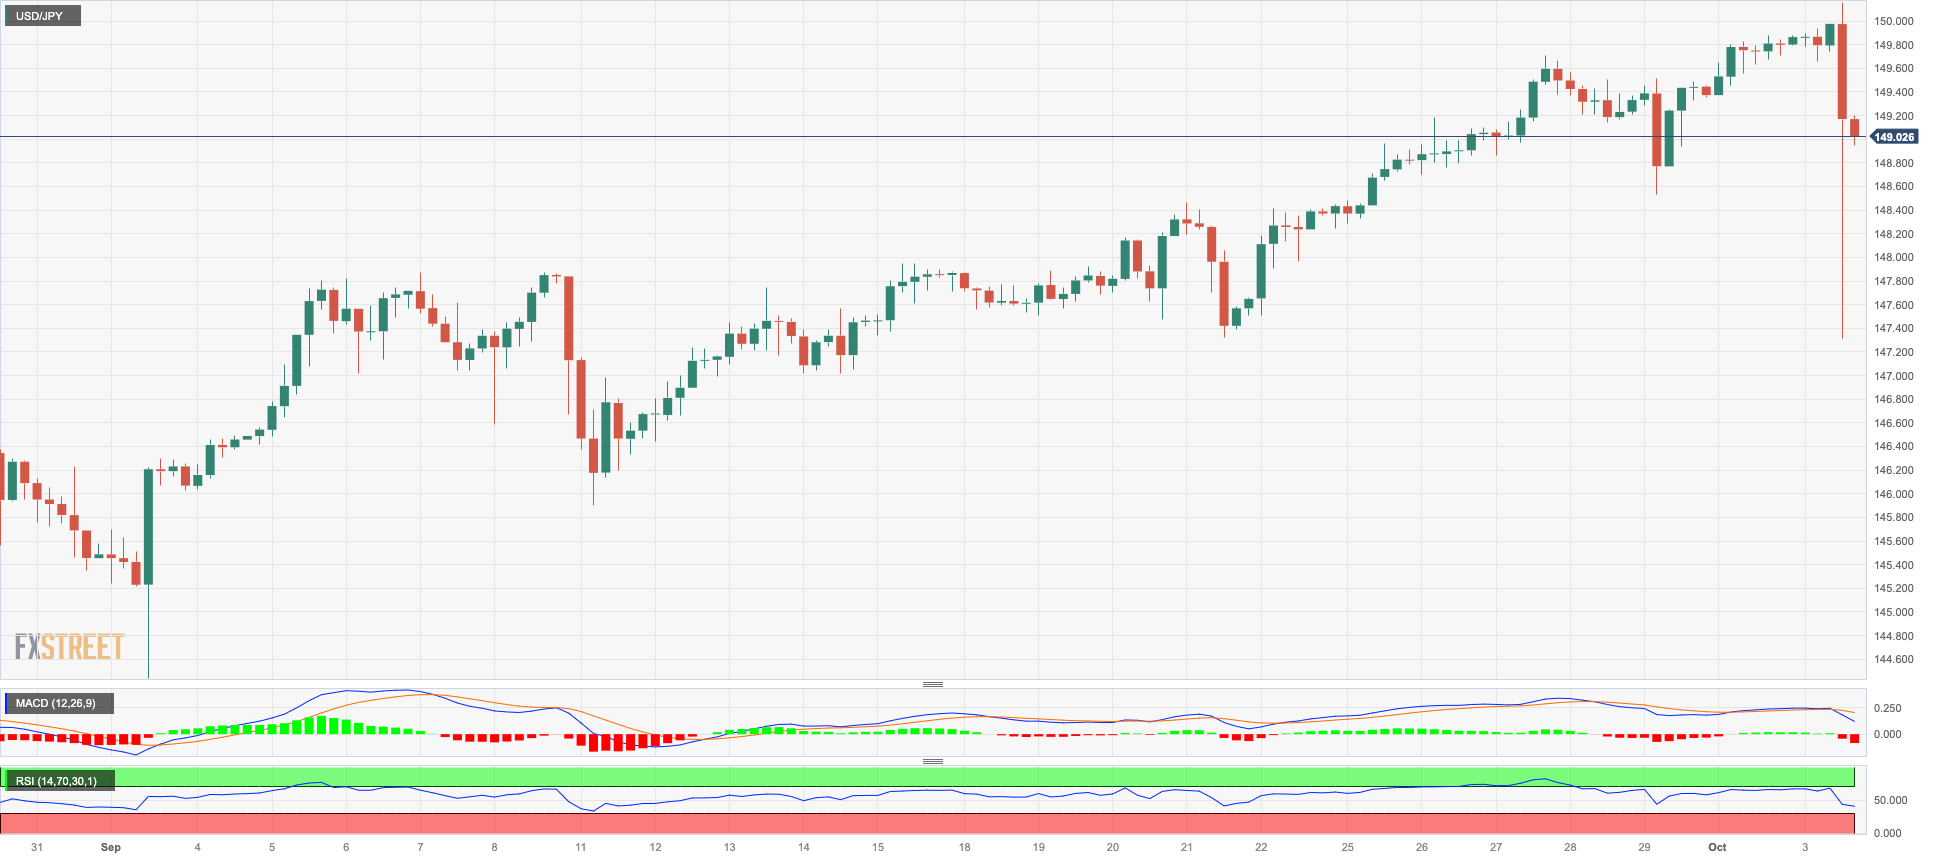
USD/JPY retreated sharply soon after hitting new highs in levels last seen in October 2022, north of the key 150.00 hurdle on Tuesday.
The upward momentum in the greenback in combination with the intense move higher in US yields across the curve bolstered the upside bias in spot, although the eventual trespass of the 150.00 hurdle and the subsequent sudden drop bolstered the perception of FX intervention by the BoJ and MoF.
There were no data releases in the Japanese docket on Tuesday.
The break above the 2023 high at 150.16 (October 3) should prompt USD/JPY to embark on a potential test of the 2022 top at 151.94 (21 October). On the other hand, the weekly low of 145.89 (September 11) comes ahead of the 55-day SMA at 145.51 and the September low of 144.43 (September 1). The breakdown of the latter could open a move to the interim 100-day SMA at 143.40 before the August low of 141.50 (August 7). From here, the key 200-day SMA at 138.17 is the next target before the July low of 137.23 (14 July). The RSI on the daily chart dropped to the proximity of 60.
Resistance levels: 150.16 151.94 155.80 (4H chart)
Support levels: 147.27 145.89 144.43 (4H chart)
GBPUSD
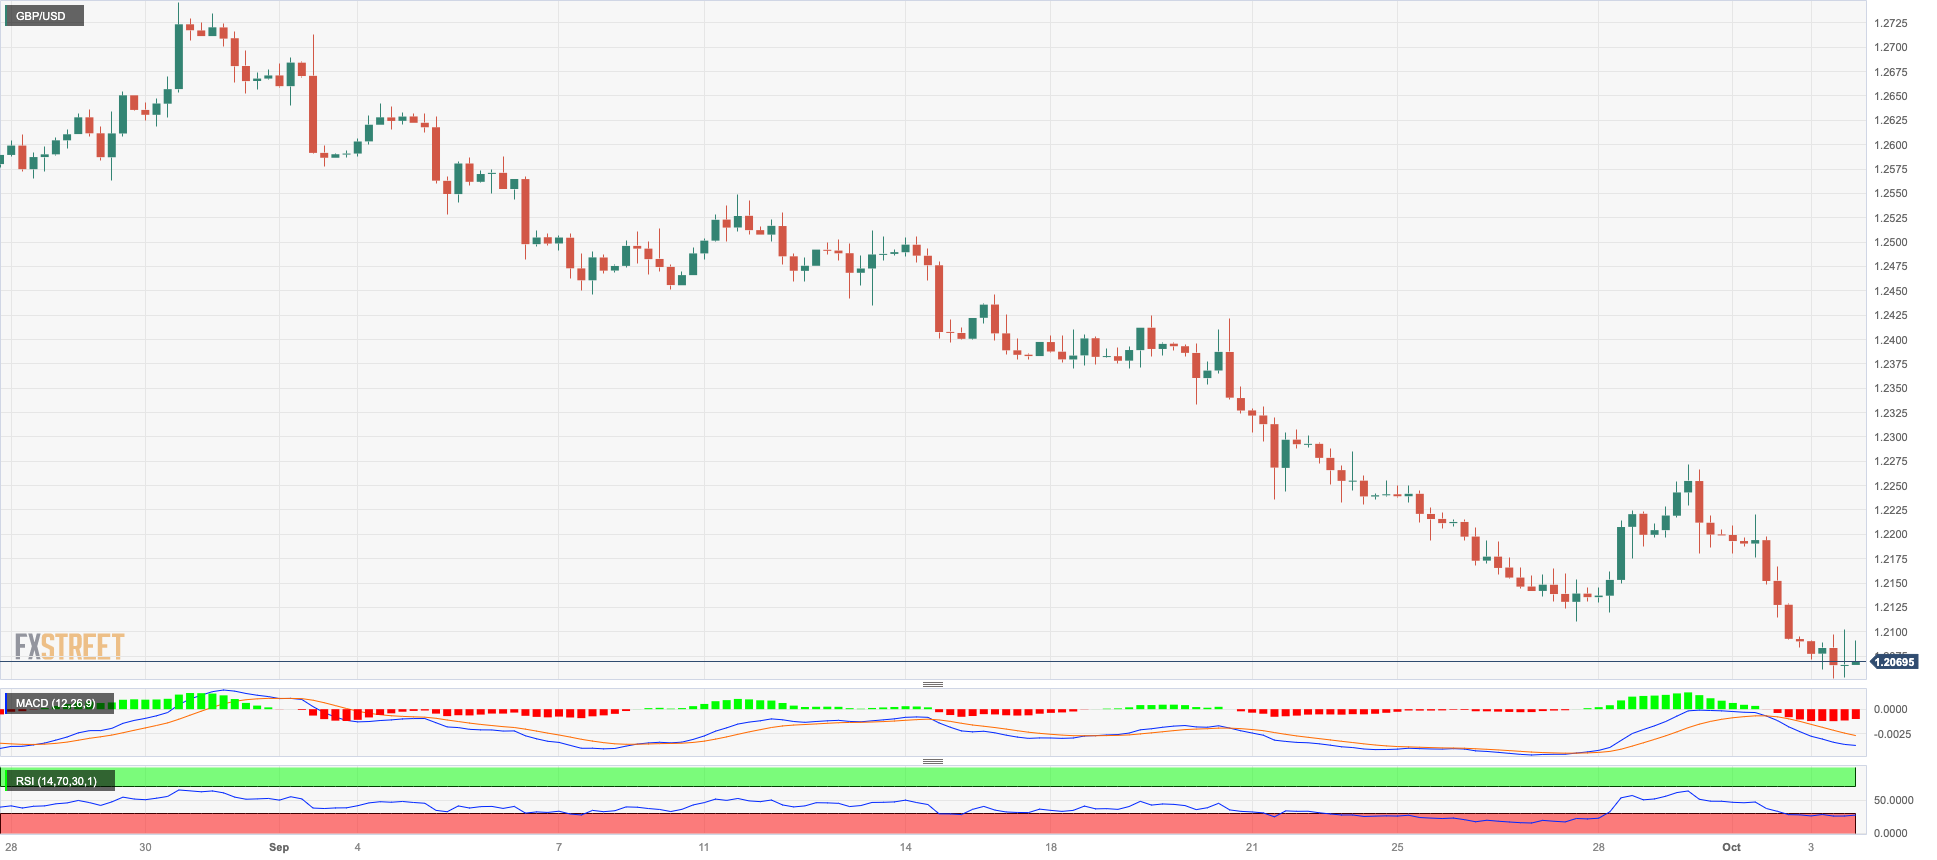
GBP/USD dropped further and clinched new multi-month lows in the mid-1.2000s on Tuesday.
Once again, the persevering upside momentum in the greenback kept the appetite for riskier assets depressed and sponsored the second daily pullback in a row in Cable.
The UK calendar was empty on Tuesday.
If GBP/USD breaks below the October low of 1.2052 (October 2), it might return to the significant round milestone of 1.2000 before falling to the 2023 low of 1.1802 (March 8). Instead, the 200-day SMA at 1.2434 is the first hurdle to clear, followed by the minor weekly high at 1.2548 (September 11). The preliminary 55-day and 100-day SMAs are at 1.2584 and 1.2613, respectively, ahead of weekly highs of 1.2746 (August 30), 1.2818 (August 10), and 1.2995 (July 27), all of which precede the critical 1.3000 level. The daily RSI stayed in the oversold zone near 23.
Resistance levels: 1.2201 1.2271 1.2421 (4H chart)
Support levels: 1.2052 1.2010 1.1802 (4H chart)
AUDUSD
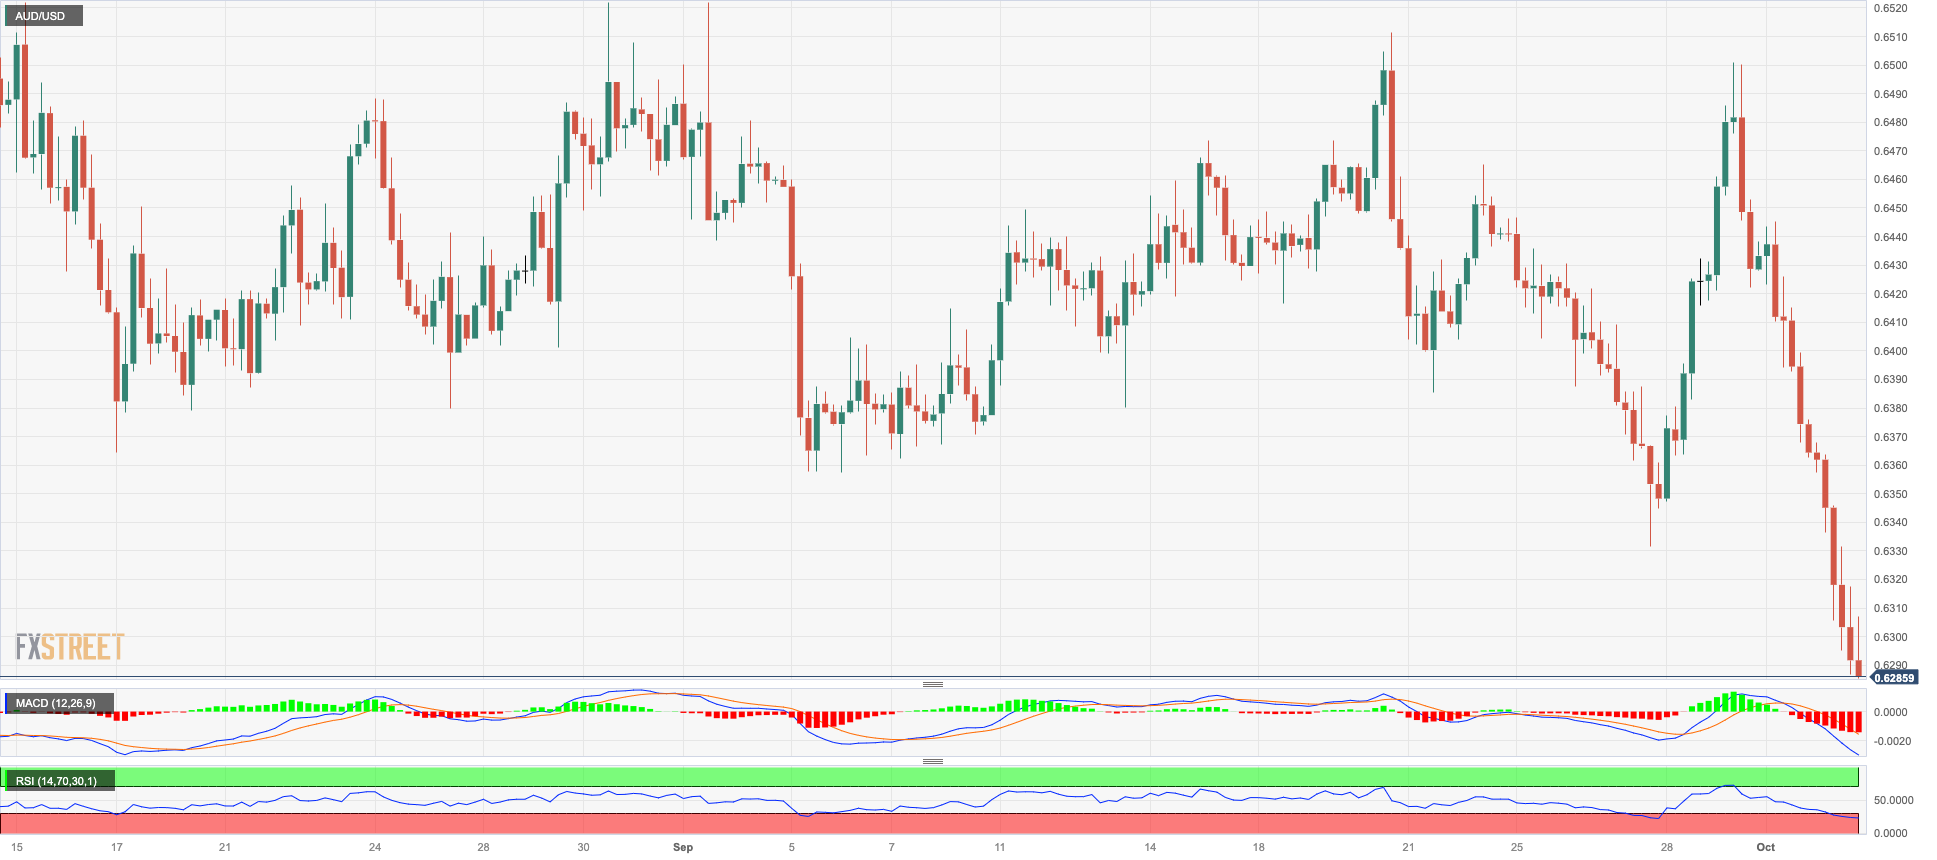
Extra strength in the greenback weighed further on the high-beta currencies and forced AUD/USD to give away further ground and reach new lows for the year in the 0.6290./85 band on Tuesday.
The Aussie dollar also derives extra selling pressure from the generalized bearishness noted in the commodity complex, while the lack of positive news from China also contributed to the sour mood.
Around the RBA, the central bank left its OCR unchanged at 4.10%, as broadly expected. In addition, Governor Bullock stated that there might be a need for additional tightening in monetary policy to ensure the return of inflation to its target within a reasonable timeframe. However, she emphasized that this would remain contingent on the data and the ongoing evaluation of risk factors.
In the docket, advanced Building Permits are seen expanding 7.0% MoM in August, while Home Loans rose 2.6% in the same month and Investment Lending for Homes rose 1.6% also in August.
The most immediate danger to the AUD/USD is the 2023 low of 0.6286 (October 3), followed by the November 2022 low of 0.6272 (November 7) and the 2022 low of 0.6179 (October 13). On the flip side, the next level of resistance on the upswing is at the weekly high of 0.6522 (August 30), followed by another weekly top of 0.6616 (August 10) and the 200-day SMA of 0.6684. Further increases might push the pair to its July peak of 0.6894 (July 14), which is slightly ahead of the June high of 0.6899 (June 16) and the key milestone of 0.7000. The breakout of this region exposes the weekly top of 0.7029 (February 14) and the 2023 peak of 0.7157 (February 2). The day-to-day RSI decreased to the sub-35 area.
Resistance levels: 0.6423 0.6501 0.6511 (4H chart)
Support levels: 0.6286 0.6272 0.6210 (4H chart)
GOLD
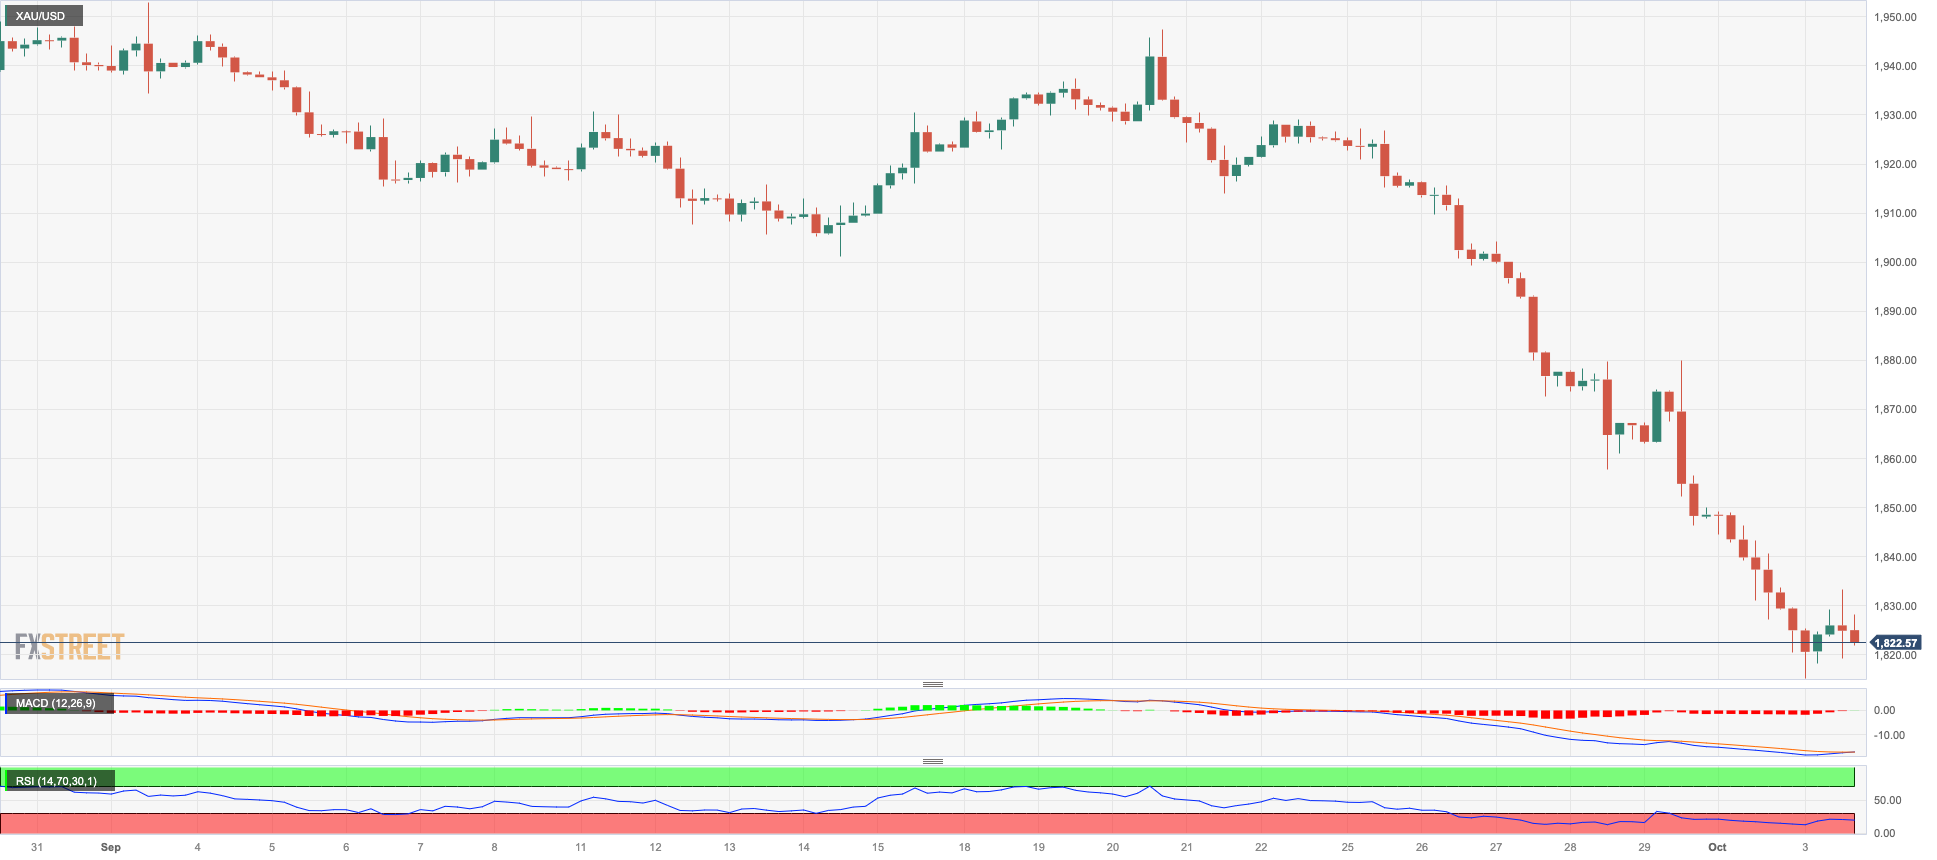
The precious metal had no relief on Tuesday either.
In fact, the troy ounce of gold fell for the seventh session in a row, revisiting the region of seven-month lows around $1815 in response to the usual suspects, namely, the stronger dollar, higher yields, and hawkish Fedspeak.
Furthermore, another daily pullback in bullion was accompanied by an extra upward impulse in the greenback, which lifted the USD Index (DXY) to new 2023 peaks and increased US yields, all of which appear to have been bolstered by hawkish comments by voting hawk L. Mester (Cleveland).
The next target for the gold bears is the 2023 low at $1804 (February 28), just ahead of the key reversal zone at $1800. On the opposite side, any upside attempt is likely to first encounter resistance around the critical 200-day SMA at $1927 before the weekly high at $1947 (September 20) and the September top at $1953 (September 1). The breakout from the latter could prompt the metal to attack the July peak at $1987 (July 20), which is just below the psychological $2000 level. The 2023 high is $2067 (May 4), seconded by the 2022 top at $2070 (March 8) and the all-time peak of $2075 (August 7, 2020).
Resistance levels: $1879 $1910 $1947 (4H chart)
Support levels: $1815 $1804 $1784 (4H chart)
CRUDE WTI
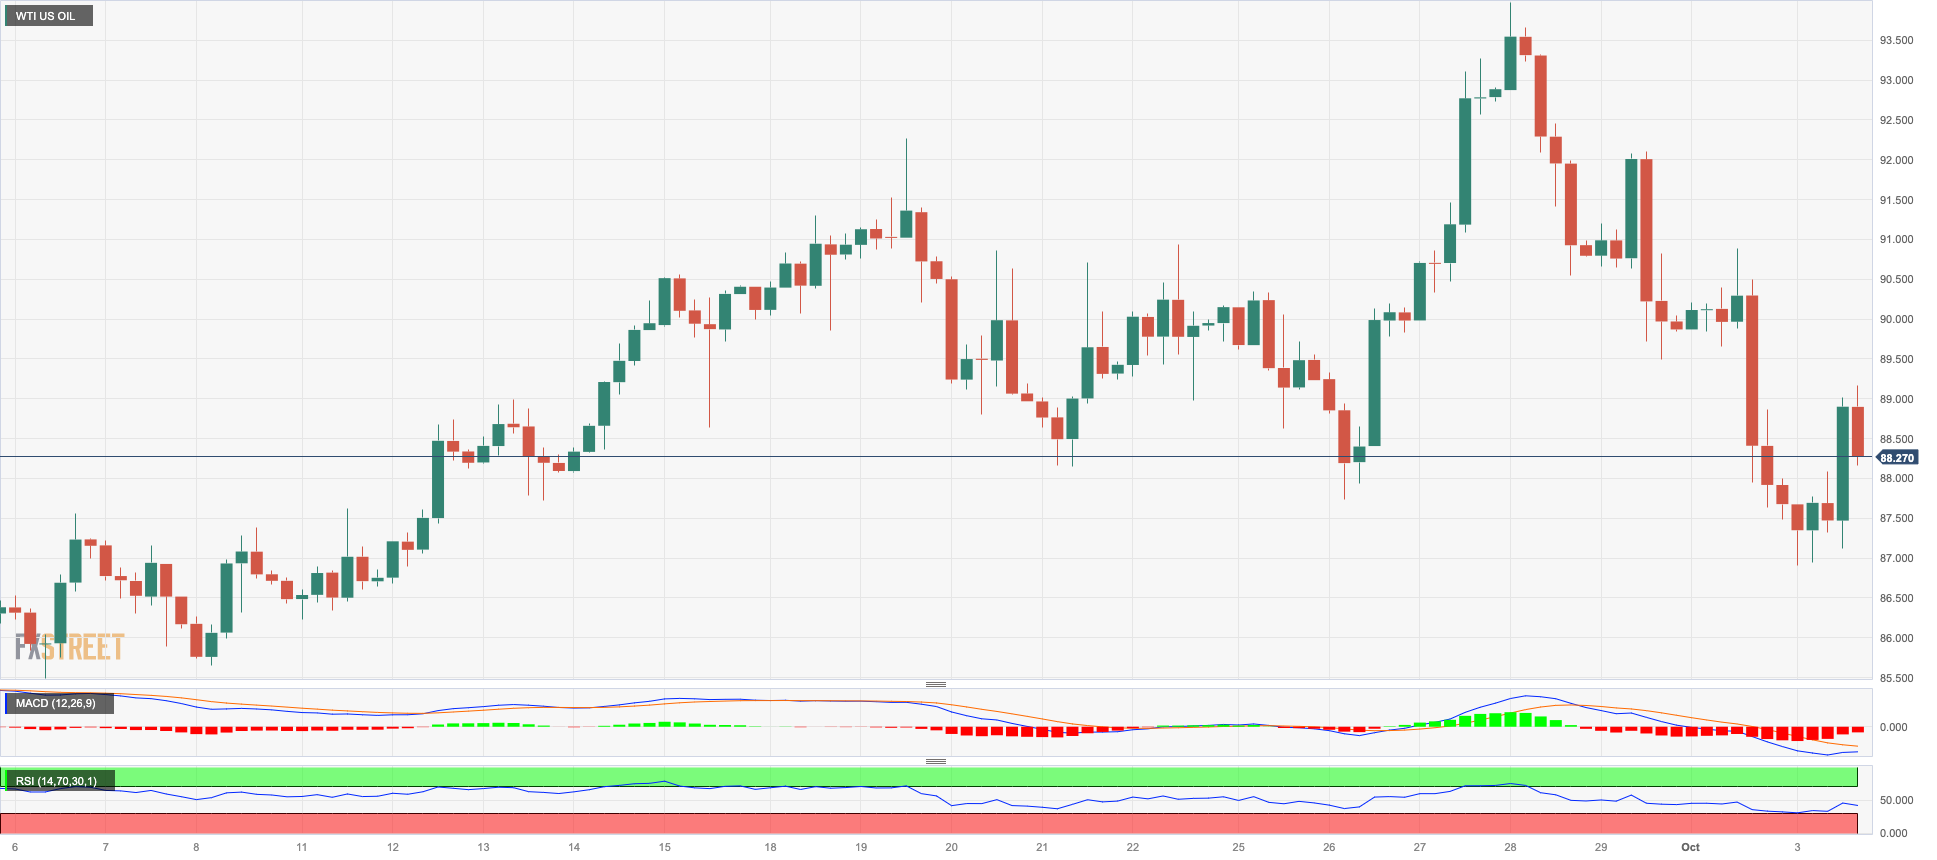
The prices of WTI charted a decent advance and left behind three consecutive daily drops on Tuesday.
Indeed, price action around the American benchmark for sweet light crude oil came in tandem with the inconclusive performance of the greenback, higher yields, and the prospects of further tightening by the Federal Reserve.
In addition, demand concerns stayed well and sound, as did the usual tight supply narrative, while expectations of any surprise at the OPEC meeting on Wednesday remained muted.
In the docket, the API will report on weekly US crude oil inventories in the week to September 29 following the closing bell on Wall Street.
Breaking above the 2023 high of $94.99 (September 28) could prompt WTI prices to challenge the weekly top of $97.65 (August 30, 2022) before hitting the critical $100.00 mark per barrel. In contrast, the October low of $87.81 (October 3), emerges prior to the temporary 55-day SMA at $84.16. If the latter is broken, the August low at $77.64 (August 24) will be visible before the important 200-day SMA at $77.42 and the weekly low at $73.89 (July 17). South of this, the June low at $66.85 (June 12) becomes visible, ahead of the 2023 low at $63.61 (May 4).
Resistance levels: $93.06 $94.99 $97.65 (4H chart)
Support levels: $87.73 $86.37 $84.99 (4H chart)
GER40
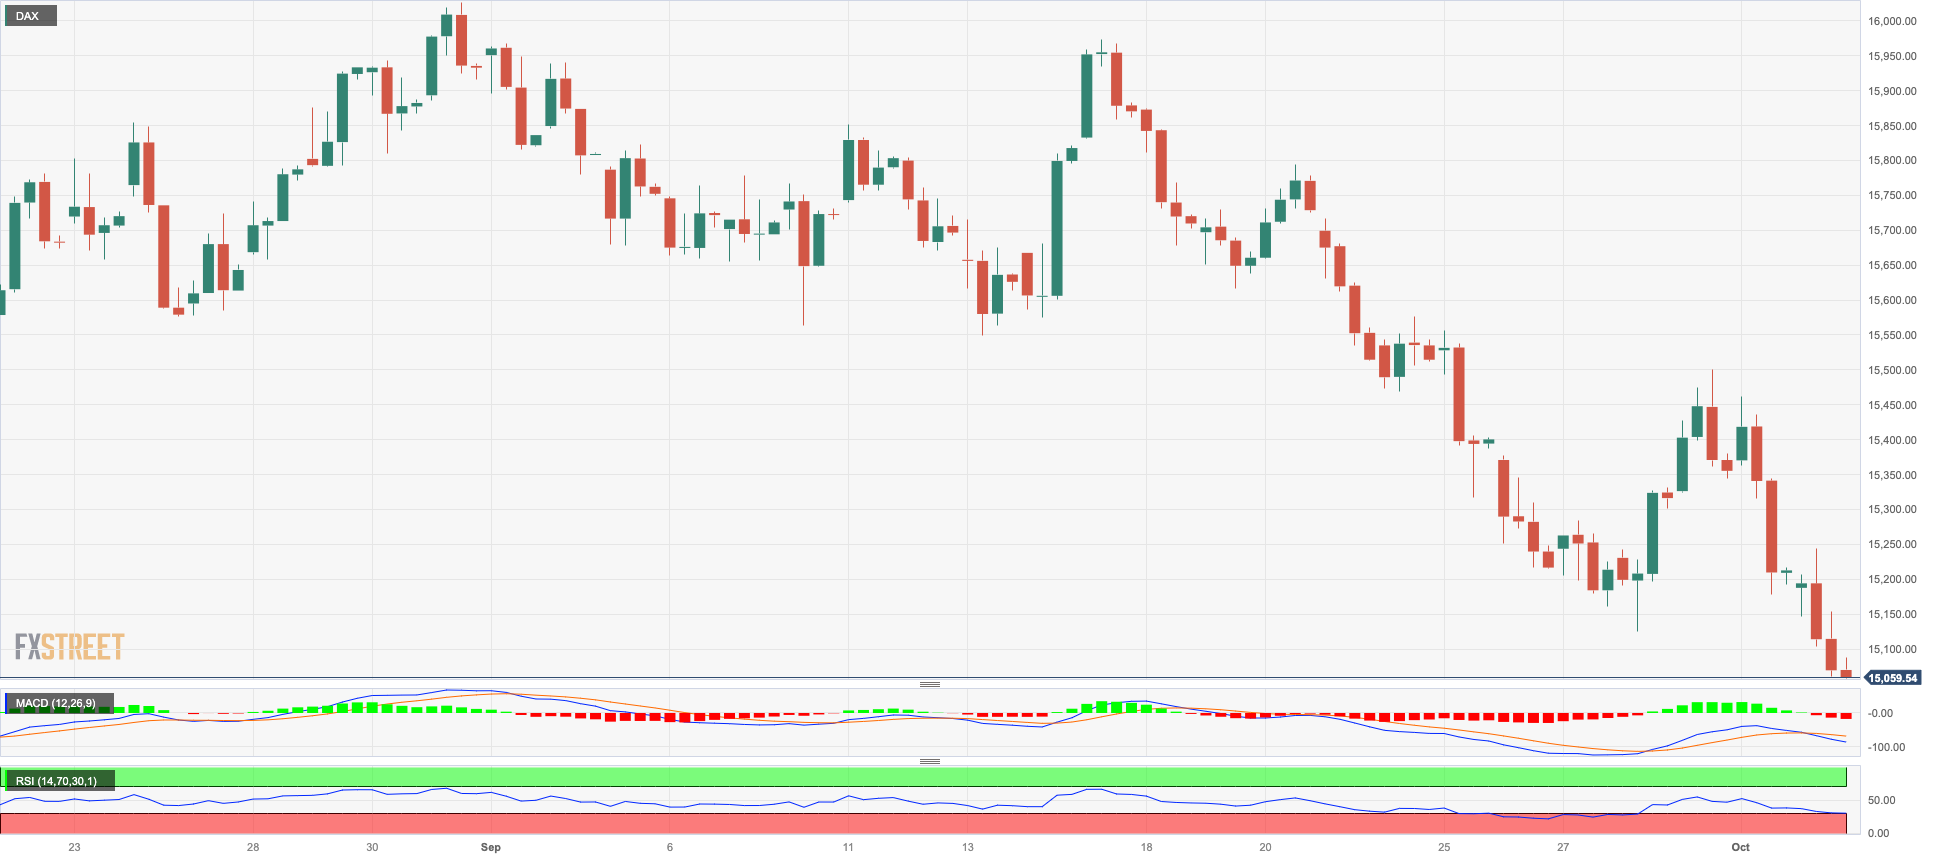
German equities suffered another session of losses on Tuesday, dragging the reference DAX40 to new seven-month lows around the 15000 neighbourhood.
Sellers remained in control of the sentiment in the European stock markets so far in the first half of the week, as recession and stagflation concerns kept doing the rounds in collaboration with higher yields, rising crude oil prices, and prospects for extra tightening by the Federal Reserve.
In addition, another source of concern remains the still uncertain economic recovery in China, as the latest set of PMI readings failed to reignite any hope of a near-term rebound.
The downtick in the index also came in stark contrast to the advance in the 10-year bund yields, which flirted with the 3.00% mark for the first time since July 2011.
If sellers take control, the DAX40 might revisit the October bottom of 15074 (October 3), before moving on to the March low of 14458 (March 20) and the December 2022 low of 13791 (December 20), all before the 2022 low of 11862 (September 28). On the bright side, the 200-day SMA at 15590 seems to be the first stumbling block ahead of the September high of 15989 (September 14), followed by weekly tops of 16042 (August 31) and 16060 (August 10). A breakout of this level might lead to a retest of the all-time peak of 16528 (July 31). On the daily chart, the RSI dropped to the proximity of 31.
Best Performers: Henkel VZO, Hannover Rueck SE, Dr Ing hc F Porsche Prf
Worst Performers: : Zalando SE, RWE AG ST, Siemens Energy AG
Resistance levels: 15515 15810 15989 (4H chart)
Support levels: 15074 14809 14458 (4H chart)
NASDAQ
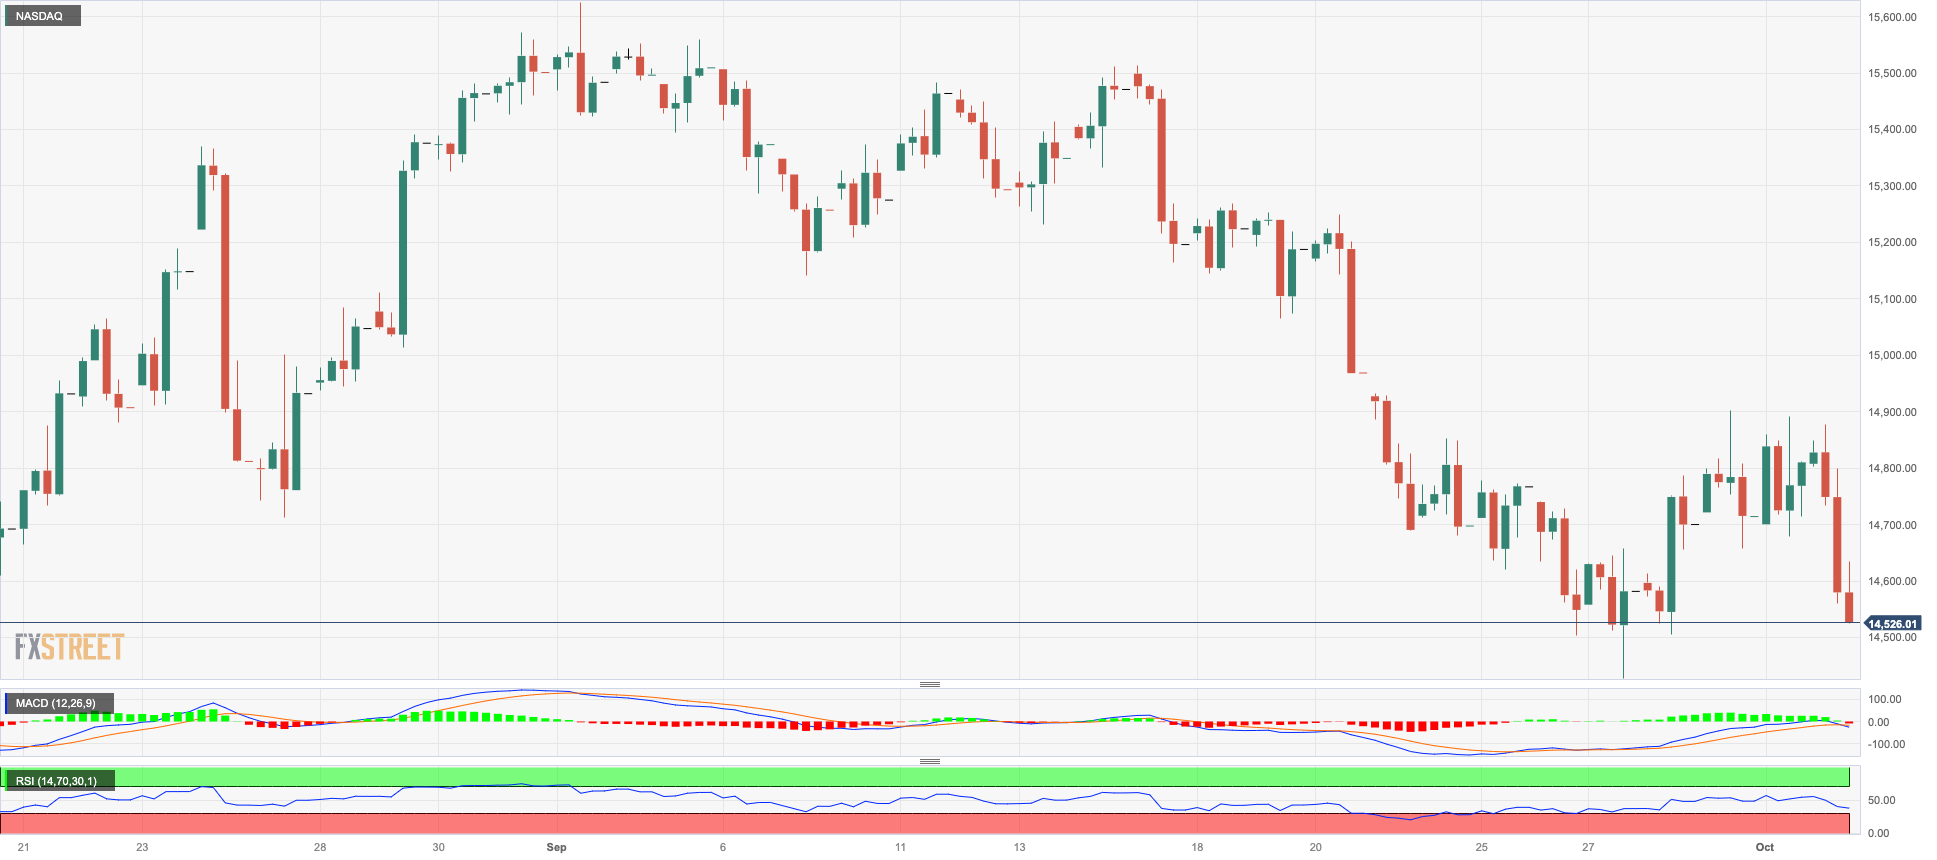
This time, the Nasdaq 100 followed its US peers and retreated markedly to the area of three-day lows around 14500 on Tuesday.
The firm tone of the greenback, US yields navigating multi-year tops, and the broad perception that the Fed might hike rates before the end of the year all hurt investors’ sentiment and dragged the index lower.
Further gains could drive the Nasdaq 100 to the 55-day SMA of 15191, ahead of the weekly high of 15512 (September 14) and the September top of 15618 (September 1). The weekly peak of 15803 (July 31) is north of here, ahead of the 2023 high of 15932 (July 19) and the round mark of 16000. On the other hand, a fall below the September low of 14432 (September 27) could re-target the weekly low of 14283 (June 7), ahead of the 200-day SMA at 13586 and the April low of 12724 (April 25). Once this zone is breached, the index could confront the March low of 11695 (March 13) before the 2023 low of 10696 (January 6). The RSI on the daily chart retreated to the sub-38 zone.
Top Gainers: American Electric Power, Xcel Energy, Intel
Top Losers: Zscaler, Airbnb, CrowdStrike Holdings
Resistance levels: 14901 15512 15618 (4H chart)
Support levels: 14432 14283 13520 (4H chart)
DOW JONES
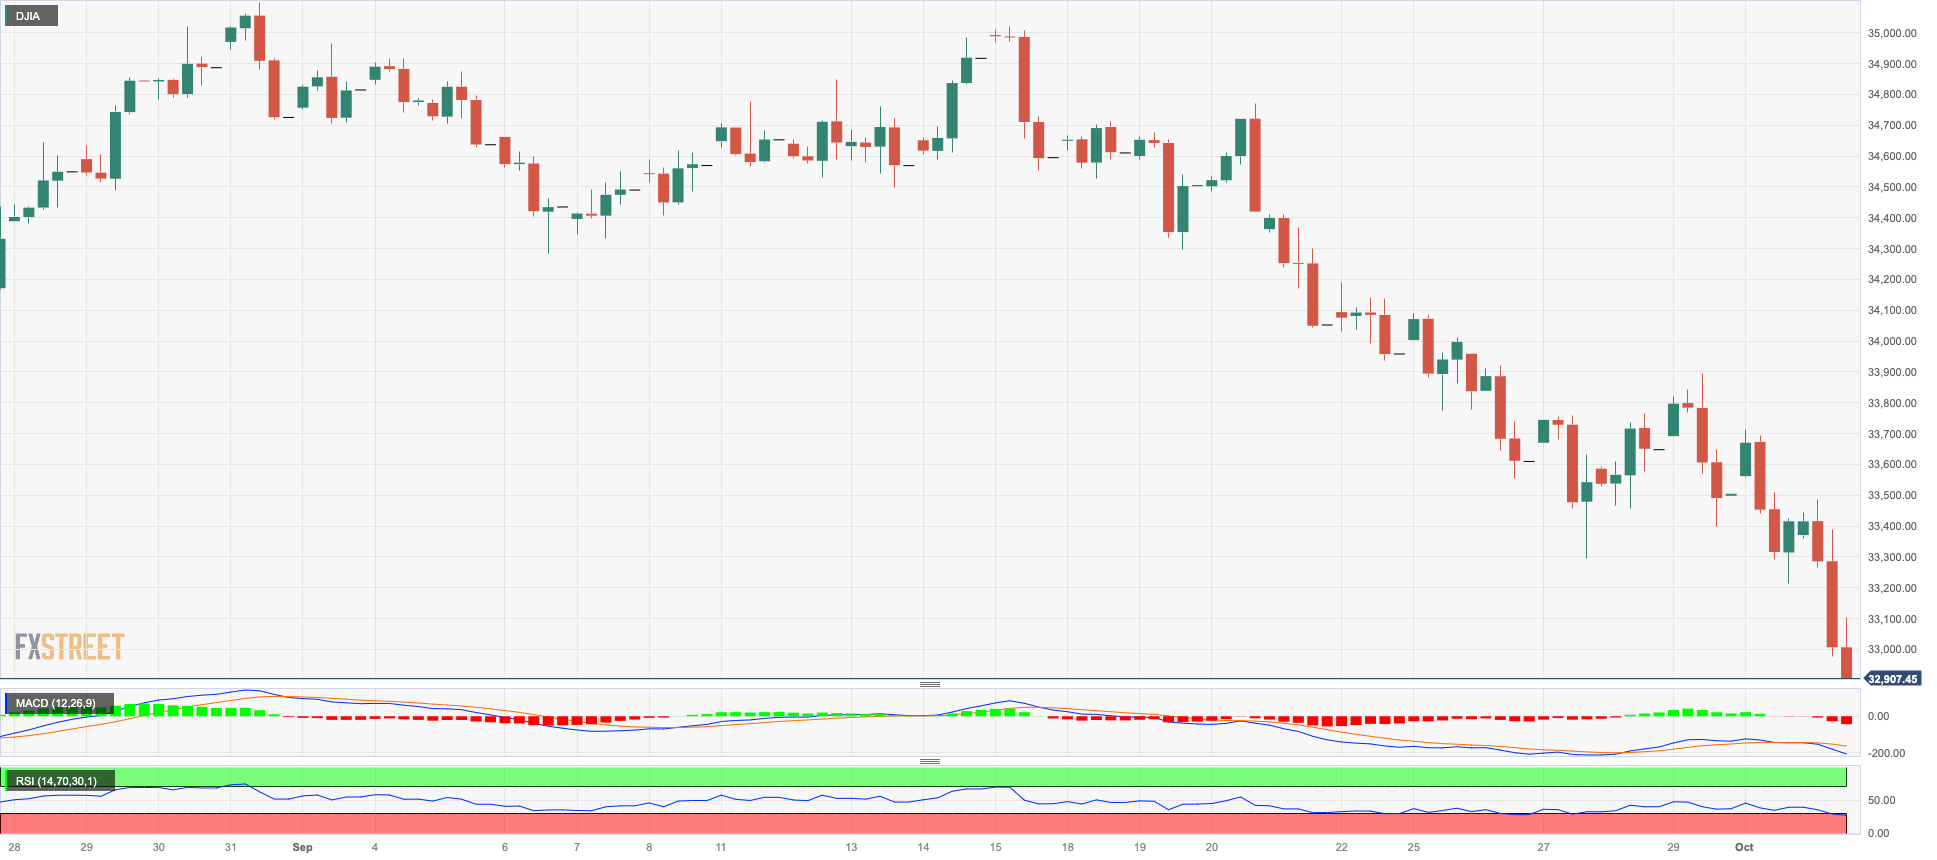
US stocks tracked by the Dow Jones extended the leg lower and retreated to four-month lows in the sub-33000 region on turnaround Tuesday, consolidating at the same time the three-week negative streak.
The sour sentiment prevailed among investors amidst a persistent risk-off mood, a stronger dollar, higher yields, and extra hawkish comments from Fed speakers, this time from Cleveland Fed L. Mester, who said she was inclined to a rate hike at the next gathering.
In addition, cautiousness among market participants is expected to pick up pace as we get closer to the release of the most-watched US Nonfarm Payrolls (October 6).
On the whole, the Dow Jones dropped 1.21% to 33028, the S&P500 retreated 1.35% to 4230, and the tech-focused Nasdaq Composite deflated 1.84% to 13062.
The Dow Jones hit a new low at 32983 on October 3. The loss of this level exposes a deeper fall to the May low of 32586 (May 25) and the 2023 low of 31429 (March 15). In contrast, the September high of 34977 (September 14) appears to be the immediate upside barrier ahead of the weekly top of 35070 (August 31) and the 2023 peak of 35679 (August 1). If the latter is surpassed, the 2022 high of 35824 (February 9) could come into view before the all-time top of 36952 (January 5, 2022). The everyday RSI dropped further into the oversold zone near the 24 region.
Top Performers: Intel, Boeing, Procter&Gamble
Worst Performers: Goldman Sachs, Microsoft, American Express
Resistance levels: 33893 34273 34977 (4H chart)
Support levels: 32983 32586 31805 (4H chart)
MACROECONOMIC EVENTS
All Information & Updates provided by:

All information relating to the financial markets available on this page has been prepared and issued by FXStreet (Forexstreet SL, Spain, Reg: B62498233) on the basis of publicly available information and all information believed to be reliable and does not conflict with Kuwaiti local laws, and all necessary care has been taken to before the company to ensure that the facts mentioned are correct from the source.
NCM Investment nor any of its directors or employees shall in any way be held responsible for the contents of this news, and the information contained on this page is intended only to provide clients with publicly available information and should not be construed as investment advice, report or analysis and/or constitute an offer or invitation to buy or sell financial instruments of any kind.
RISK WARNING: Forex and CFDs are highly risky leveraged products, as losses can exceed deposits. Please ensure you understand all the risks and take independent advice if necessary. NCM will segregate the clients based on the criteria of the regulator and its bylaws. NCM does not provide any advisory service; the material published does not constitute advice or a recommendation for a transaction in any financial instrument. NCM accepts no responsibility for any use of the content presented and any consequences of that use. Anyone acting on the information provided does so at their own risk.