
- Contact Us:
-

-

-

-


Daily Market Updates
05 Oct 2023
USDJPY
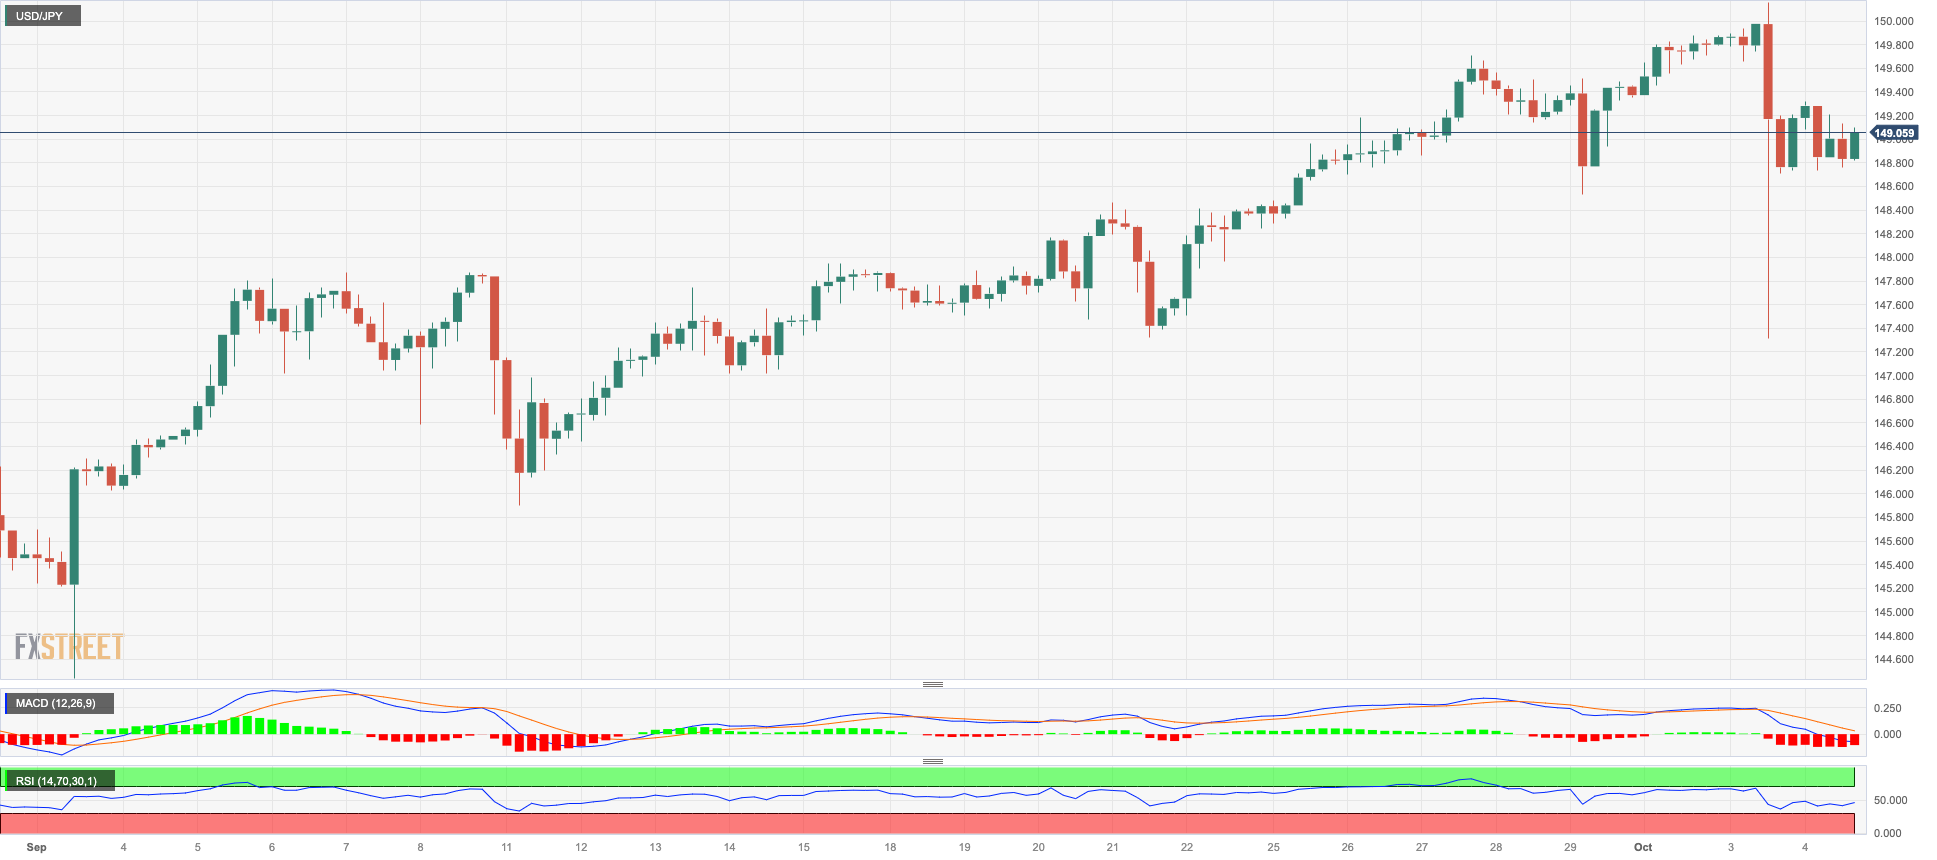
USD/JPY could not sustain the earlier advance to the 149.30 region and succumbed to the renewed buying pressure in the Japanese yen, ending the session with humble gains near 149.00.
In fact, the marked retracement in the greenback, declining US yields across the curve, and concerns over further FX intervention by the BoJ and the Japanese government (despite both parties declining to affirm or reject this) all contributed to the second consecutive daily drop in the pair.
In the Japanese calendar, the final Jibun Bank Services PMI came in at 53.8 in September.
The break above the 2023 high at 150.16 (October 3) could drive USD/JPY to test the 2022 high at 151.94 (October 21). Having said that, the weekly low of 145.89 (September 11), aligns ahead of the 55-day SMA of 145.68 and the September low of 144.43 (September 1). If the latter is breached, the market might go to the intermediate 100-day SMA at 143.51 prior to the August low of 141.50 (August 7). South from here emerges the July low of 137.23 (14 July) before the crucial 200-day SMA at 138.25. The RSI on the daily chart dropped below 59.
Resistance levels: 150.16 151.94 155.80 (4H chart)
Support levels: 147.27 145.89 144.43 (4H chart)
GBPUSD
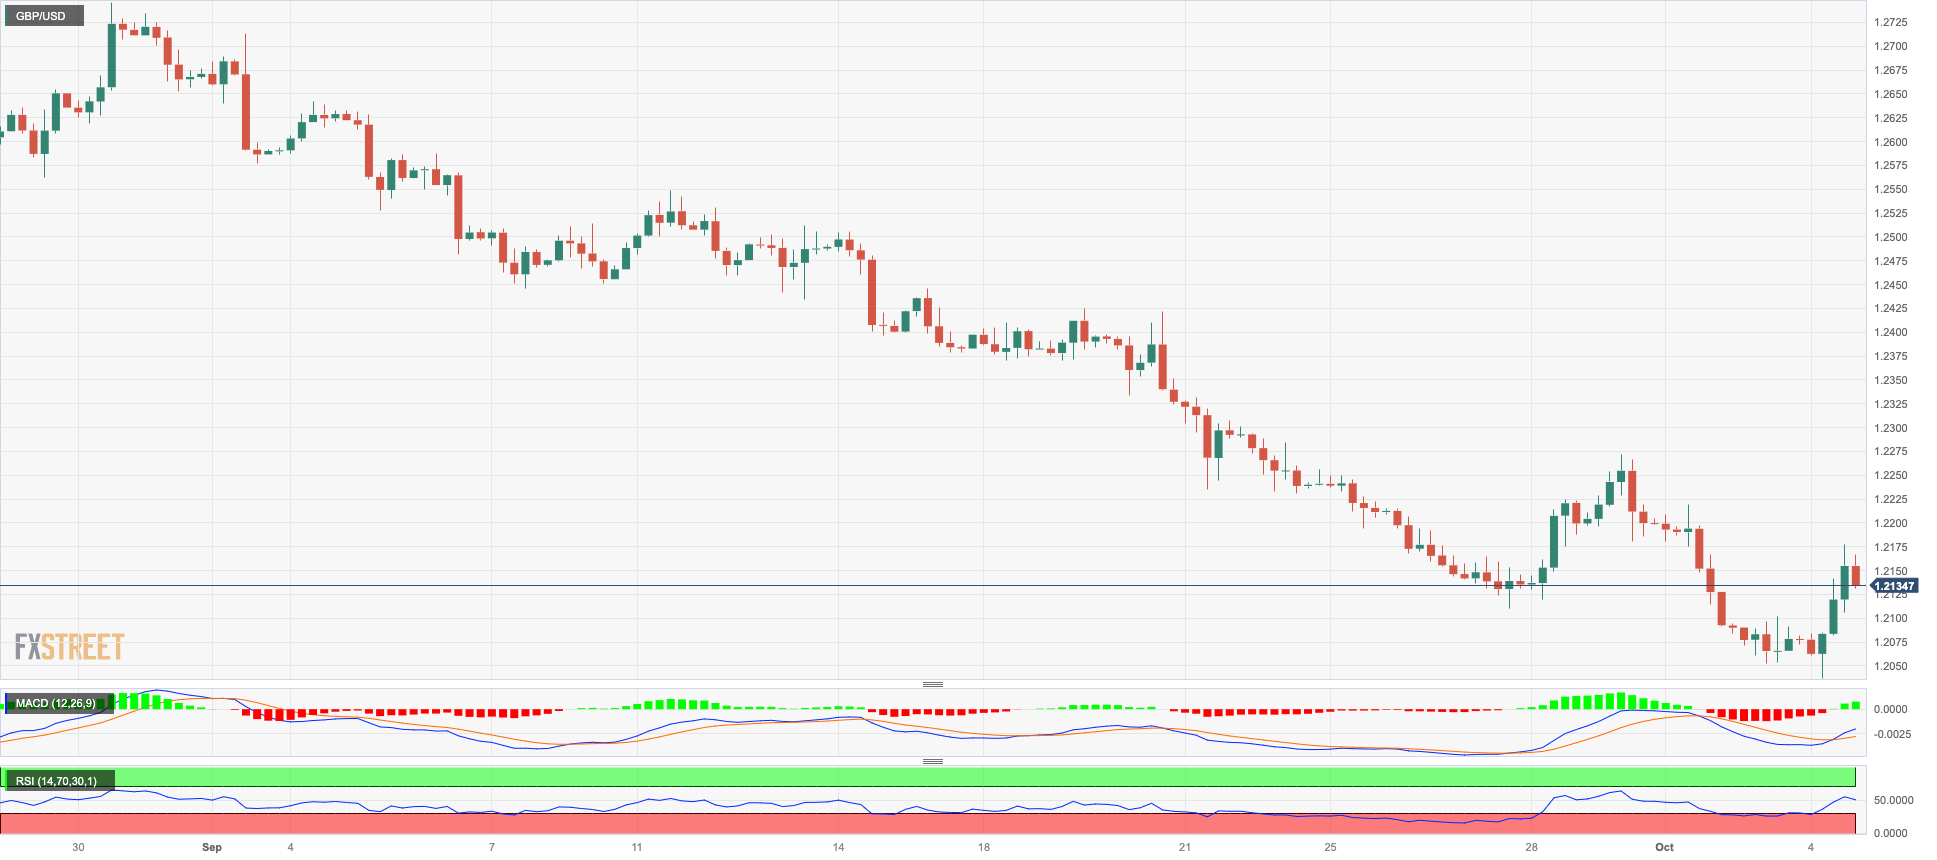
In line with the rest of its risk-linked peers, the British pound managed to regain traction and encouraged GBP/USD to bounce to two-day highs near 1.2180 on Wednesday.
In fact, the intense correction in the greenback helped the quid rebound from recent multi-month lows in Cable, although the pair is expected to remain under scrutiny in light of the still strong upside momentum surrounding the buck.
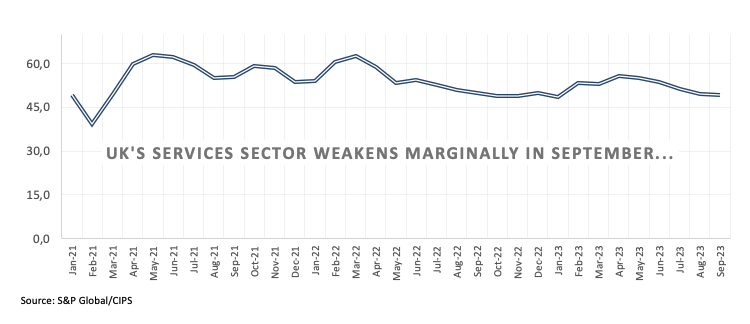
In the UK, the always-relevant final S&P Global/CIPS Services PMI eased marginally to 49.3 in September (from 49.5).
If GBP/USD falls below the October low of 1.2037 (October 3), it could return to the significant round milestone of 1.2000 before falling to the 2023 low of 1.1802 (March 8). Instead, the 200-day SMA at 1.2435 is the first hurdle to overcome, followed by the minor weekly high at 1.2548 (September 11). The preliminary 55-day and 100-day SMAs are at 1.2570 and 1.2610 respectively, ahead of the weekly tops at 1.2746 (30 ), 1.2818 (August 10) and 1.2995 (July 27), all ahead of the critical 1.3000 level. The daily RSI advanced to the 34 region.
Resistance levels: 1.2176 1.2271 1.2421 (4H chart)
Support levels: 1.2037 1.2010 1.1802 (4H chart)
AUDUSD
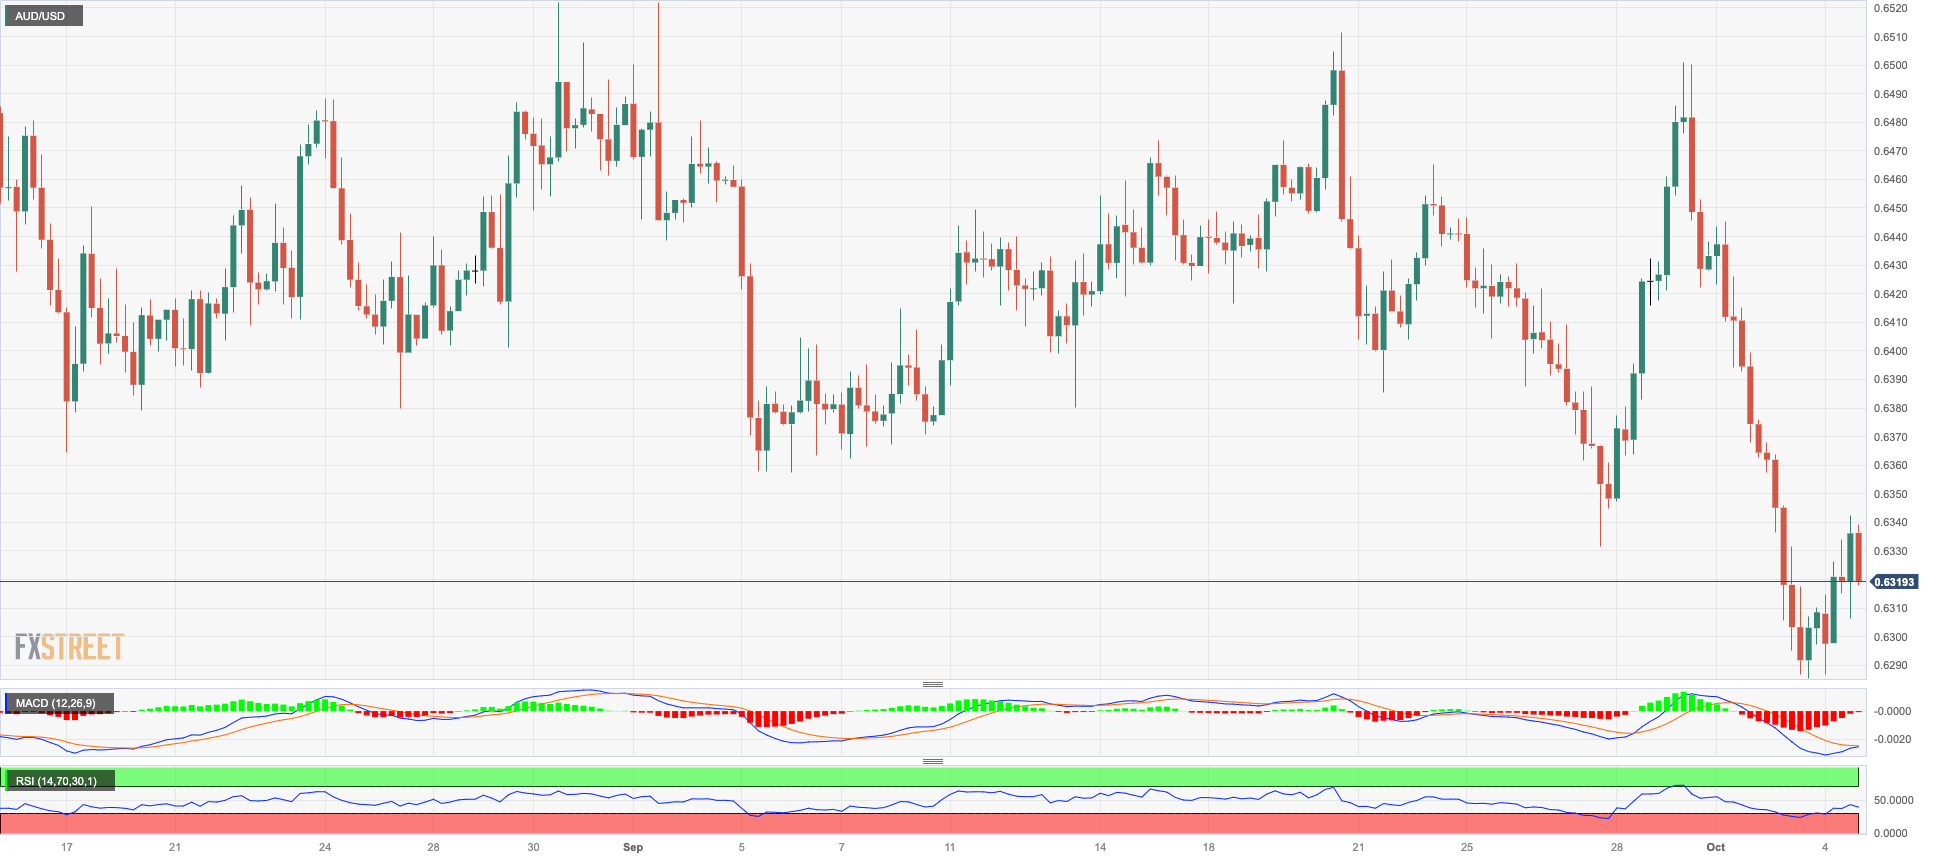
AUD/USD regained some balance and reversed the pessimism seen in the first half of the week, bouncing off the area of yearly lows near 0.6280 to reclaim the 0.6300 barrier and above on Wednesday.
The daily uptick in the pair came in spite of the generalized bearish performance in the commodity universe and exclusively followed the renewed weakness in the greenback.
In Oz, the final Judo Bank Services PMI improved to 51.8 in September, and the Ai Group Industry Index climbed to -3.5 in the same month (from -11.6).
The most immediate threat to AUD/USD is the 2023 low of 0.6285 in 2023 (October 3), followed by the November 2022 low of 0.6272 (7 November) and the 2022 low of 0.6179 (October 13). On the other side, the next resistance is at the weekly high of 0.6522 (August 30), followed by another weekly top of 0.6616 (August 10) and the 200-day SMA of 0.6682. Further rises could drive the pair to its July peak of 0.6894 (July 14), slightly ahead of the June high of 0.6899 (June 16) and the important milestone of 0.7000. The breakout of this region exposes the weekly top at 0.7029 (February 14) and the 2023 peak at 0.7157 (February 2). The day-to-day RSI climbed to the vicinity of 40.
Resistance levels: 0.6421 0.6501 0.6511 (4H chart)
Support levels: 0.6285 0.6272 0.6210 (4H chart)
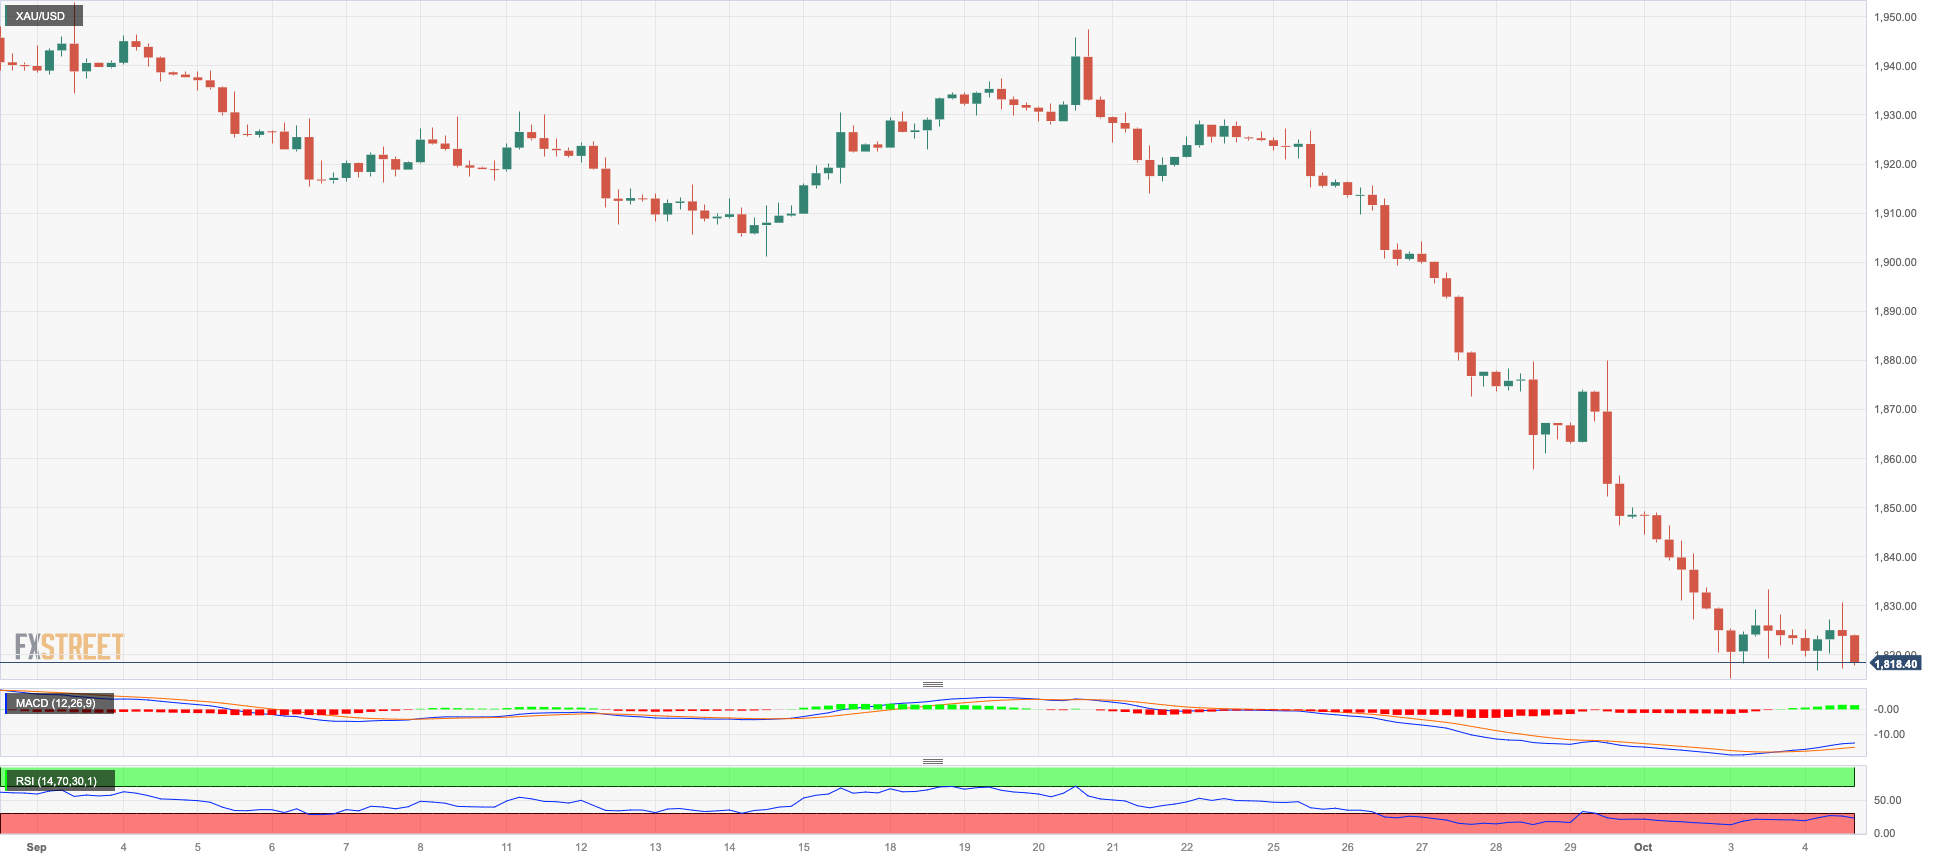
GOLD
Another negative session saw prices of the yellow metal retreat marginally and revisit the area of recent lows around $1815 per troy ounce on Wednesday.
The 8th consecutive drop in bullion came despite the corrective decline in the greenback and the knee-jerk in US yields across the curve, while it seems to have followed broad-based speculation that the Federal Reserve might keep its restrictive stance for longer than previously estimated.
The 2023 low at $1804 (February 28) is the next target for gold bears, just ahead of the important reversal zone around $1800. On the other hand, any upward move is anticipated to be met with resistance near the important 200-day SMA at $1927 before the weekly high at $1947 (September 20) and the September top at $1953 (September 1). The metal might assault the July top at $1987 (July 20), which is just below the psychological $2000 mark, if it breaks out from the latter. The peak in 2023 is $2067 (May 4), followed by the high in 2022 at $2070 (March 8) and the all-time top of $2075 (August 7, 2020).
Resistance levels: $1879 $1908 $1947 (4H chart)
Support levels: $1815 $1804 $1784 (4H chart)
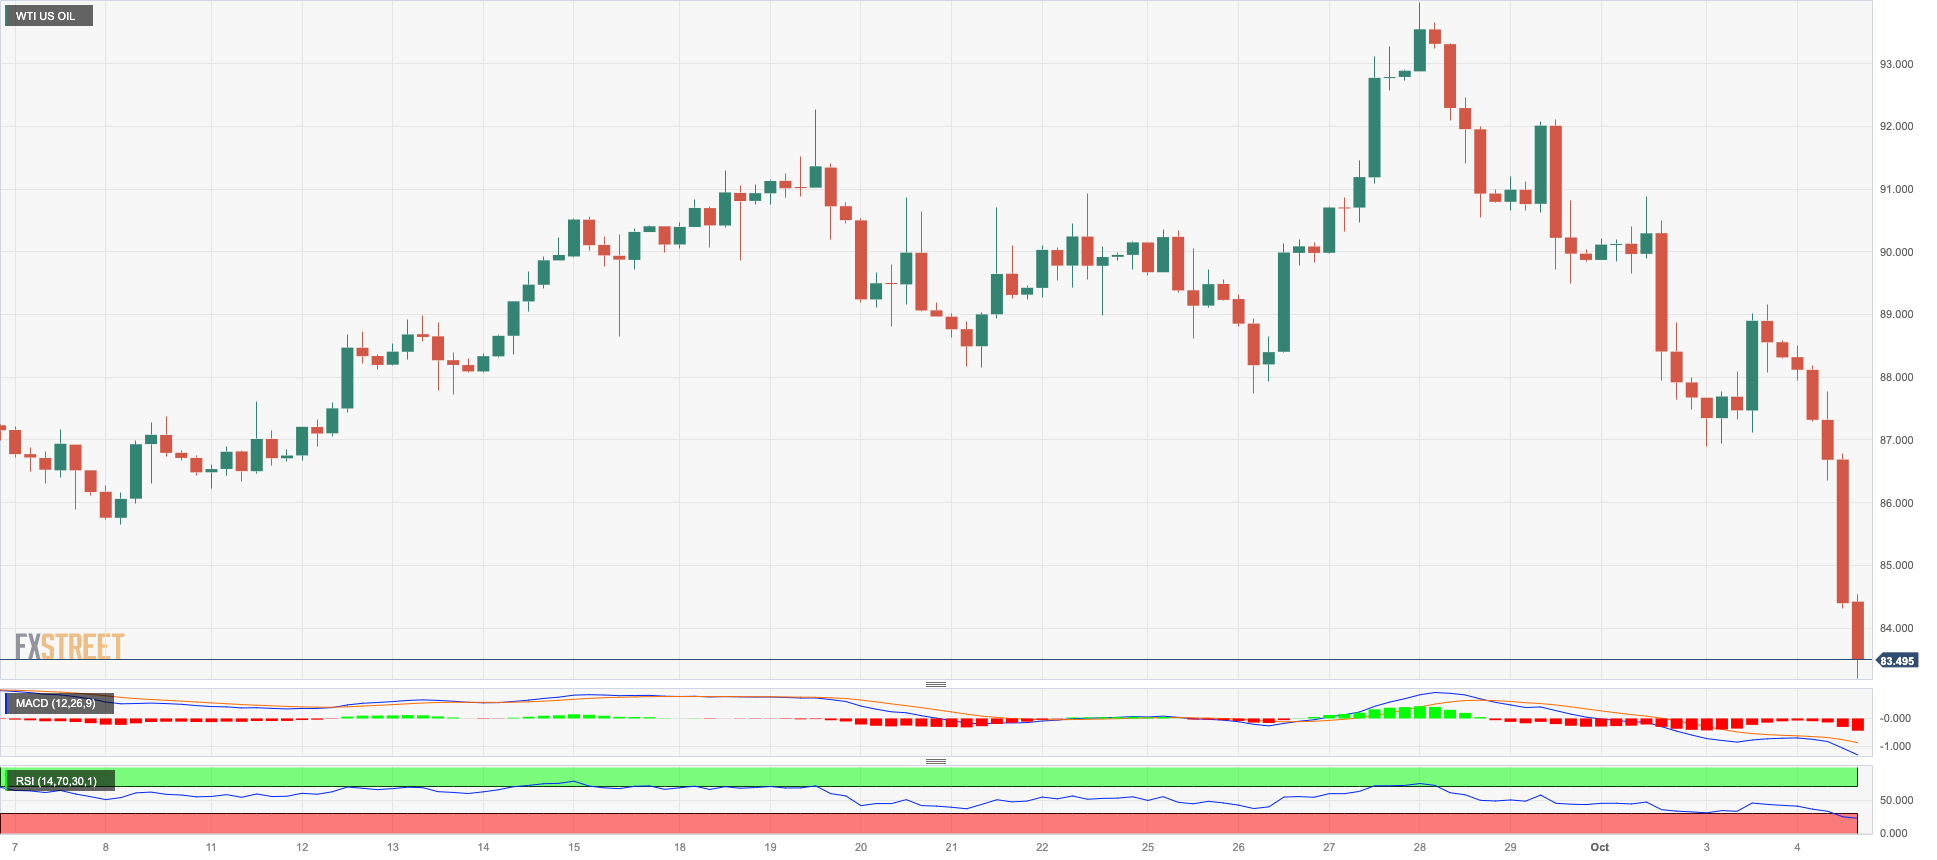
CRUDE WTI
WTI prices collapsed to five-week lows and revisited the sub-$85.00 region per barrel on Wednesday.
The pronounced sell-off in the commodity came in response to rising concerns surrounding the likeliness of an economic slowdown in both Europe and the US as a result of further tightening by major central banks, all of which is expected to eventually hurt the demand for crude oil.
In addition, a rebound in the Chinese economy remains elusive, maintaining the demand jitters well and sound.
Collaborating with the downbeat mood among traders also came the larger-than-expected build in gasoline inventories (+6.481M barrels), as reported by the EIA. Following the agency’s report, US crude oil inventories shrank by 2.224M barrels in the week to September 29, while supplies at Cushing went up by 0.132M barrels and Weekly Distillate Stocks decreased by 1.269M barrels.
Extra losses could see prices of WTI test the provisional 55-day SMA at $84.34 ahead of the key $80.00 mark and the August low of $77.64 (August 24). Further down emerges the 200-day SMA at $77.46 and the weekly low of $73.89 (July 17). The loss of the latter could expose the June low of $66.85 (June 12), followed by the 2023 low of $63.61 (May 4) and the key $60.00 mark per barrel. On the upside, a break above the 2023 high of $94.99 (September 28), might prompt WTI to visit the weekly top of $97.65 (August 30, 2022) before the key $100.00 threshold per barrel.
Resistance levels: $93.06 $94.99 $97.65 (4H chart)
Support levels: $84.82 $79.31 $77.56 (4H chart)
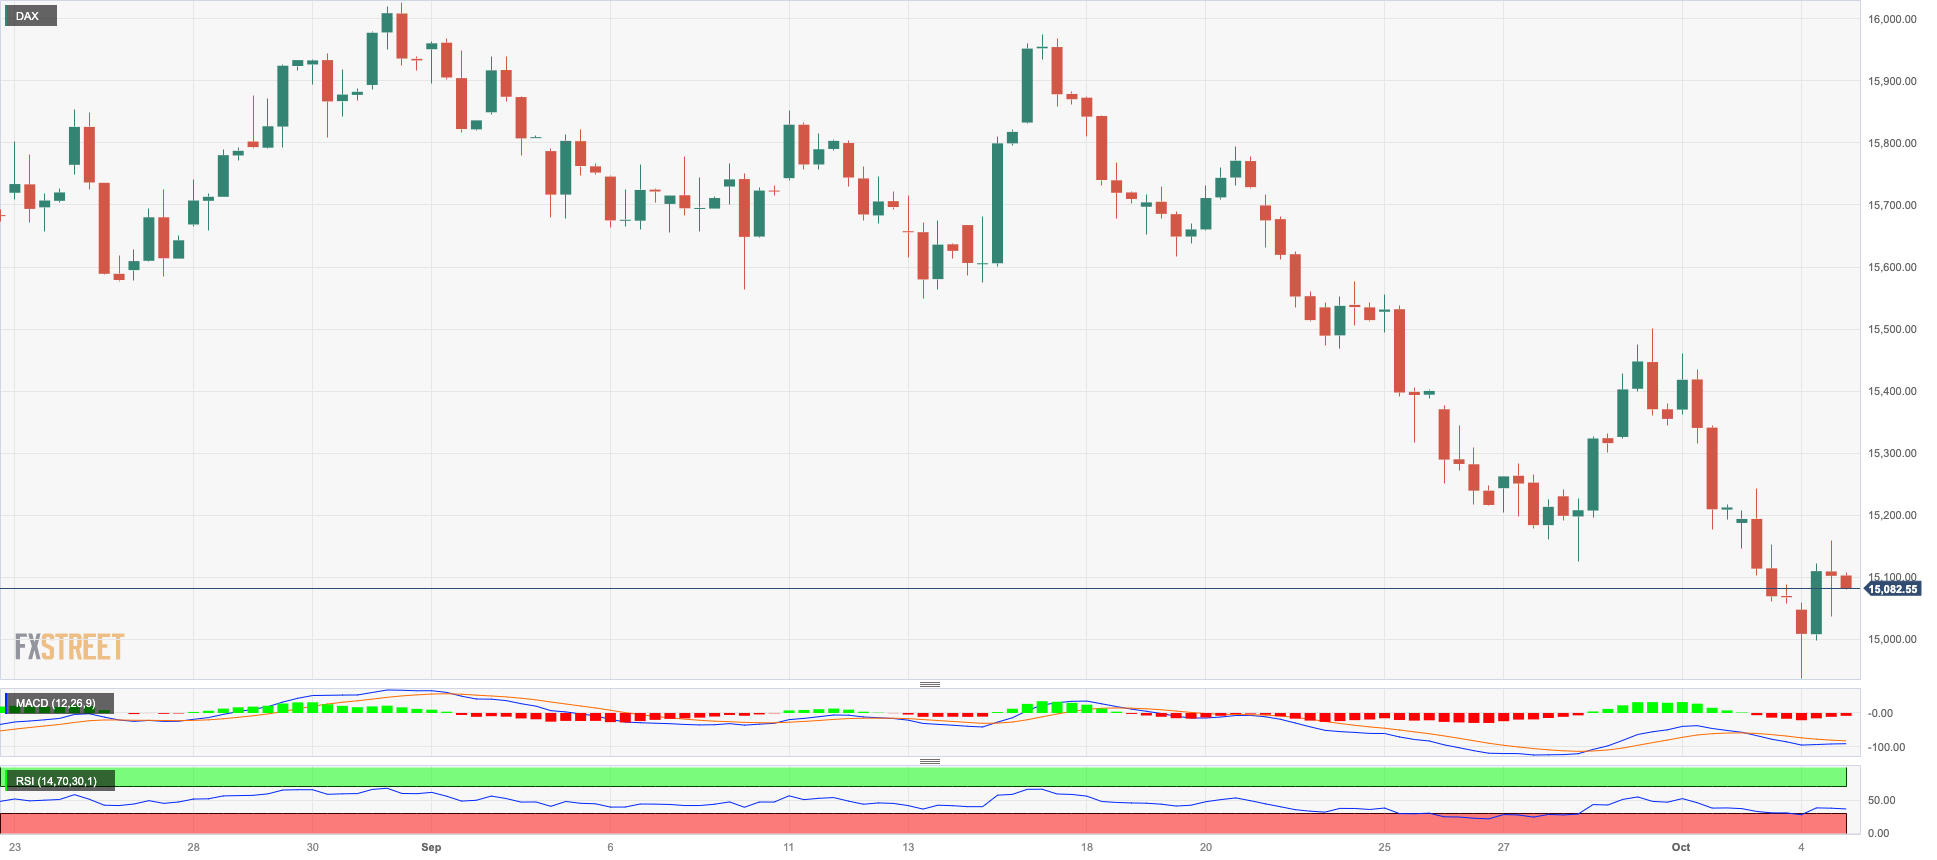
GER40
Germany’s benchmark DAX40 left behind two consecutive sessions of losses and advanced modestly to the 15100 zone after rebounding from fresh seven-month lows near 14900 earlier on Wednesday.
Cautiousness seems to have prevailed among European investors midweek against the backdrop of further dovish rhetoric from the ECB’s rate setters, while recession and stagflation concerns in the region, in combination with the perception of a tighter-for-longer Federal Reserve, also added to the generalized prudence.
The modest bounce in the DAX40 came amidst a corrective decline in the 10-year bund yields after hitting 12-year tops past the 3.00% mark.
If sellers regain control, the DAX40 may revisit the October bottom of 14948 (October 4), before going on to the March low of 14458 (March 20) and the December 2022 low of 13791 (December 20), all before the 2022 low of 11862 (September 28). On the plus side, the 200-day SMA at 15595 appears to be the first stumbling barrier ahead of the September high of 15989 (September 14), followed by weekly tops of 16042 (August 31) and 16060 (August 10). A surpass of this level might result in a retest of the all-time peak of 16528 (July 31). The daily RSI ticked higher past the 32 level.
Best Performers: Infineon, Symrise AG, Siemens Healthineers
Worst Performers: : Henkel VZO, Rheinmetall AG, Brenntag AG
Resistance levels: 15515 15810 15989 (4H chart)
Support levels: 14948 14809 14458 (4H chart)
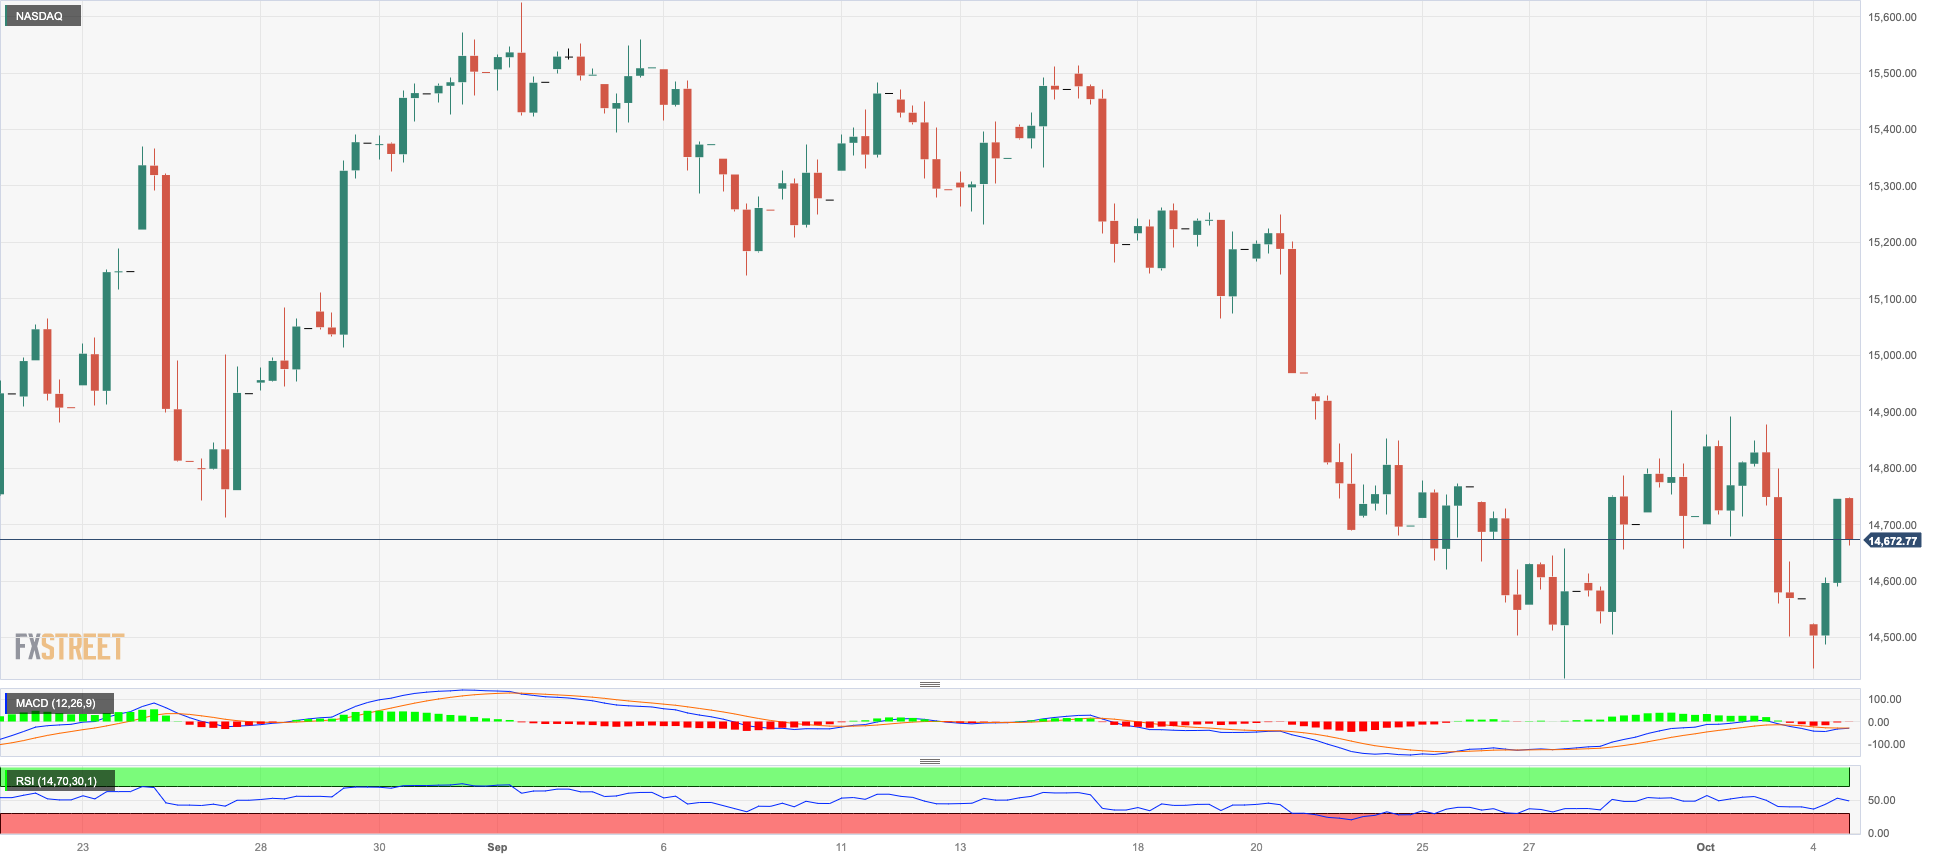
NASDAQ
The US tech equities quickly forgot about Tuesday’s losses and printed a decent advance when gauged by the reference Nasdaq 100 on Wednesday.
The move higher in the key index came on the back of the marked sell-off in the greenback coupled with the correction in US yields from recent multi-year peaks, while expectations of further tightening by the Fed remained unchanged.
Further gains could drive the Nasdaq 100 to the 55-day SMA of 15171, ahead of the weekly high of 15512 (September 14) and the September top of 15618 (September 1). The weekly peak of 15803 (July 31) is north of here, ahead of the 2023 high of 15932 (19 July) and the round mark of 16000. On the other hand, a fall below the September low of 14432 (September 27) could bring the weekly low of 14283 (June 7) back into target, ahead of the 200-day SMA at 13603 and the April low of 12724 (April 25). Once this zone is breached, the index could target the March low of 11695 (March 13) before reaching the 2023 low of 10696 (January 6). The RSI on the daily chart improved north of the 42 mark.
Top Gainers: Tesla, The Trade Desk, ASML ADR
Top Losers: DexCom, Diamondback, Baker Hughes
Resistance levels: 14901 15512 15618 (4H chart)
Support levels: 14432 14283 13520 (4H chart)
DOW JONES
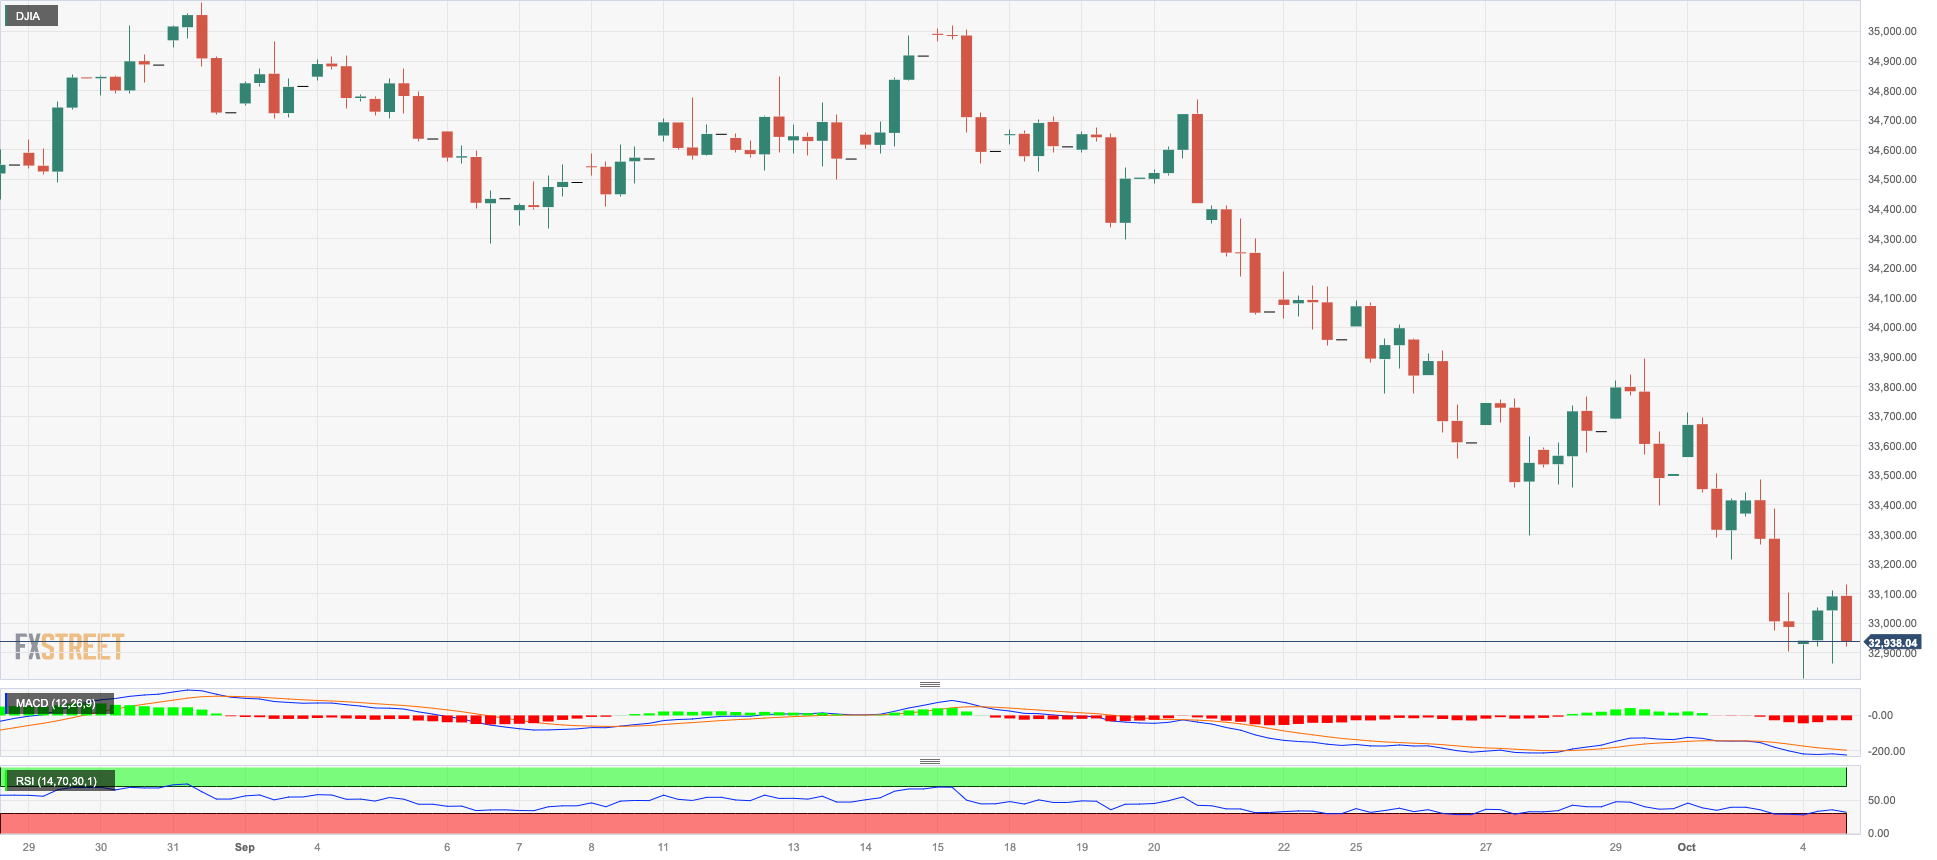
US equities retreated for the fourth session in a row and motivated the Dow Jones to record new four-month lows around the 32800 region on Wednesday.
The negative price action in the index came in response to the cautious tone among market participants ahead of the release of September’s Nonfarm Payrolls later in the week, while the prospects for a further tighter-for-longer stance from the Fed also had their say on Wednesday.
All in all, the Dow Jones retreated 0.04% to 32989, the S&P500 gained 0.32% to 4242, and the tech-heavy Nasdaq Composite advanced 0.78% to 13161.
The Dow Jones hit a new low of 32873 on October 4. The loss of this level exposes a deeper fall to the May low of 32586 (May 25) ahead of the 2023 low of 31429 (March 15). In contrast, the September high of 34977 (September 14) appears to be the immediate upside barrier prior to the weekly top of 35070 (August 31) and the 2023 peak of 35679 (August 1). If the latter is surpassed, the 2022 high of 35824 (February 9) could come into view before the all-time top of 36952 (January 5, 2022). The everyday RSI sank further into the oversold territory near 24.
Top Performers: Microsoft, Salesforce Inc., Amgen
Worst Performers: Chevron, Verizon, Walgreen Boots
Resistance levels: 33893 34269 34977 (4H chart)
Support levels: 32873 32586 31805 (4H chart)
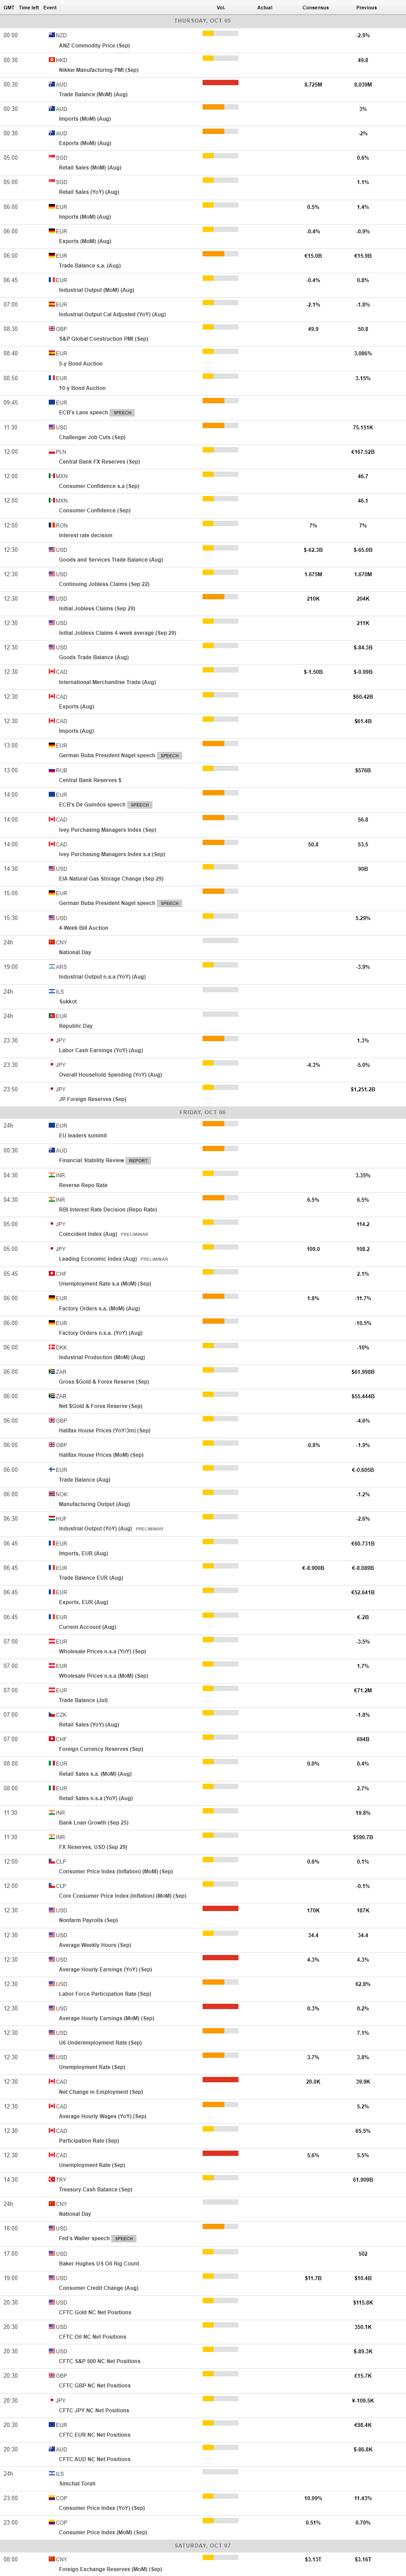
MACROECONOMIC EVENTS
All Information & Updates provided by:

All information relating to the financial markets available on this page has been prepared and issued by FXStreet (Forexstreet SL, Spain, Reg: B62498233) on the basis of publicly available information and all information believed to be reliable and does not conflict with Kuwaiti local laws, and all necessary care has been taken to before the company to ensure that the facts mentioned are correct from the source.
NCM Investment nor any of its directors or employees shall in any way be held responsible for the contents of this news, and the information contained on this page is intended only to provide clients with publicly available information and should not be construed as investment advice, report or analysis and/or constitute an offer or invitation to buy or sell financial instruments of any kind.
RISK WARNING: Forex and CFDs are highly risky leveraged products, as losses can exceed deposits. Please ensure you understand all the risks and take independent advice if necessary. NCM will segregate the clients based on the criteria of the regulator and its bylaws. NCM does not provide any advisory service; the material published does not constitute advice or a recommendation for a transaction in any financial instrument. NCM accepts no responsibility for any use of the content presented and any consequences of that use. Anyone acting on the information provided does so at their own risk.