
- Contact Us:
-

-

-

-


Daily Market Updates
06 Oct 2023
USDJPY
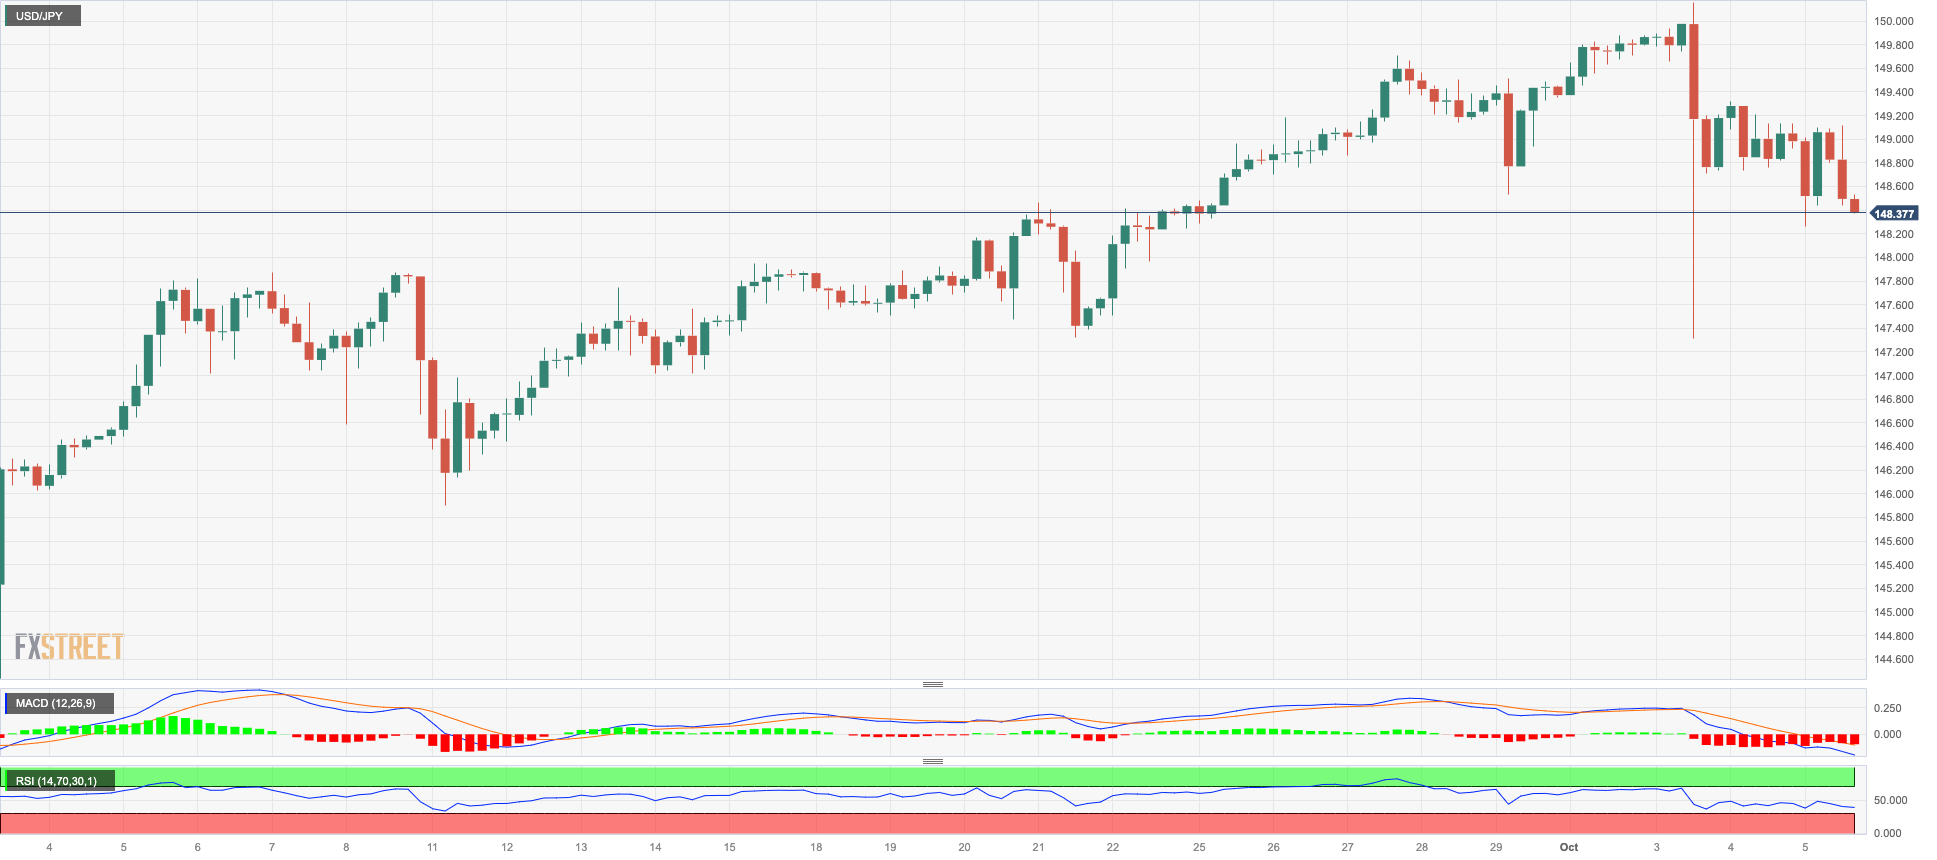
USD/JPY resumed the downside and revisited the low-148.00s on Thursday on the back of further weakness in the greenback and declining US yields.
That said, the continuation of the selling pressure in the greenback dragged further south the USD Index (DXY) to the mid-106.00s, helped by the corrective decline in US yields across the curve, while the JGB 10-year yields also came under pressure after advancing to new highs past 0.80%.
In the Japanese docket, Foreign Bond Investment rose by ¥297.1B in the week to September 30.
If USD/JPY breaks above the 2023 high of 150.16 (October 3), it might challenge the 2022 top of 151.94 (October 21). Just the opposite, the weekly low of 145.89 (September 11) appears reinforced by the interim 55-day SMA of 145.84 and comes ahead of the September low of 144.43 (September 1). If the latter is crossed, the market may go to the intermediate 100-day SMA at 143.61 before the August low of 141.50 (August 7). Further down emerges the critical 200-day SMA at 138.33 July prior to the July low of 137.23 (July 14). On the daily chart, the RSI deflated below 54.
Resistance levels: 150.16 151.94 155.80 (4H chart)
Support levels: 148.25 147.27 145.89 (4H chart)
GBPUSD
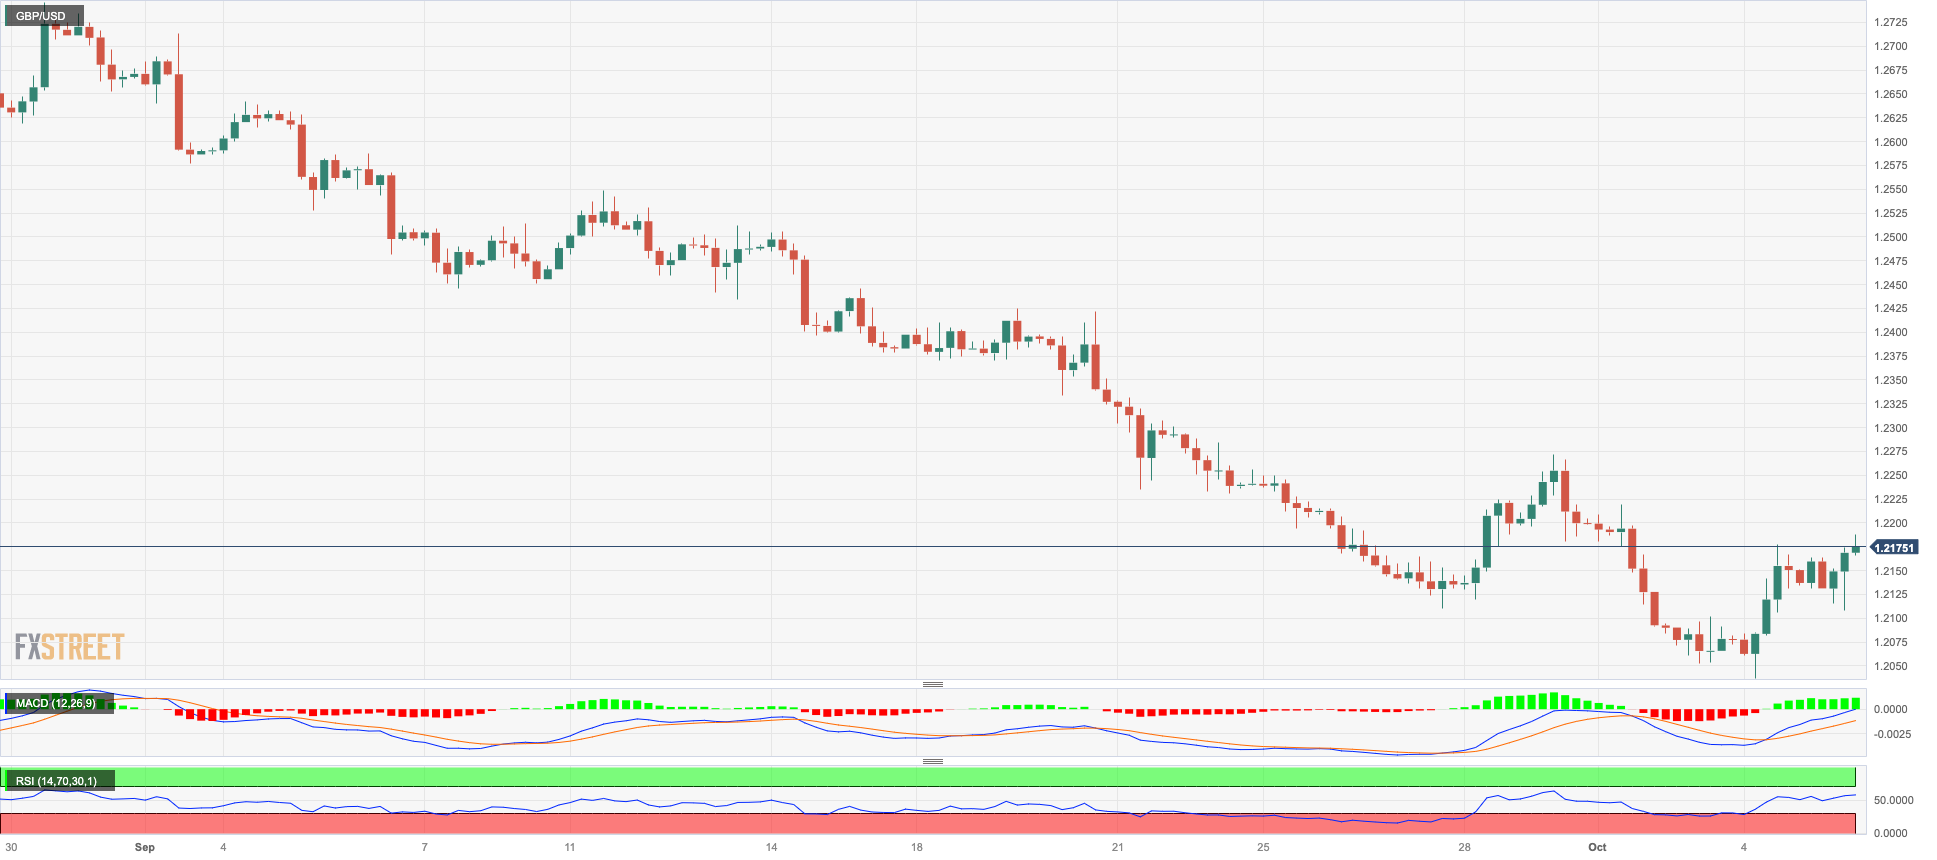
Further retracement in the greenback sponsored the second consecutive daily gain in GBP/USD, this time revisiting the proximity of the 1.2200 neighbourhood following Wednesday’s pullback to the 1.2040 zone.
Once again, a weaker dollar bolstered the improvement in risky assets despite growing cautious trade ahead of the publication of the US labour market report on Friday.
In the UK, the BoE’s Decision Maker Panel (DMP) survey saw 1-year inflation expectations drop to 4.8% (from 5.0%) and edge higher to 3.2% when it comes to 2-year projections.
Still around the BoE, MPC member Broadbent observed that sectors sensitive to interest rates, such as consumer durable goods spending and housing investment, had significantly weakened. He also remarked that there were evident indications that the impact of monetary policy tightening was becoming apparent, particularly in terms of its influence on demand within the UK.
In the UK docket, the Construction PMI deflated to 45 in September (from 50.8).
If GBP/USD falls below the October low of 1.2037 (October 3), it could retrace to the significant round milestone of 1.2000 before falling to the 2023 low of 1.1802 (March 8). Instead, the 200-day SMA at 1.2435 is the first hurdle to overcome, followed by the minor weekly high at 1.2548 (September 11). The preliminary 55-day and 100-day SMAs are at 1.2557 and 1.2607 respectively, ahead of weekly tops at 1.2746 (August 30 ), 1.2818 (August 10) and 1.2995 (July 27), all ahead of the critical 1.3000 level. The RSI on the daily chart climbed past the 35 level.
Resistance levels: 1.2187 1.2271 1.2421 (4H chart)
Support levels: 1.2037 1.2010 1.1802 (4H chart)
AUDUSD
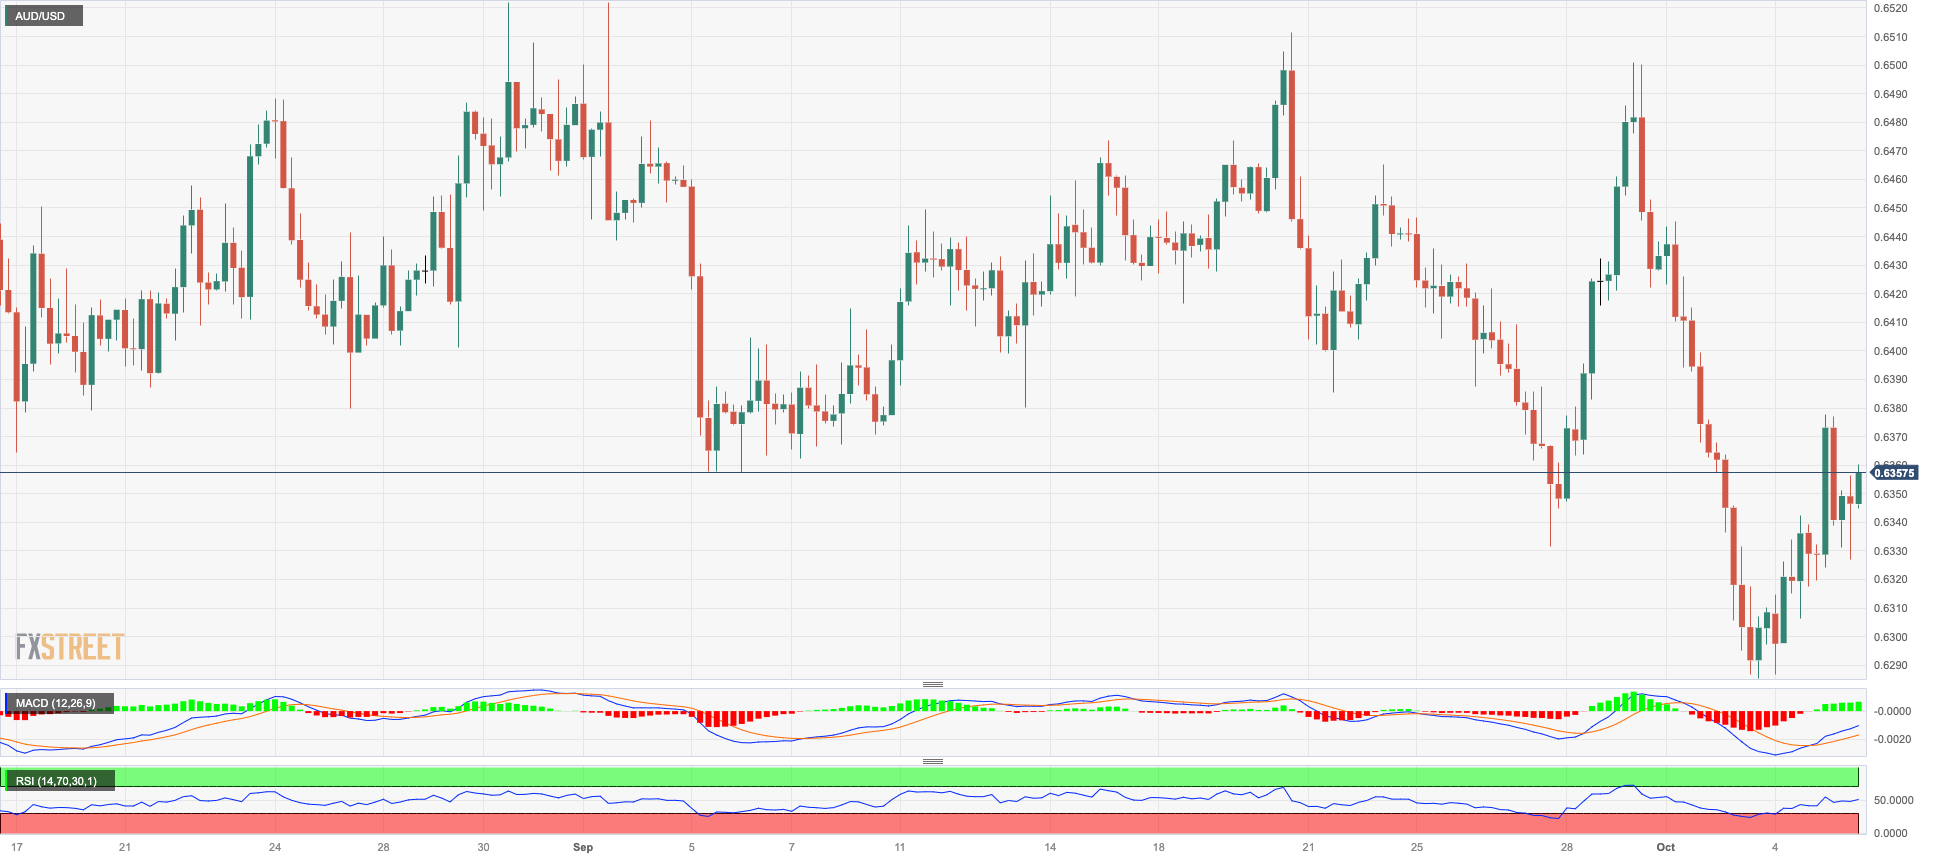
AUD/USD added to Wednesday’s uptick and managed to advance to the vicinity of the 0.6400 barrier on Thursday.
Once again, the persistent weakness around the greenback lent extra legs to the Aussie dollar and the rest of the risk complex, while another negative session in the commodity space appears to have limited the upside in spot.
In the Australian calendar, the trade surplus improved to A$9.64B in August, with Exports expanding 4% MoM and Imports contracting 0.4%.
The most immediate threat to AUD/USD is the 2023 low of 0.6285 (October 3), seconded by the November 2022 low of 0.6272 (November 7) and the 2022 low of 0.6179 (October 13). On the other side, the next resistance is at the weekly high of 0.6522 (August 30), ahead of another weekly top of 0.6616 (August 10) and the 200-day SMA of 0.6680. Further rises could take the pair to its July peak of 0.6894 (July 14), just ahead of the June top of 0.6899 (June 16) and the important milestone of 0.7000. The breakout from this region reveals the weekly peak at 0.7029 (February 14) and the 2023 high at 0.7157 (February 2). The daily RSI improved past 43.
Resistance levels: 0.6377 0.6419 0.6501 (4H chart)
Support levels: 0.6285 0.6272 0.6210 (4H chart)
GOLD
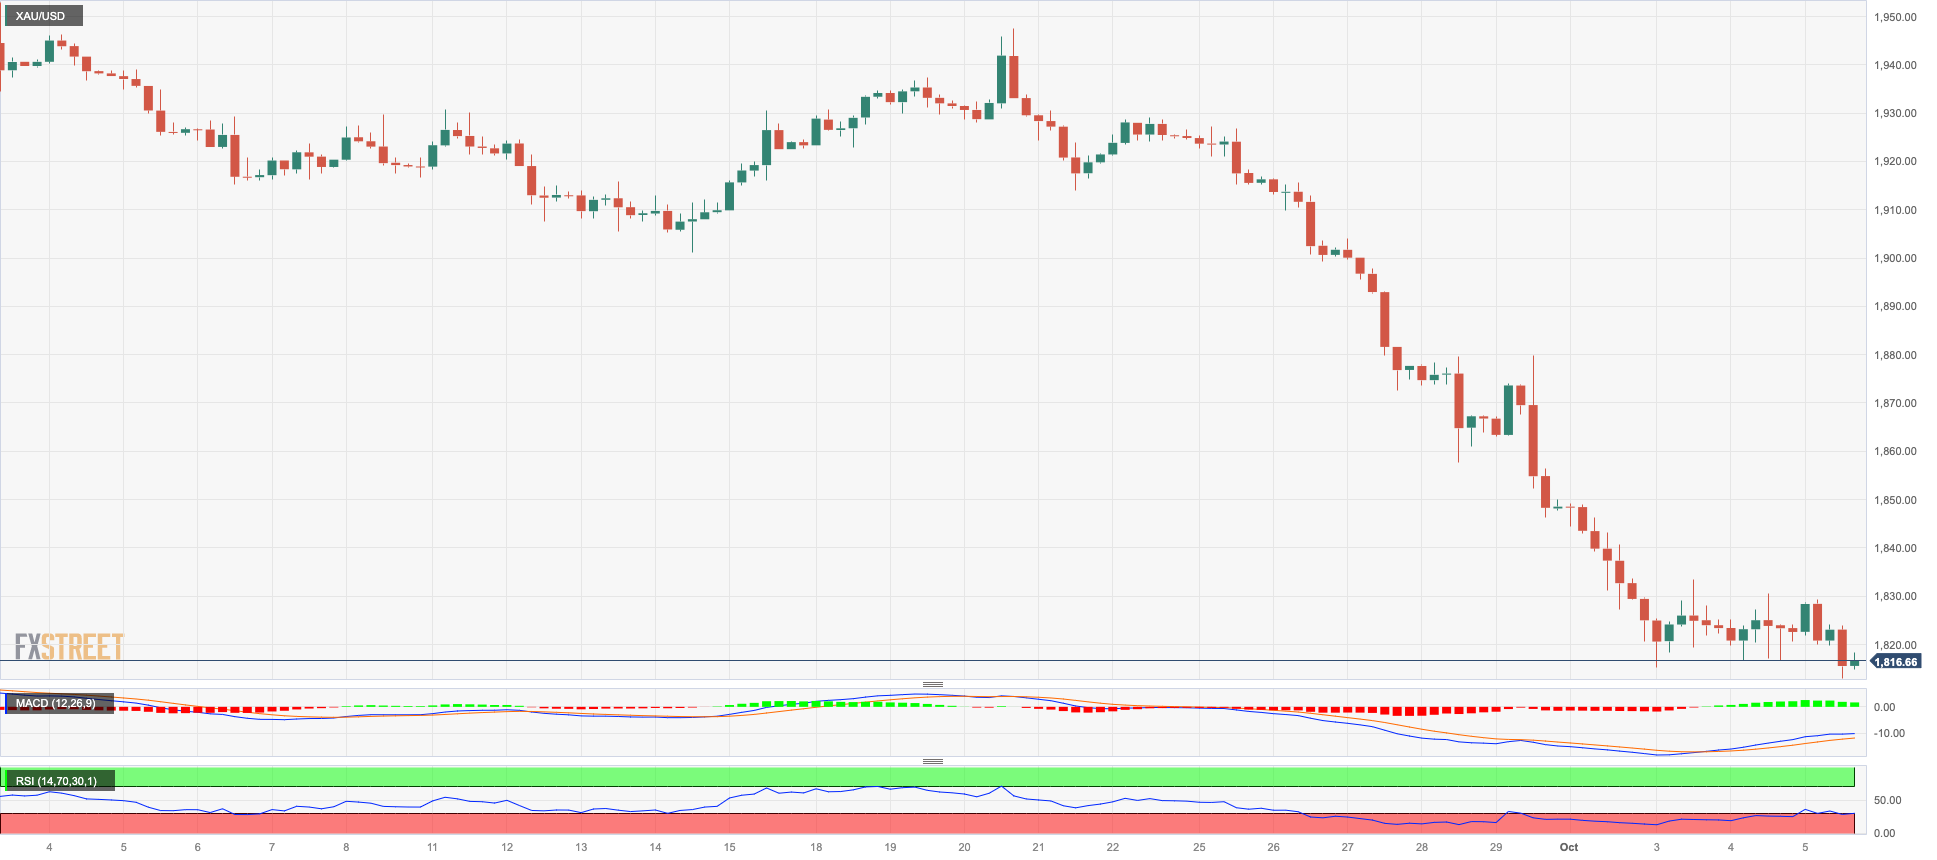
Further decline saw gold prices retreat to new seven-month lows around $1813 per troy ounce on Thursday.
The small downtick in the yellow metal came despite another daily pullback in the greenback coupled with further weakness in US yields in the short end and the belly of the curve, while the long end resumed the upside following Wednesday’s knee-jerk.
The strong bearish sentiment in the precious metals market persisted, even though the expectations for a 25 bps interest rate hike by the Federal Reserve in the November and December meetings have lost some momentum thus far.
The next objective for gold bears is the 2023 low at $1804 (February 28), which is just ahead of the crucial reversal zone at $1800. Any upward rise, on the other hand, is expected to be greeted with resistance at the 200-day SMA at $1927 before the weekly high at $1947 (September 20) and the September top at $1953 (September 1). If it breaks out from the latter, the metal might attack the July peak of $1987 (July 20), which is just below the psychological $2000 level. The 2023 high is $2067 (May 4), seconded by the 2022 top of $2070 (March 8) and the all-time peak of $2075 (August 7, 2020).
Resistance levels: $1879 $1907 $1947 (4H chart)
Support levels: $1813 $1804 $1784 (4H chart)
CRUDE WTI
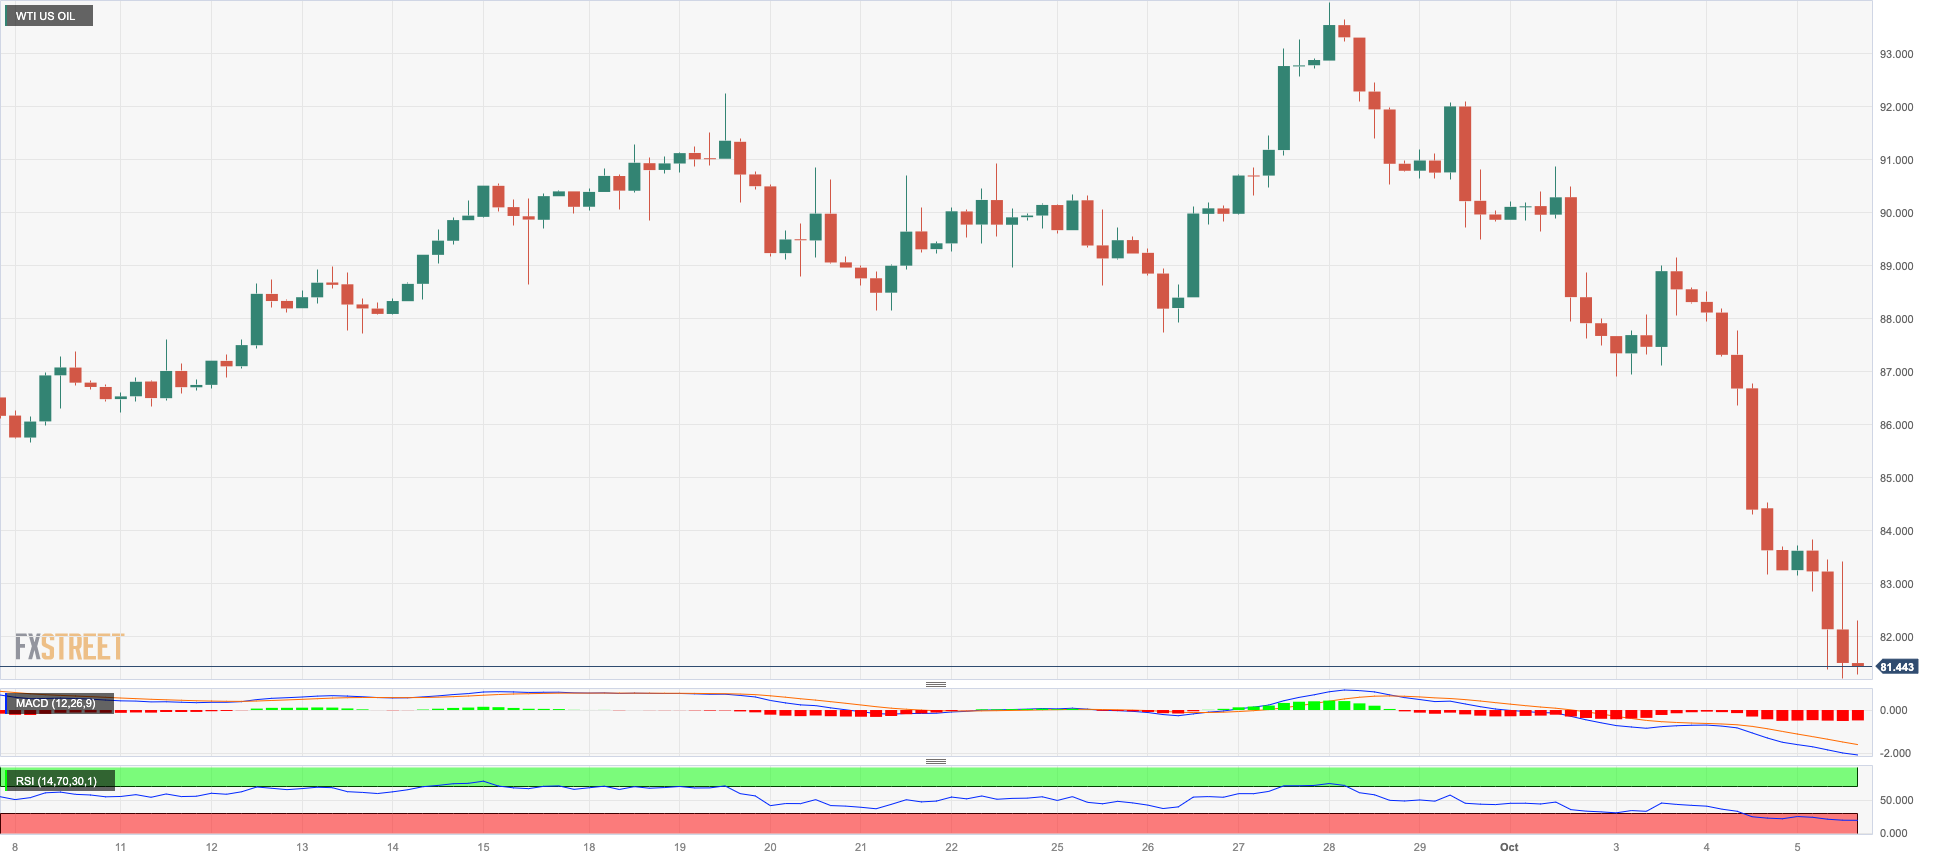
Another marked pullback saw crude oil prices drop to five-week lows in the proximity of the $82.00 mark per barrel on Thursday.
Once again, persistent concerns around the health of the global economy and its impact on the demand for crude oil kept traders’ sentiment sour, while the recent larger-than-expected gasoline build, as per the EIA’s report, also contributed to the decline in prices.

Around the OPEC+, the cartel confirmed at its meeting on Wednesday that both Saudi Arabia and Russia will extend their oil out cuts to the end of the year.
A deeper pullback could see WTI prices revisit the critical $80.00 threshold and the August low of $77.64 (August 24), which appears reinforced by the 200-day SMA at $77.47. The breach of the latter exposes a drop to the weekly low of $73.89 (July 17) prior to the June low of $66.85 (June 12) and the 2023 low of $63.61 (May 4). Further south emerges the critical $60.00 mark per barrel. On the upside, a breakout of the 2023 high of $94.99 (September 28) might send WTI to the weekly top of $97.65 (August 30, 2022) before hitting the psychological $100.00 threshold per barrel.
Resistance levels: $86.67 $90.23 $93.06 (4H chart)
Support levels: $82.32 $79.31 $77.56 (4H chart)
GER40
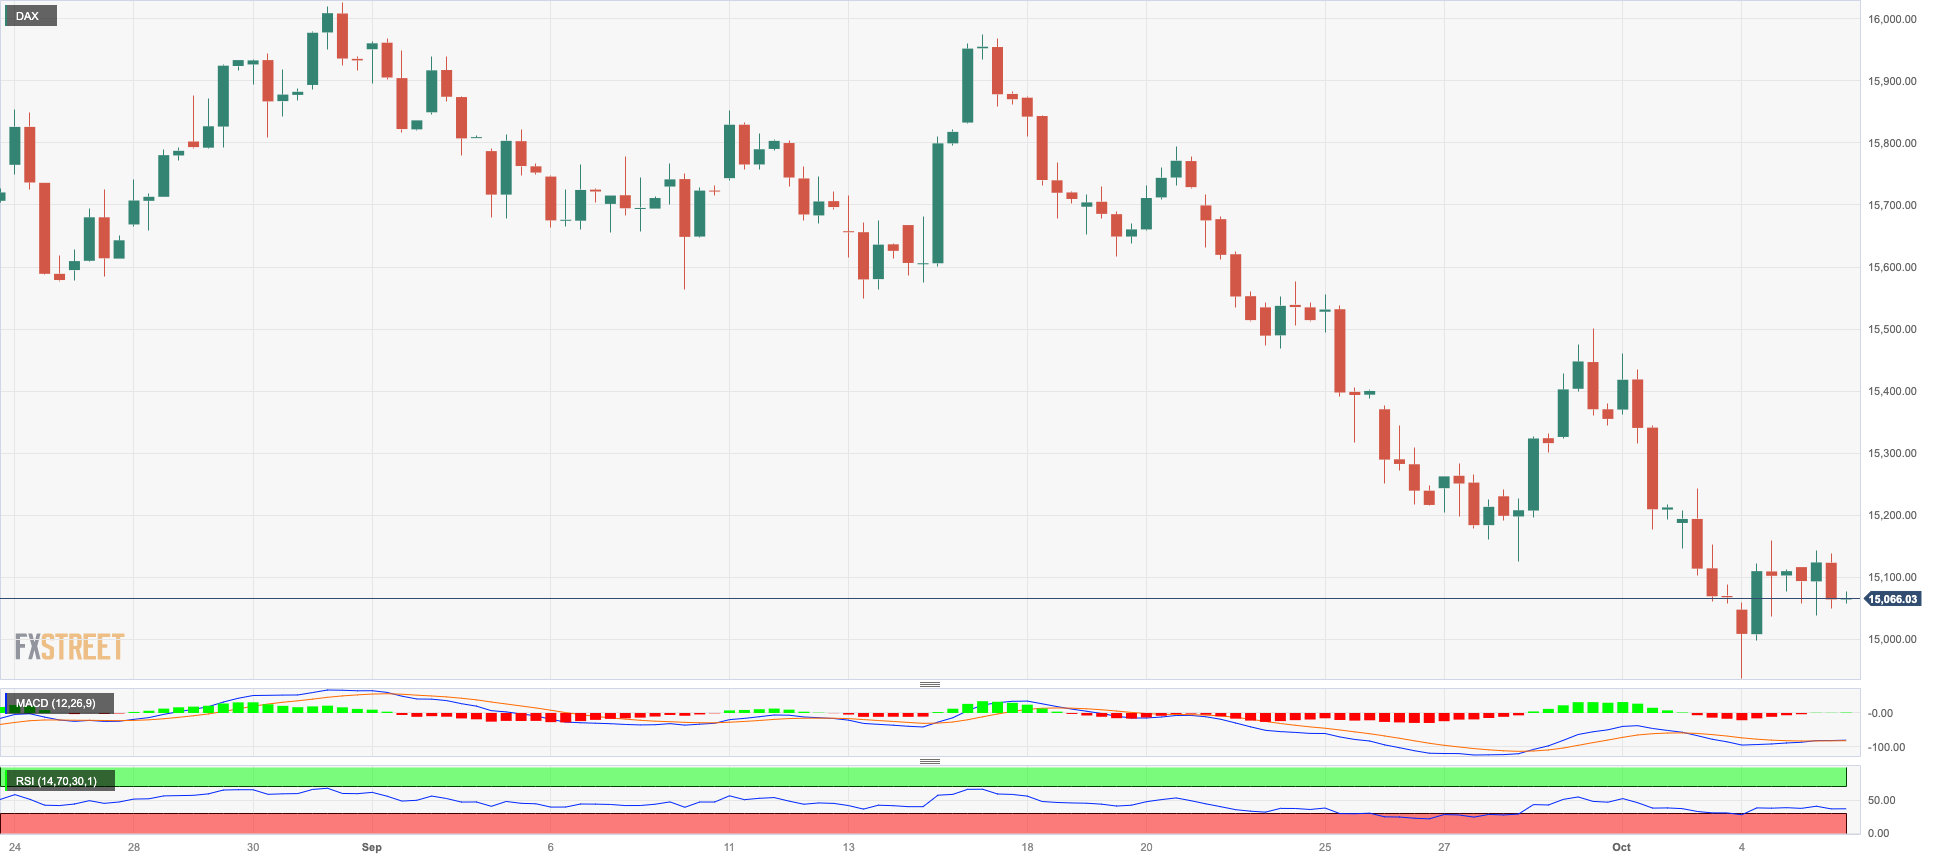
German equities reversed Wednesday’s advance and prompted the DAX40 to revisit once again the proximity of the 15000 threshold on Thursday.
The daily pullback in the reference index came in response to rising concerns over the persistent deterioration of fundamentals in the region, combined with the perception of a tighter-for-longer Federal Reserve and prudence ahead of Friday's US Nonfarm Payrolls.
The daily retracement in the DAX40 was accompanied by another drop in the 10-year bund yields after surpassing the 3.00% mark earlier in the week.
If sellers retake control, the DAX40 may revisit the October low of 14948 (October 4), before moving on to the March low of 14458 (March 20) and the December 2022 low of 13791 (December 20), all before the 2022 low of 11862 (September 28). On the bright side, the 200-day SMA of 15601 seems to be the first up-barrier ahead of the September high of 15989 (September 14), followed by weekly tops of 16042 (August 31) and 16060 (August 10). The surpass of this level might lead to a retest of the all-time peak of 16528 (July 31). The daily RSI dropped to the vicinity of 31.
Best Performers: Henkel VZO, Sartorius AG VZO, Zalando SE
Worst Performers: : Adidas, Covestro, Dr Ing hc F Porsche Prf
Resistance levels: 15515 15810 15989 (4H chart)
Support levels: 14948 14809 14458 (4H chart)
NASDAQ
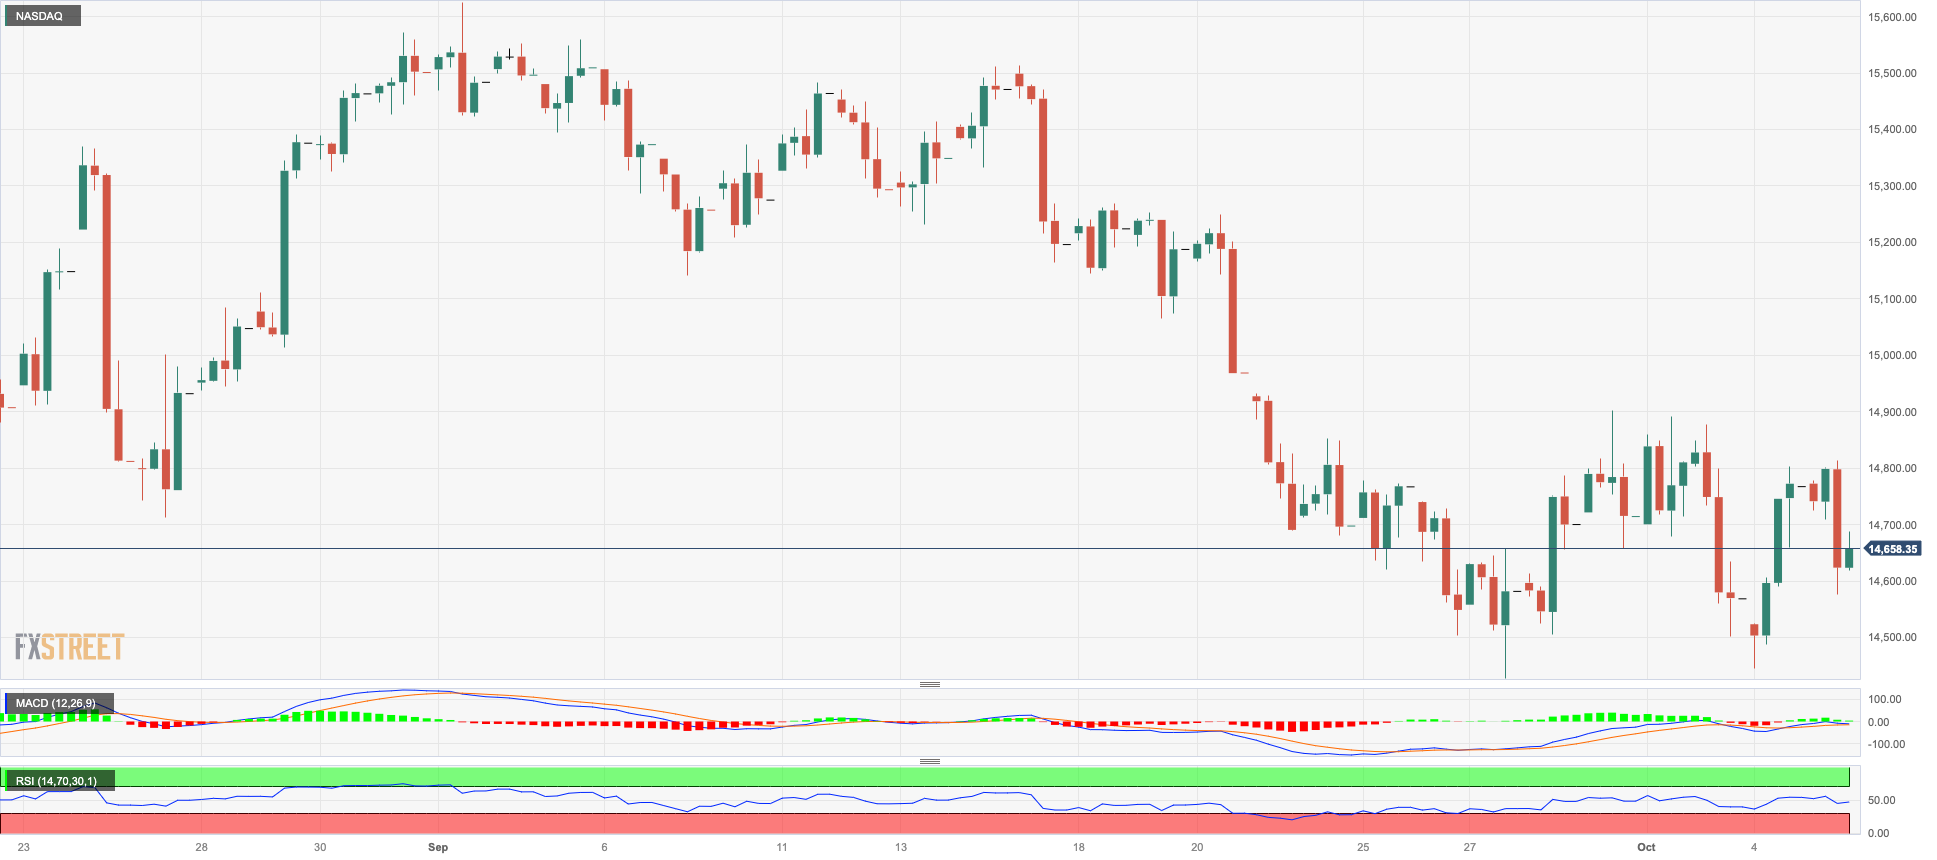
The tech index Nasdaq 100 fell in line with its US peers on Thursday, fading the previous daily advance and shifting its focus on the downside.
Daily losses in the tech sector came despite further weakness in the greenback and the mixed tone in the US bonds market, while investors appear to have scaled back some bets on a rate hike by the Fed before year-end and cautiousness prevailed prior to the publication of the US jobs report on Friday.
Further gains could drive the Nasdaq 100 to the 55-day SMA of 15151, ahead of the weekly high of 15512 (September 14) and the September top of 15618 (September 1). The weekly peak of 15803 (July 31) is north of here, prior to the 2023 high of 15932 (19 July) and the round mark of 16000. On the flip side, a drop below the September low of 14432 (27 September) could bring the weekly low of 14283 (June 7) back into target, ahead of the 200-day SMA at 13620 and the April low of 12724 (April 25). Once this zone is broken, the index could target the March low of 11695 (March 13) before the 2023 low of 10696 (January 6). The everyday RSI receded to the 42 region.
Top Gainers: CoStar, Micron, Starbucks
Top Losers: Lucid Group, DexCom, PepsiCo
Resistance levels: 14901 15512 15618 (4H chart)
Support levels: 14432 14283 13520 (4H chart)
DOW JONES
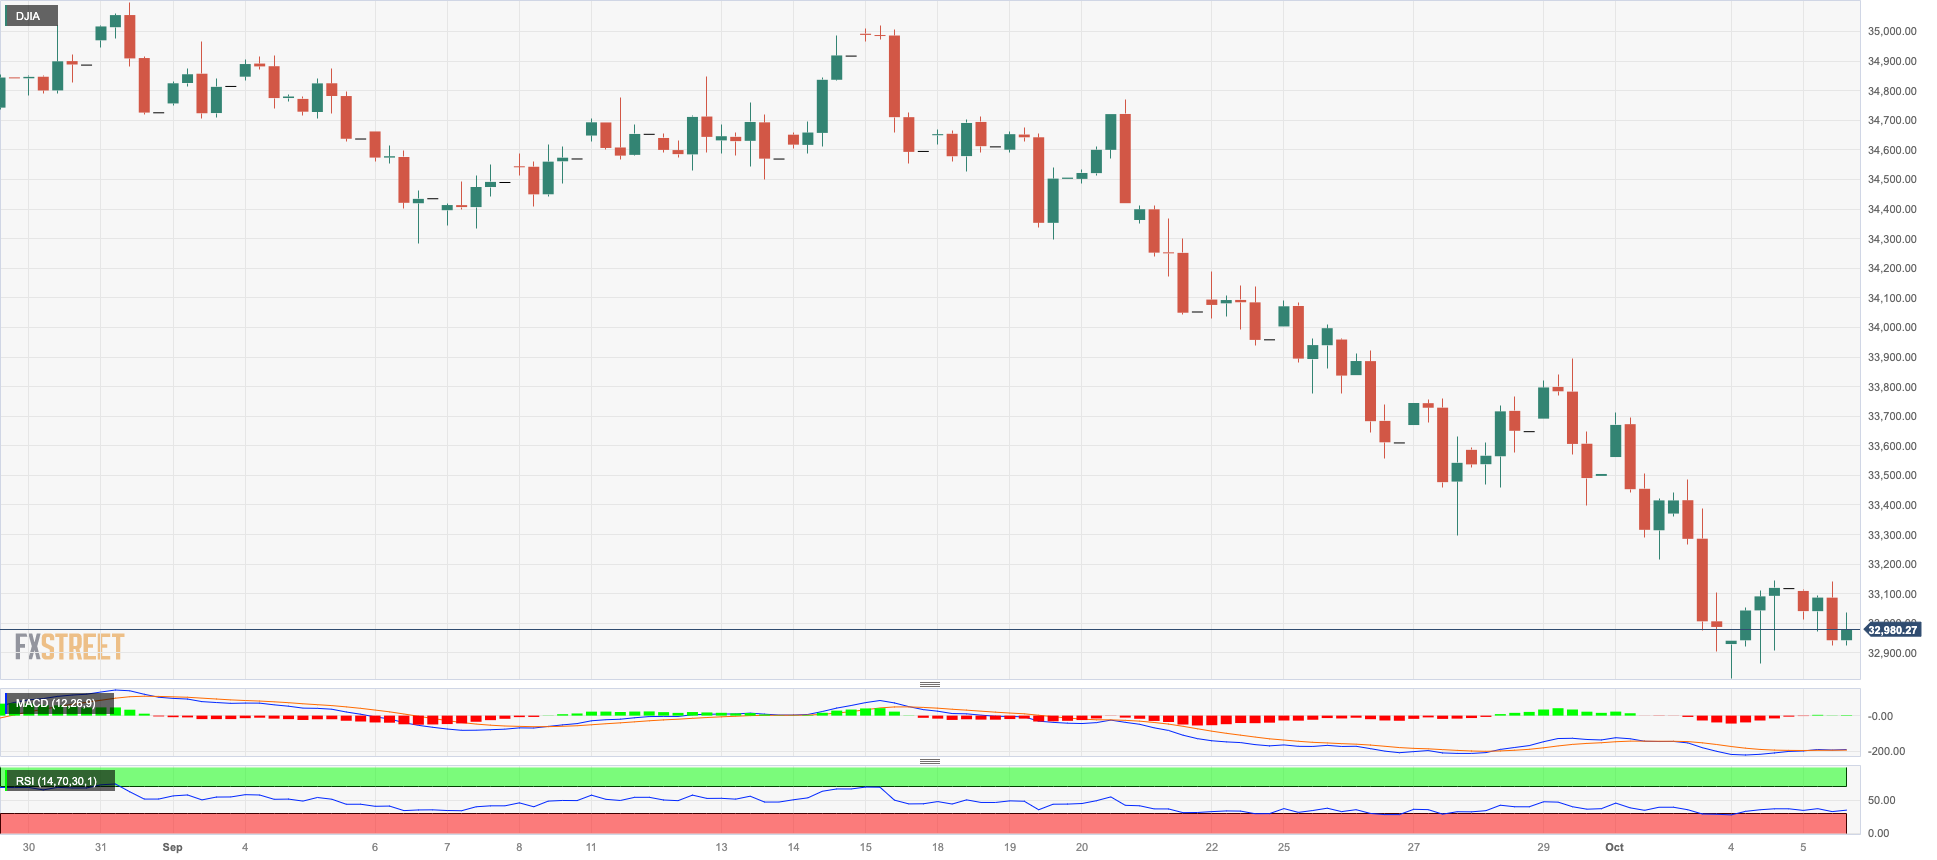
US stocks gauged by the Dow Jones resumed the downside on Thursday, refocusing their attention on the area of recent multi-month lows near 32800.
The negative mood among investors found its reason in reignited recession fears, always on the back of further tightening by major central banks, while usual prudence ahead of the release of Nonfarm Payrolls on Friday also had its say on Thursday.
All in all, the Dow Jones dropped 0.43% to 32985, the S&P500 deflated 0.61% to 4237, and the tech-benchmark Nasdaq Composite retreated 0.68% to 13146.
If the Dow Jones breaks below the October low of 32873 (October 4), it could embark on a probable visit to the May low of 32586 (May 25) before the 2023 low of 31429 (March 15). In contrast, the September high of 34977 (September 14) appears to be the immediate upside barrier ahead of the weekly top of 35070 (August 31) and the 2023 peak of 35679 (August 1). If the latter is surpassed, the 2022 high of 35824 (February 9) could come into view before the all-time top of 36952 (January 5, 2022). The daily RSI remained in the oversold zone around 26.
Top Performers: Travelers, Merck&Co, Chevron
Worst Performers: Coca-Cola, Dow, Salesforce Inc
Resistance levels: 33893 334268 34977 (4H chart)
Support levels: 32873 32586 31805 (4H chart)
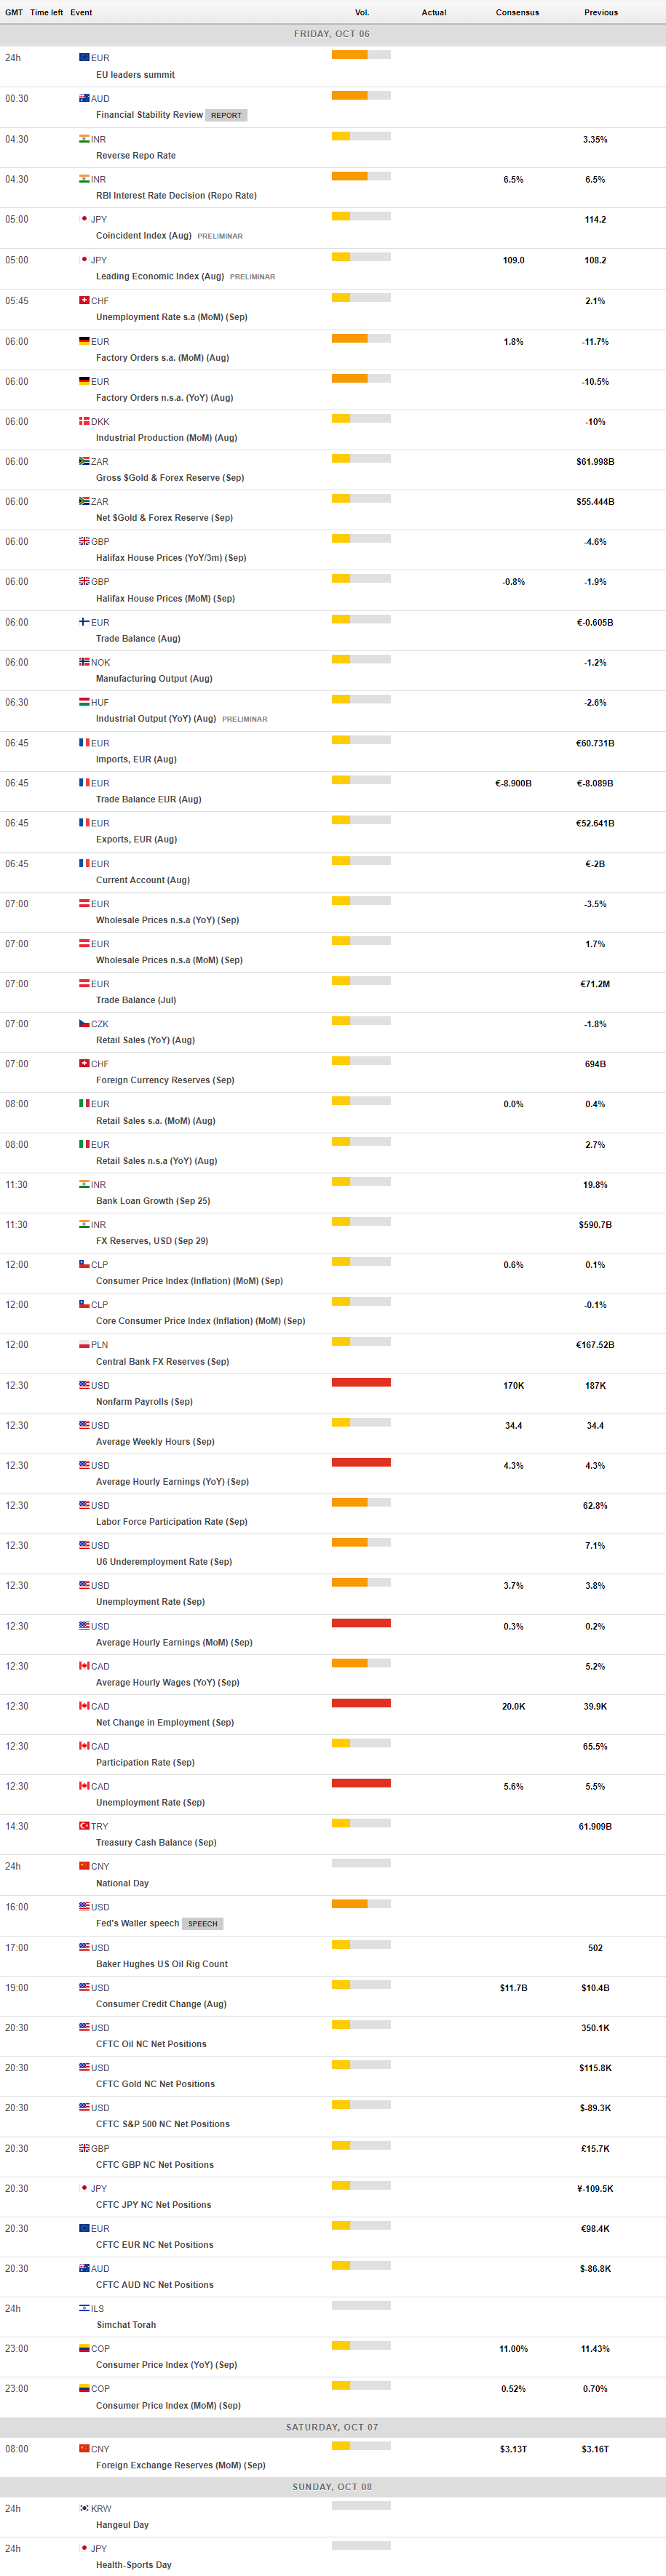
MACROECONOMIC EVENTS
All Information & Updates provided by:

All information relating to the financial markets available on this page has been prepared and issued by FXStreet (Forexstreet SL, Spain, Reg: B62498233) on the basis of publicly available information and all information believed to be reliable and does not conflict with Kuwaiti local laws, and all necessary care has been taken to before the company to ensure that the facts mentioned are correct from the source.
NCM Investment nor any of its directors or employees shall in any way be held responsible for the contents of this news, and the information contained on this page is intended only to provide clients with publicly available information and should not be construed as investment advice, report or analysis and/or constitute an offer or invitation to buy or sell financial instruments of any kind.
RISK WARNING: Forex and CFDs are highly risky leveraged products, as losses can exceed deposits. Please ensure you understand all the risks and take independent advice if necessary. NCM will segregate the clients based on the criteria of the regulator and its bylaws. NCM does not provide any advisory service; the material published does not constitute advice or a recommendation for a transaction in any financial instrument. NCM accepts no responsibility for any use of the content presented and any consequences of that use. Anyone acting on the information provided does so at their own risk.