
- Contact Us:
-

-

-

-


Daily Market Updates
09 Oct 2023
USDJPY
USD/JPY resumed the uptrend and climbed to three-day highs around 149.50, just to close a tad lower on Friday.
The better tone in the risk galaxy favoured the selling bias in the Japanese yen, while the extra advance in US yields vs. the daily downtick in JGB 10-year yields also contributed to the daily gains in the pair.
In Japan, Household Spending contracted at an annualized 2.5% in August. In addition, preliminary readings for the month of August saw the Coincident Index at 109.5 and the Leading Economic Index at 109.5.
If USD/JPY breaks over the October 3 high of 150.16, it may threaten the 151.94 high of 2022. (October 21). On the contrary, the weekly low of 145.89 (September 11) looks to be supported by the intermediate 55-day SMA of 145.84 and is higher than the September low of 144.43. (September 1). If the latter is breached, the market may move to the intermediate 100-day simple moving average (SMA) at 143.61 before reaching the August low of 141.50. (August 7). Prior to the July low of 137.23, the 200-day SMA at 138.33 seems farther down (July 14). The RSI climbed to the boundaries of the 60 level.
Resistance levels: 149.53 150.16 151.94 (4H chart)
Support levels: 148.25 147.27 145.89 (4H chart)

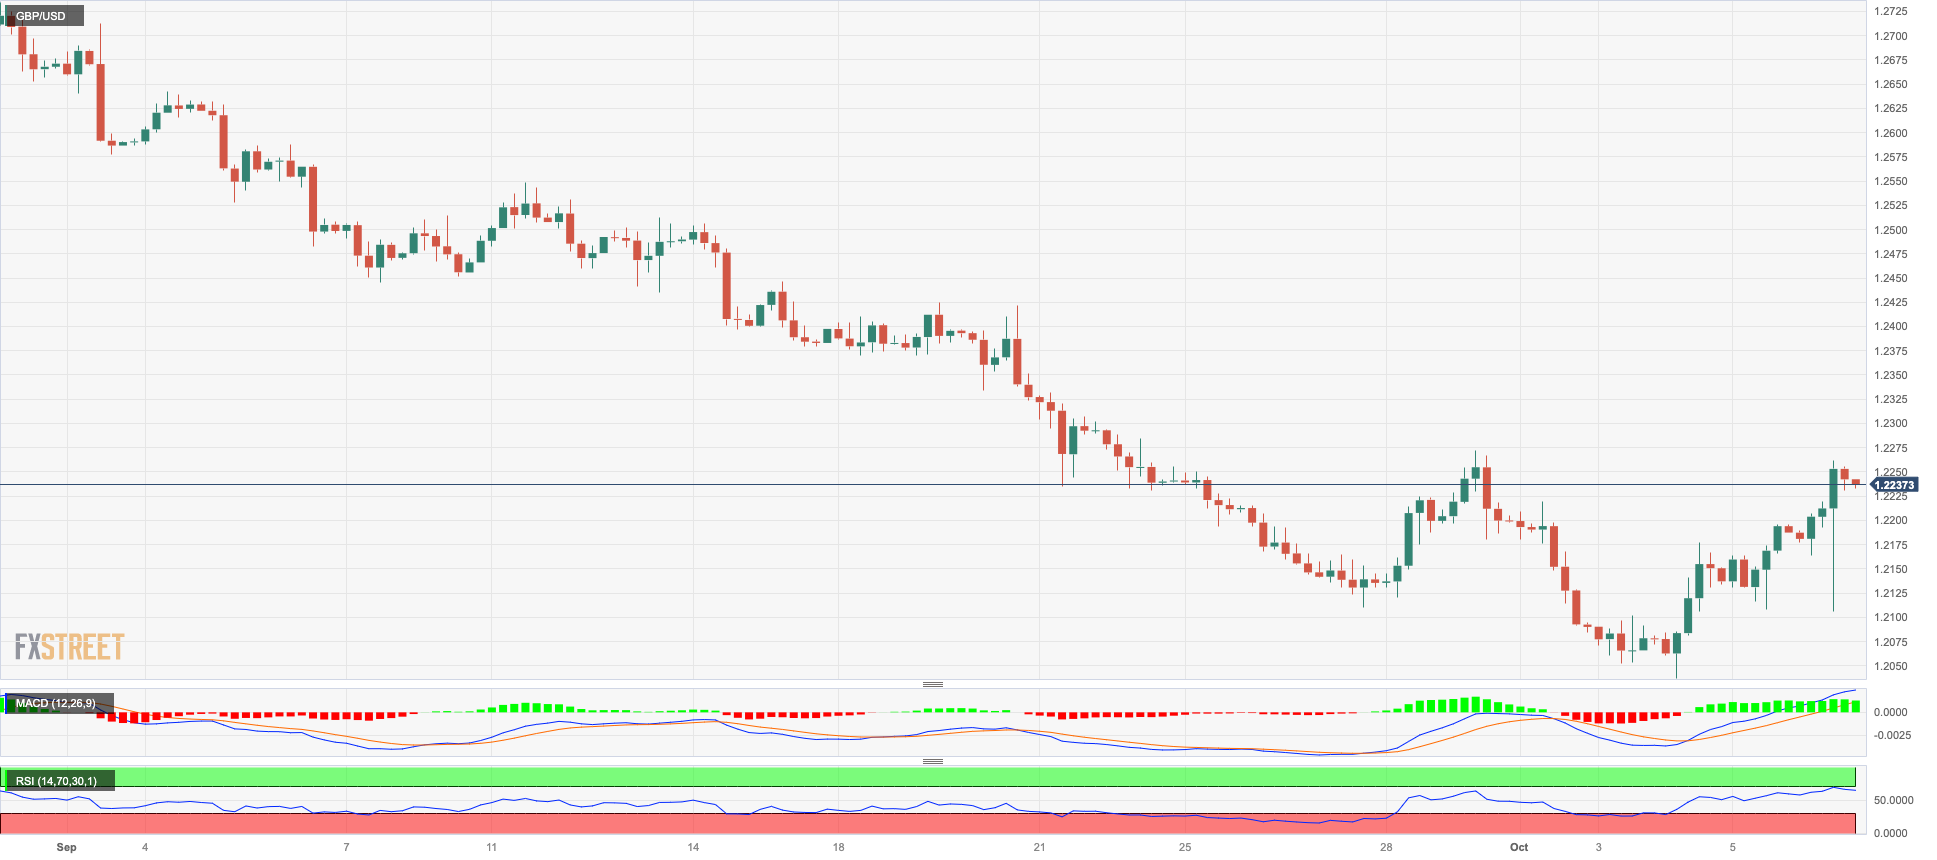
GBPUSD
Another poor session in the greenback lent extra wings to GBP/USD and motivated it to trespass the key barrier at 1.2200 the figure on Friday, advancing at the same time for the third session in a row.
The sell-off in the dollar picked up extra pace despite Nonfarm Payrolls figures showing the economy created many more jobs than initially anticipated, which in turned impacted the prospects for further tightening by the Fed before year-end.
The UK docket was empty on Friday.
Next on the upside for GBP/USD comes the weekly high at 1.2271 (September 20) prior to the 200-day SMA at 1.2436. North from here comes the minor weekly top at 1.2548 (September 11), which coincides with the preliminary 55-day SMA and aligns ahead of the temporary 100-day at 1.2605. The surpass of the latter opens the door to a move to the weekly peaks at 1.2746 (August 30), 1.2818 (August 10) and 1.2995 (July 27), all ahead of the critical 1.3000 level. Instead, if Cable falls below the October low of 1.2037 (October 3), it could retrace to the significant round milestone of 1.2000 before falling to the 2023 low at 1.1802 (March 8). The day-to-day RSI rose further and approached 42.
Resistance levels: 1.2261 1.2271 1.2421 (4H chart)
Support levels: 1.2037 1.2010 1.1802 (4H chart)
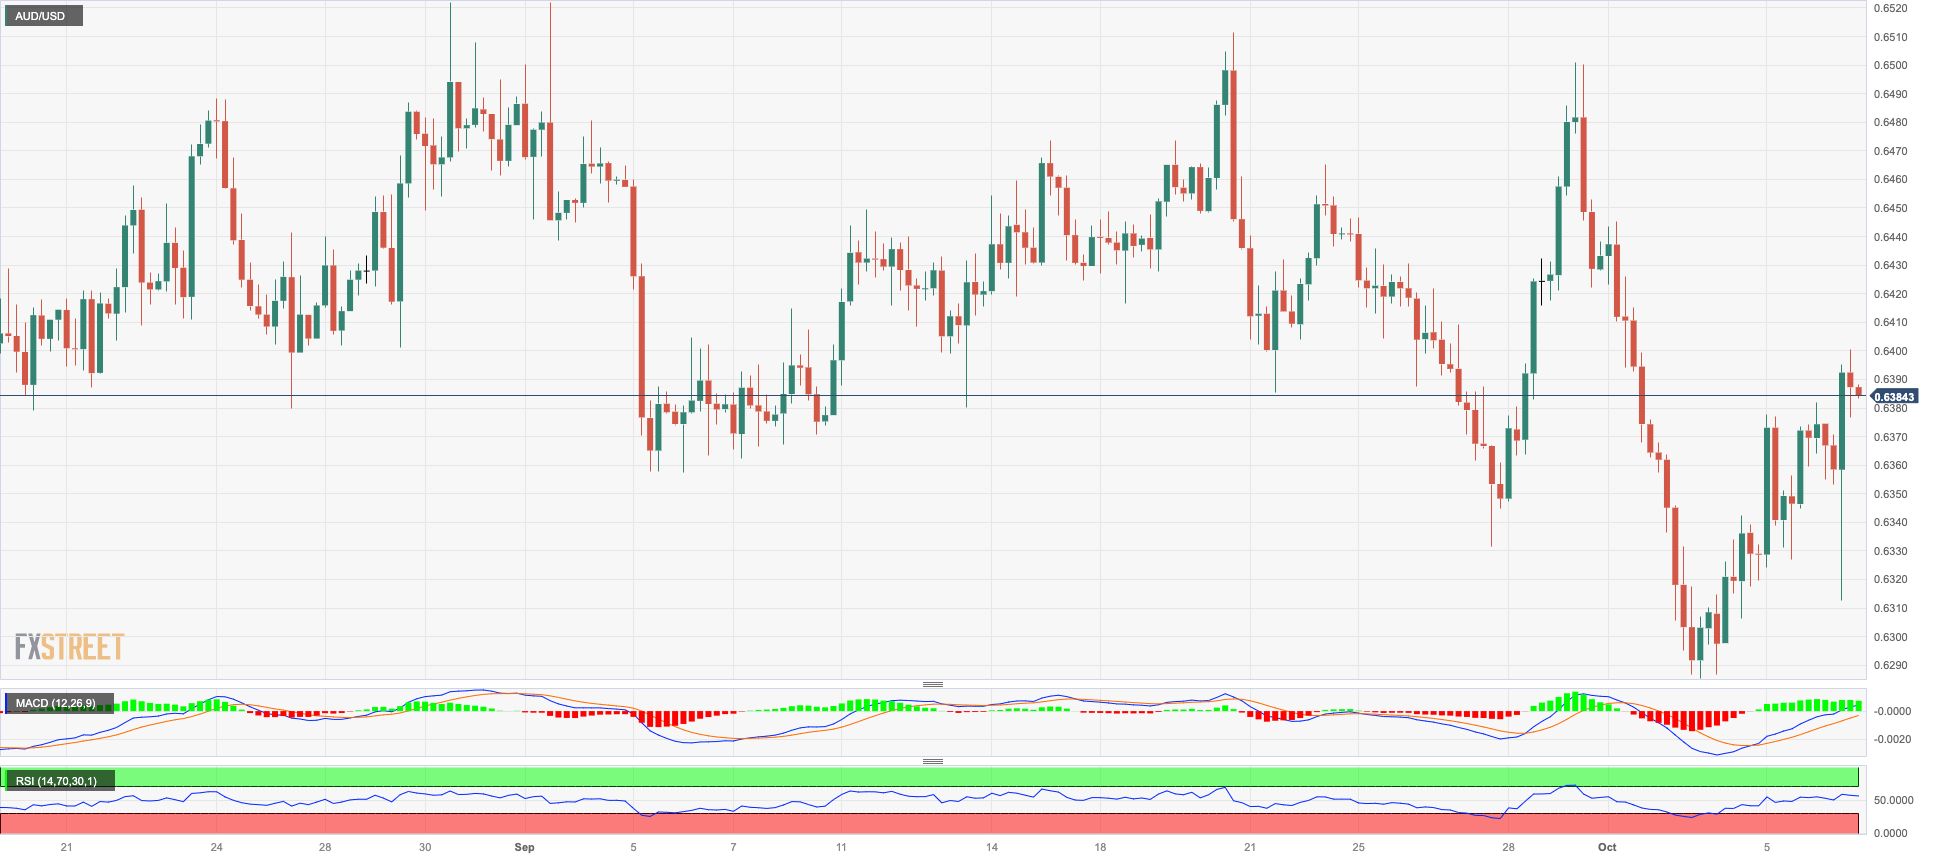
AUDUSD
AUD/USD extended the weekly rebound and ended Friday’s session with four-day highs in the 0.6380/85 band.
The continuation of the selling pressure in the greenback in combination with the positive session across the commodity complex underpinned the weekly bounce in the Aussie dollar following Tuesday’s drop to new YTD lows around 0.6280.
There were no data releases scheduled for Oz on Friday.
The most immediate threat to AUD/USD is the 2023 low at 0.6285 (October 3), seconded by the November 2022 low at 0.6272 (November 7) and the 2022 low at 0.6179 (October 13). On the other side, the next resistance is at the weekly high of 0.6522 (August 30), ahead of another weekly top of 0.6616 (August 10) and the 200-day SMA of 0.6677. A further rise could take the pair to its July peak of 0.6894 (July 14), just ahead of the June high of 0.6899 (June 16) and the important milestone of 0.7000. The breakout from this region exposes the weekly top at 0.7029 (February 14) prior to the 2023 peak at 0.7157 (February 2). The daily RSI improved past 46.
Resistance levels: 0.6400 0.6417 0.6501 (4H chart)
Support levels: 0.6312 0.6285 0.6272 (4H chart)
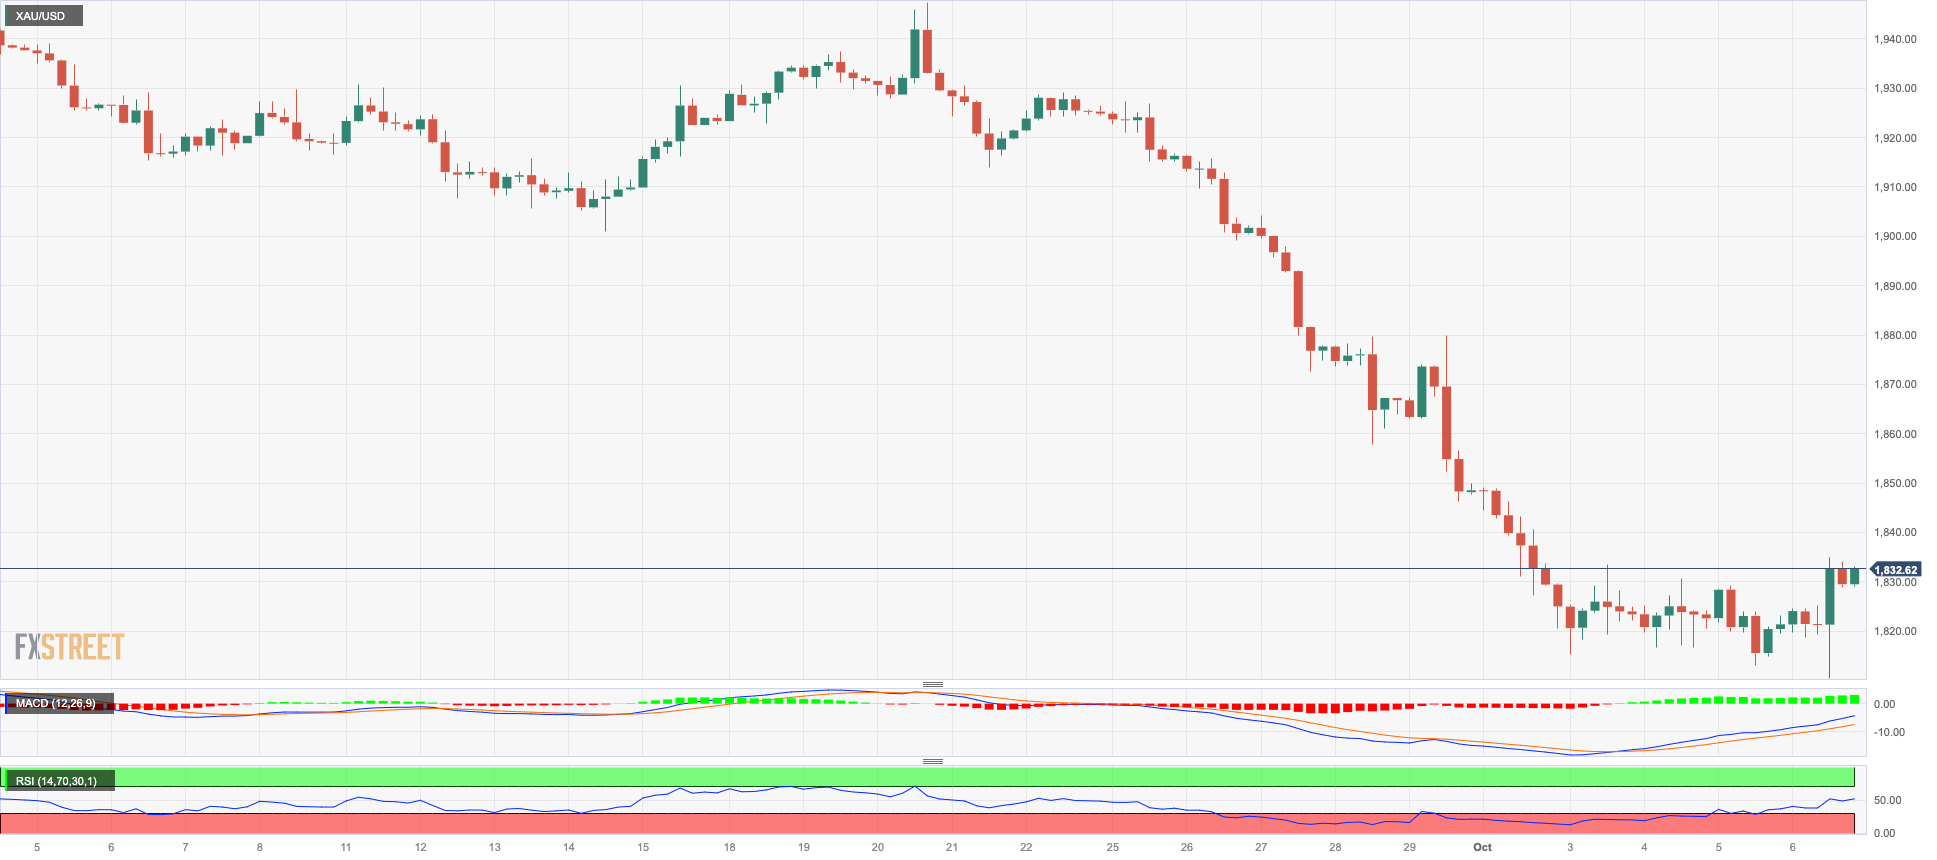
GOLD
Gold prices recorded their first session of gains after nine consecutive daily drops on Friday.
Indeed, the yellow metal managed to leave behind the area of new seven-month lows around $1810 per ounce troy and end the session above $1830 on the back of the persevering decline in the dollar, despite further gains in US yields across different maturities.
The improvement in bullion also came in spite of renewed speculation of further tightening by the Fed before year-end, which was particularly exacerbated in response to the firm readings from the US Nonfarm Payrolls during September.
Further downside in gold should breach the October low of $1810 (October 6) before the 2023 low at $1804 (February 28), which is just ahead of the critical reversal zone at $1800. Any upward movement, on the other hand, is projected to meet the next resistance at the 200-day SMA at $1927 ahead of the weekly high at $1947 (September 20) and the September top at $1953 (September 1). If the precious metal breaks above the latter, it might target the July peak of $1987 (July 20), which is just below the psychological $2000 barrier. North from here emerges the 2023 peak at $2067 (May 4), followed by 2022 high of $2070 (March 8) and the all-time top of $2075 (August 7, 2020).
Resistance levels: $1834 $1879 $1904 (4H chart)
Support levels: $1813 $1804 $1784 (4H chart)
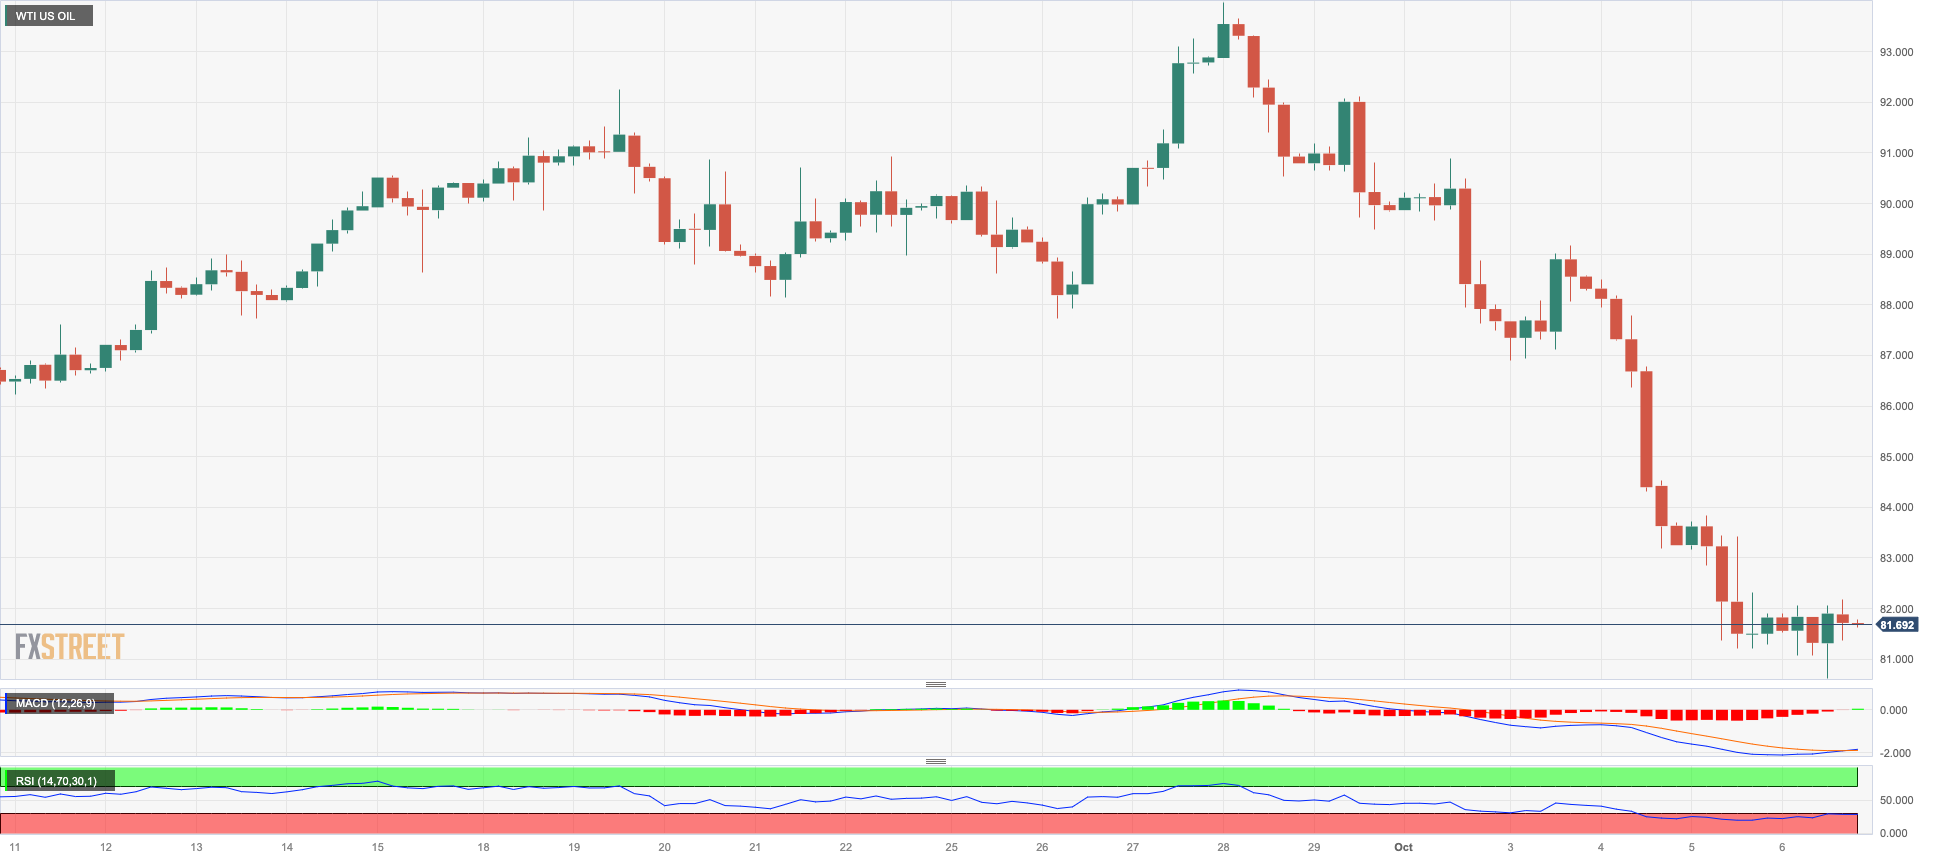
CRUDE WTI
Notwithstanding the slight gains observed on Friday, the prices of WTI concluded the week with a significant decline, hovering near five-week lows around $82.70. This represents a decrease of approximately $12 from the highs reached in late September, near the $95.00 mark per barrel.
Friday’s pullback in crude oil prices came on the back of further selling pressure around the greenback and some easing demand concerns, although prospects for a tighter-for-longer Fed remain an important headwind for the commodity for the time being.
Closing the weekly docket, driller Baker Hughes reported that total US active oil rigs went down by 5 to 497 in the week to October 6.
WTI prices might return to the important $80.00 level and the August low of $77.64 (August 24), which looks to be supported by the 200-day SMA at $77.48. If the latter is breached, the price could fall to the weekly low of $73.89 (July 17), before reaching the June low of $66.85 (June 12) and the 2023 low of $63.61 (May 4). Further south, the key $60.00 per barrel level appears. On the upside, a break over the 2023 high of $94.99 (September 28) might drive WTI to the weekly top of $97.65 (August 30, 2022) ahead of the psychological $100.00 mark per barrel.
Resistance levels: $86.74 $90.23 $93.06 (4H chart)
Support levels: $81.47 $79.31 $77.56 (4H chart)
GER40
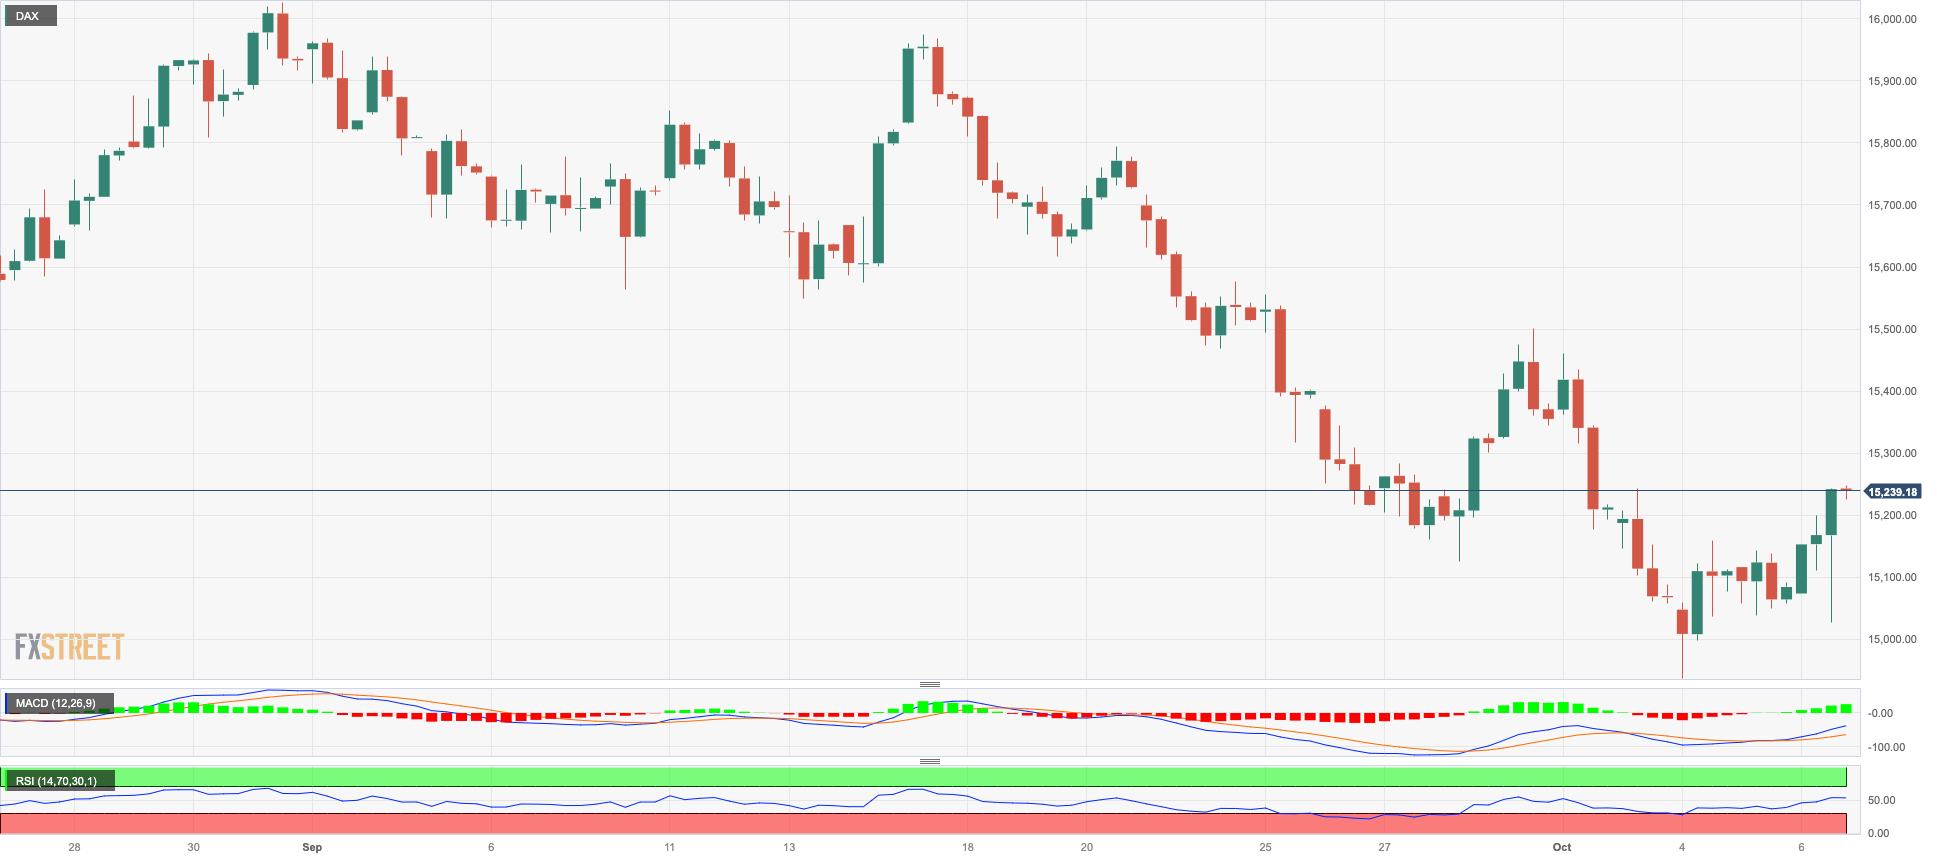
Germany’s benchmark DAX40 regained further ground and closed the week with three-day highs around the 15200 zone.
In fact, German stocks faded Thursday’s decline and resumed the upside on Friday on the back of renewed optimism around a probable soft landing of the US economy, a view that was propped up after robust prints from the US labour market for the month of September.
In addition, expectations of a pause in the European Central Bank’s (ECB) hiking cycle also collaborated with the daily improvement.
Friday’s uptick in the index came in tandem with a small bounce in the 10-year bund yields, which revisited 2.90%.
If sellers regain control, the DAX40 may revisit the October bottom of 14948 (October 4), before proceeding to the March low of 14458 (March 20) and the December 2022 low of 13791 (December 20), all before the 2022 low of 11862 (September 28). On the plus side, the 200-day SMA of 15607 appears to be the first upward hurdle ahead of the September high of 15989 (September 14), which will be followed by weekly tops of 16042 (August 31) and 16060 (August 10). A breakout of this level might result in a retest of the all-time peak of 16528 (July 31). The daily RSI improved to the boundaries of 40.
Best Performers: Zalando SE, Heidelbergcement, Daimler Truck Holding
Worst Performers: : Symrise AG, Siemens Energy AG, RWE AG ST
Resistance levels: 15515 15810 15989 (4H chart)
Support levels: 14948 14809 14458 (4H chart)
NASDAQ
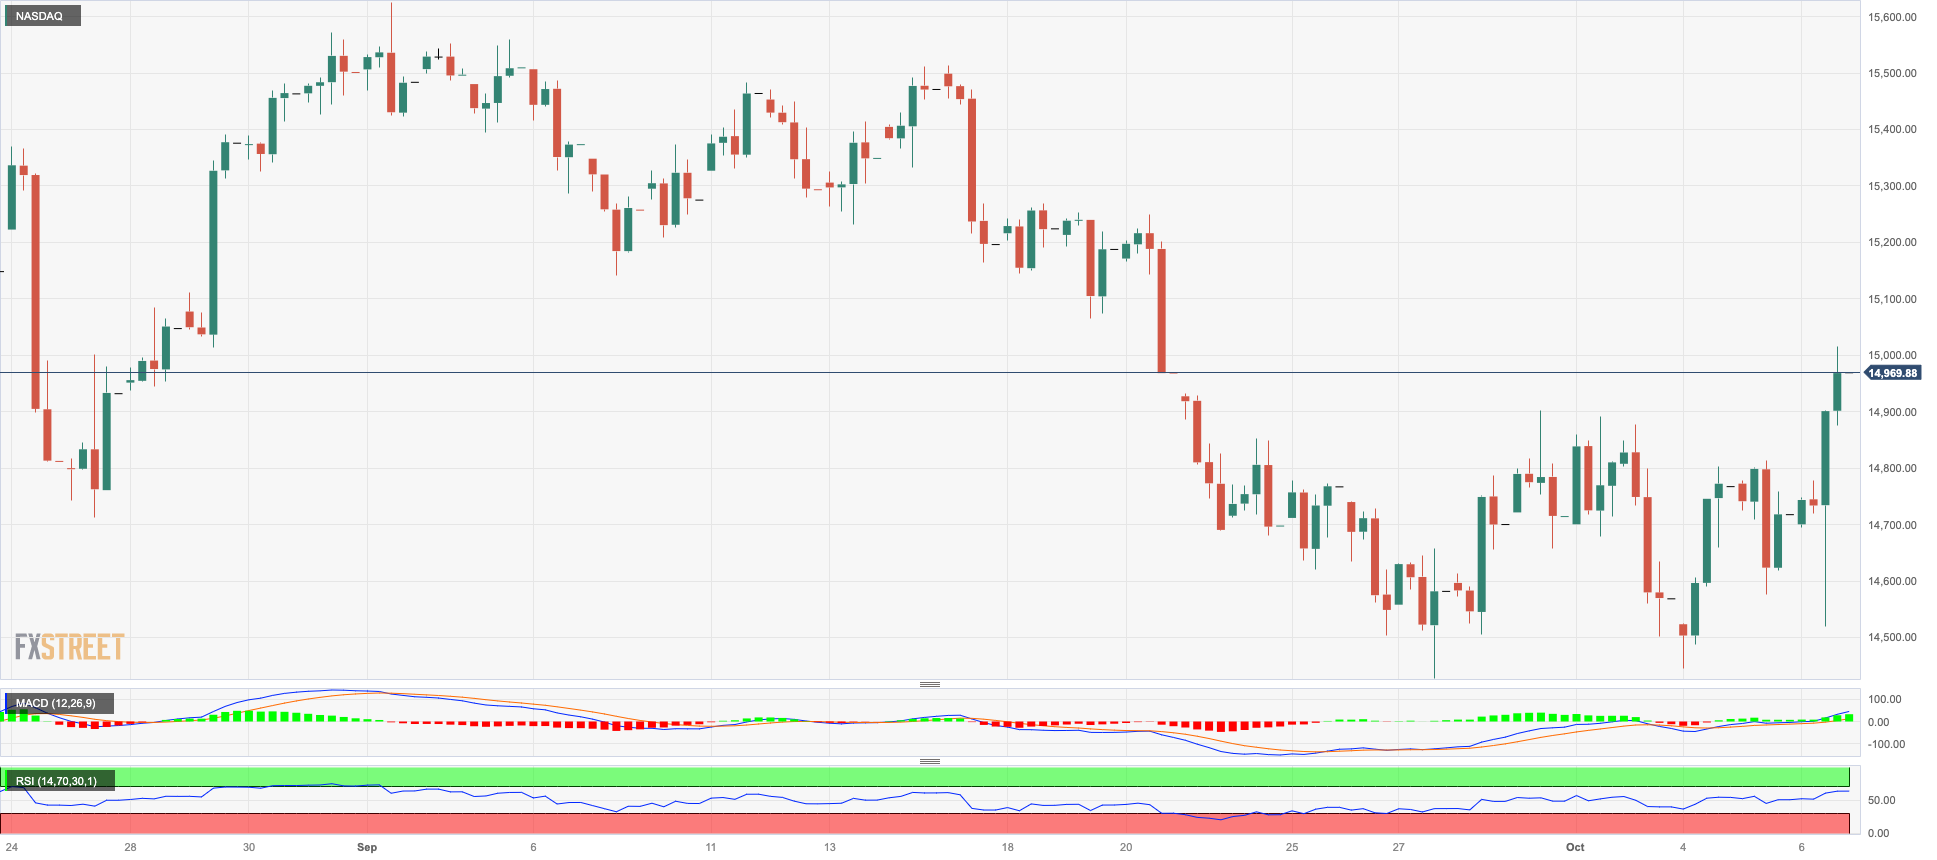
The US tech equities regained the smile and advanced to two-week highs near the 15000 threshold when tracked by the benchmark Nasdaq 100 on Friday.
The strong improvement in the index came in response to further weakness in the greenback and the robust performance of megacaps NVIDIA, Apple, and Microsoft, while the auspicious readings from the September Nonfarm Payrolls also added to the upbeat sentiment.
Further gains could drive the Nasdaq 100 to the 55-day SMA of 15143, ahead of the weekly high of 15512 (September 14) and the September top of 15618 (September 1). The weekly peak of 15803 (July 31) is north of here, prior to the 2023 high of 15932 (July 19) and the round mark of 16000. On the other hand, a drop below the September low of 14432 (September 27) could bring the weekly low of 14283 (June 7) back into target, ahead of the 200-day SMA at 13620 and the April low of 12724 (April 25). Once this zone is cleared, the index could target the March low of 11695 (March 13) before the 2023 low of 10696 (January 6). The daily RSI rose to the 51 region.
Top Gainers: PDD Holdings DRC, CrowdStrike Holdings, Zscaler
Top Losers: Mondelez, Costco, Walgreens Boots
Resistance levels: 15021 15512 15618 (4H chart)
Support levels: 14432 14283 13520 (4H chart)
DOW JONES
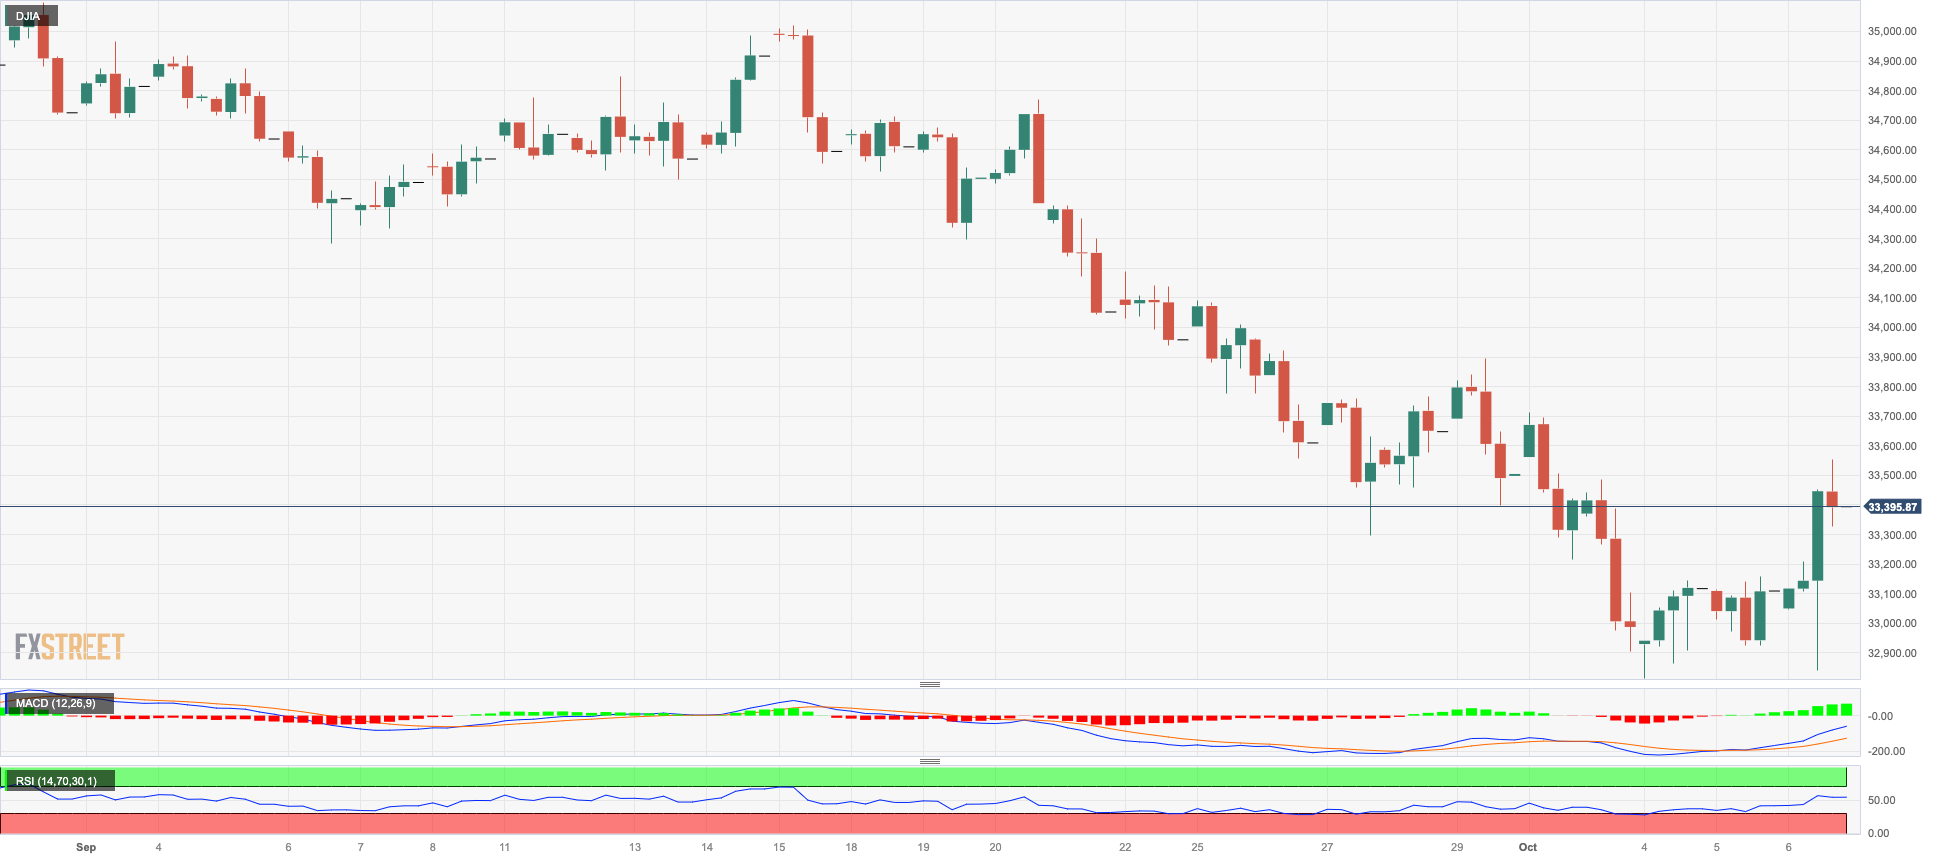
US equities regained some composure and ended the week at four-day highs around the 33400 region when tracked by the reference index Dow Jones on Friday.
The stronger-than-expected job creation in September reinforced the perception of a resilient US economy, while the weaker dollar and an agreement with the autoworkers’ union contributed to the renewed optimism among market participants.
Overall, the Dow Jones gained 0.87% to 33407, the S&P500 rose 1.18% to 4308, and the tech-heavy Nasdaq Composite advanced 1.60% to 13431.
If the Dow Jones breaks below the October low of 32873 (October 4), it could be headed for a likely visit to the May low of 32586 (May 25) before reaching the 2023 low of 31429 (March 15). In contrast, the September high of 34977 (September 14) appears to be the immediate upside barrier ahead of the weekly top of 35070 (August 31) and the 2023 peak of 35679 (August 1). If the latter is surpassed, the 2022 high of 35824 (February 9) could come into view before the all-time top of 36952 (January 5, 2022). The day-to-day RSI leapt past 37.
Top Performers: Salesforce Inc, Walt Disney, Honeywell
Worst Performers: Walmart, Walgreens Boots, McDonald’s
Resistance levels: 33893 34269 34977 (4H chart)
Support levels: 32846 32586 31805 (4H chart)
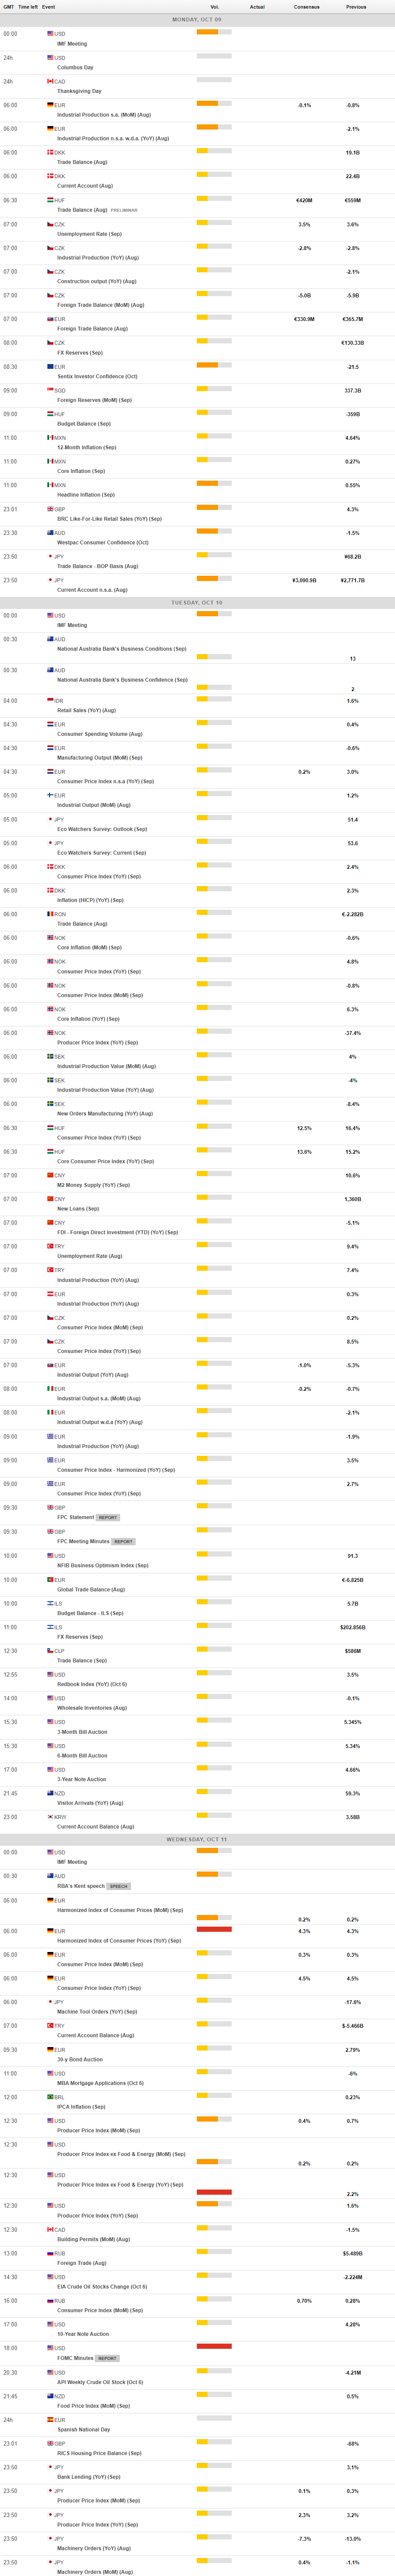
MACROECONOMIC EVENTS
All Information & Updates provided by:

All information relating to the financial markets available on this page has been prepared and issued by FXStreet (Forexstreet SL, Spain, Reg: B62498233) on the basis of publicly available information and all information believed to be reliable and does not conflict with Kuwaiti local laws, and all necessary care has been taken to before the company to ensure that the facts mentioned are correct from the source.
NCM Investment nor any of its directors or employees shall in any way be held responsible for the contents of this news, and the information contained on this page is intended only to provide clients with publicly available information and should not be construed as investment advice, report or analysis and/or constitute an offer or invitation to buy or sell financial instruments of any kind.
RISK WARNING: Forex and CFDs are highly risky leveraged products, as losses can exceed deposits. Please ensure you understand all the risks and take independent advice if necessary. NCM will segregate the clients based on the criteria of the regulator and its bylaws. NCM does not provide any advisory service; the material published does not constitute advice or a recommendation for a transaction in any financial instrument. NCM accepts no responsibility for any use of the content presented and any consequences of that use. Anyone acting on the information provided does so at their own risk.