Daily Market Updates
10 Oct 2023
USDJPY
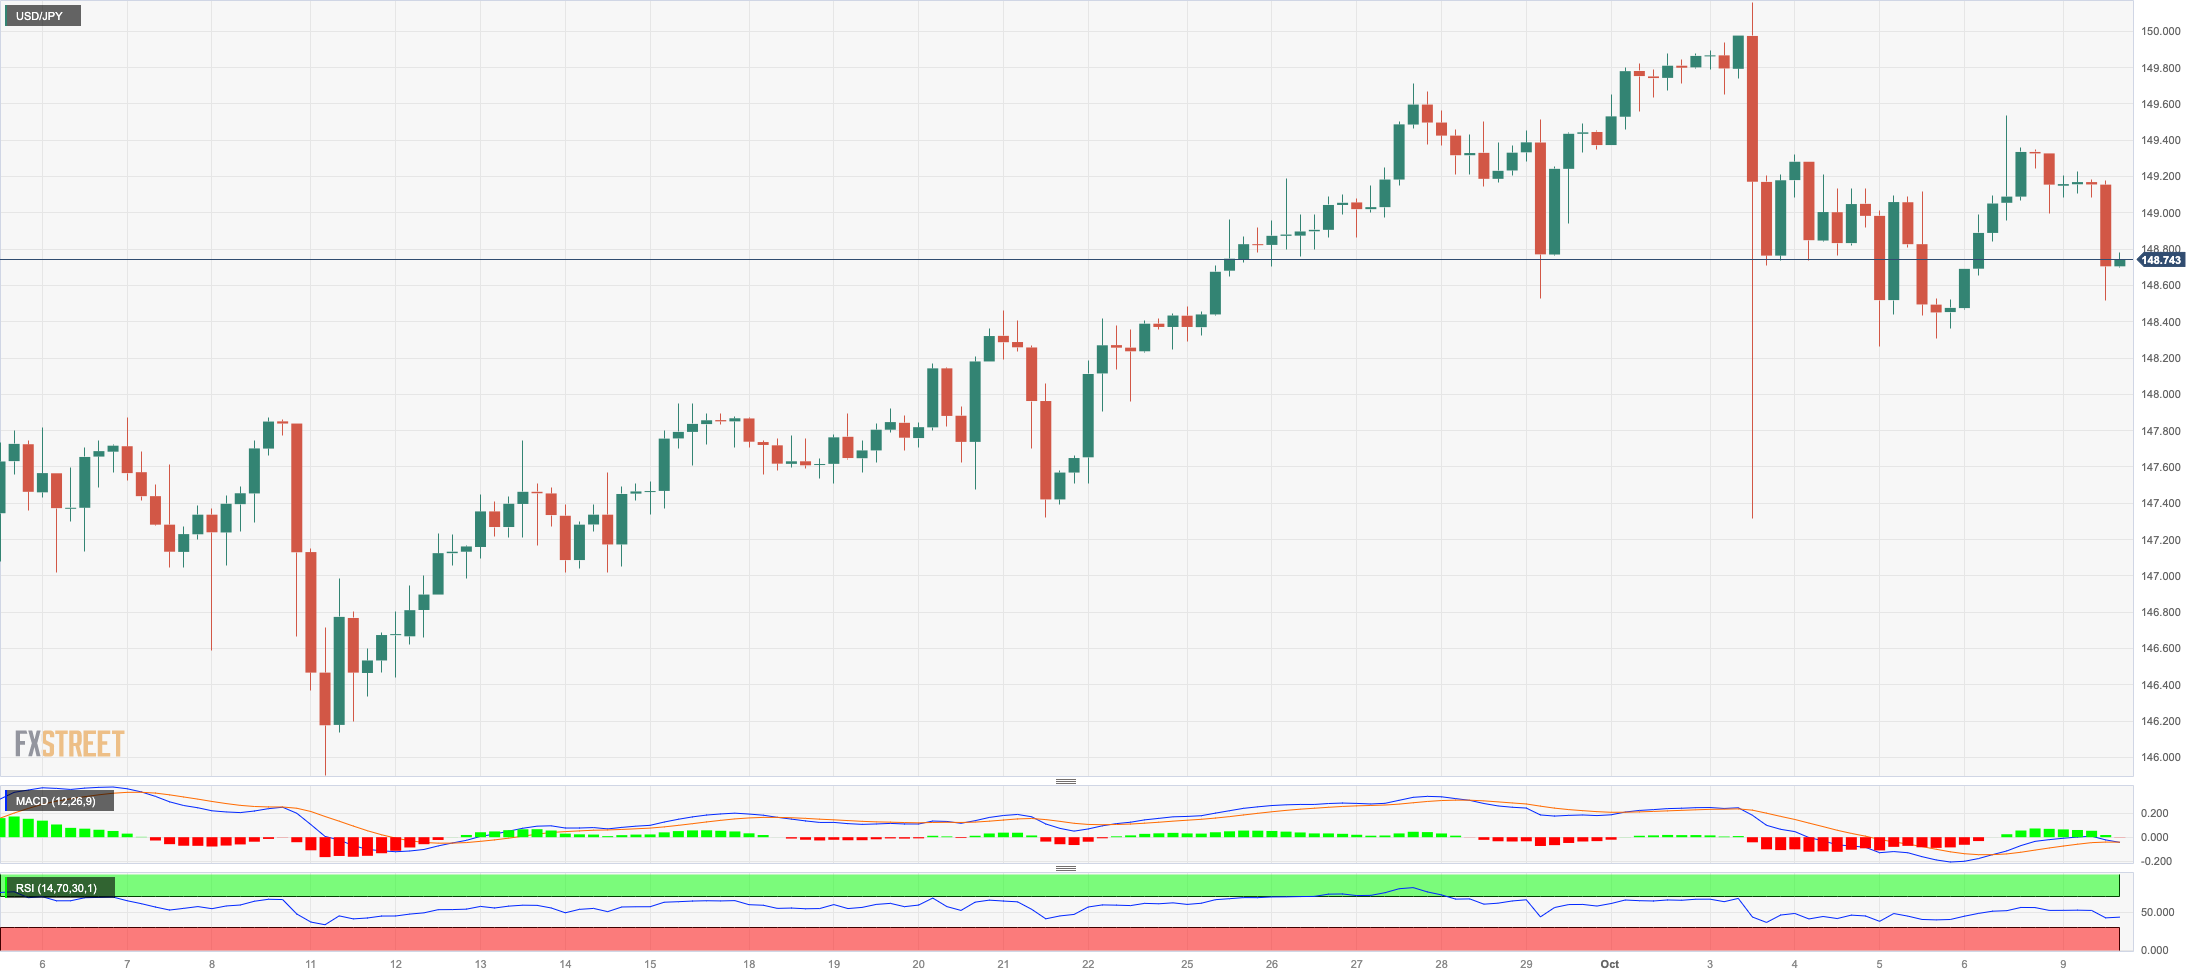
USD/JPY extended the erratic performance seen as of late and dropped markedly to the mid-148.00s on Monday, setting aside at the same time Friday’s decent advance.
The resumption of geopolitical-driven risk aversion in the global markets lent support to the Japanese safe haven and accompanied the daily drop in the pair, which came in contrast to the daily gains in the dollar.
In Japan, the JGB 10-year yields appeared sidelined at around 0.80%.
If USD/JPY breaks above the 2023 high of 150.16 (October 3), it might target the 2022 top of 151.94 (October 21). The weekly low of 145.89 (September 11), on the flip side, looks supported by the intermediate 55-day SMA of 146.10 and comes before the September low of 144.43 (September 1). If the latter is breached, the market may fall to the transitory 100-day SMA at 143.82 before the August low of 141.50 (August 7). South from here emerges the 200-day SMA of 138.51 prior to the July low of 137.23 (July 14). The everyday RSI dropped to the 55 zone.
Resistance levels: 149.53 150.16 151.94 (4H chart)
Support levels: 148.25 147.27 145.89 (4H chart)
GBPUSD
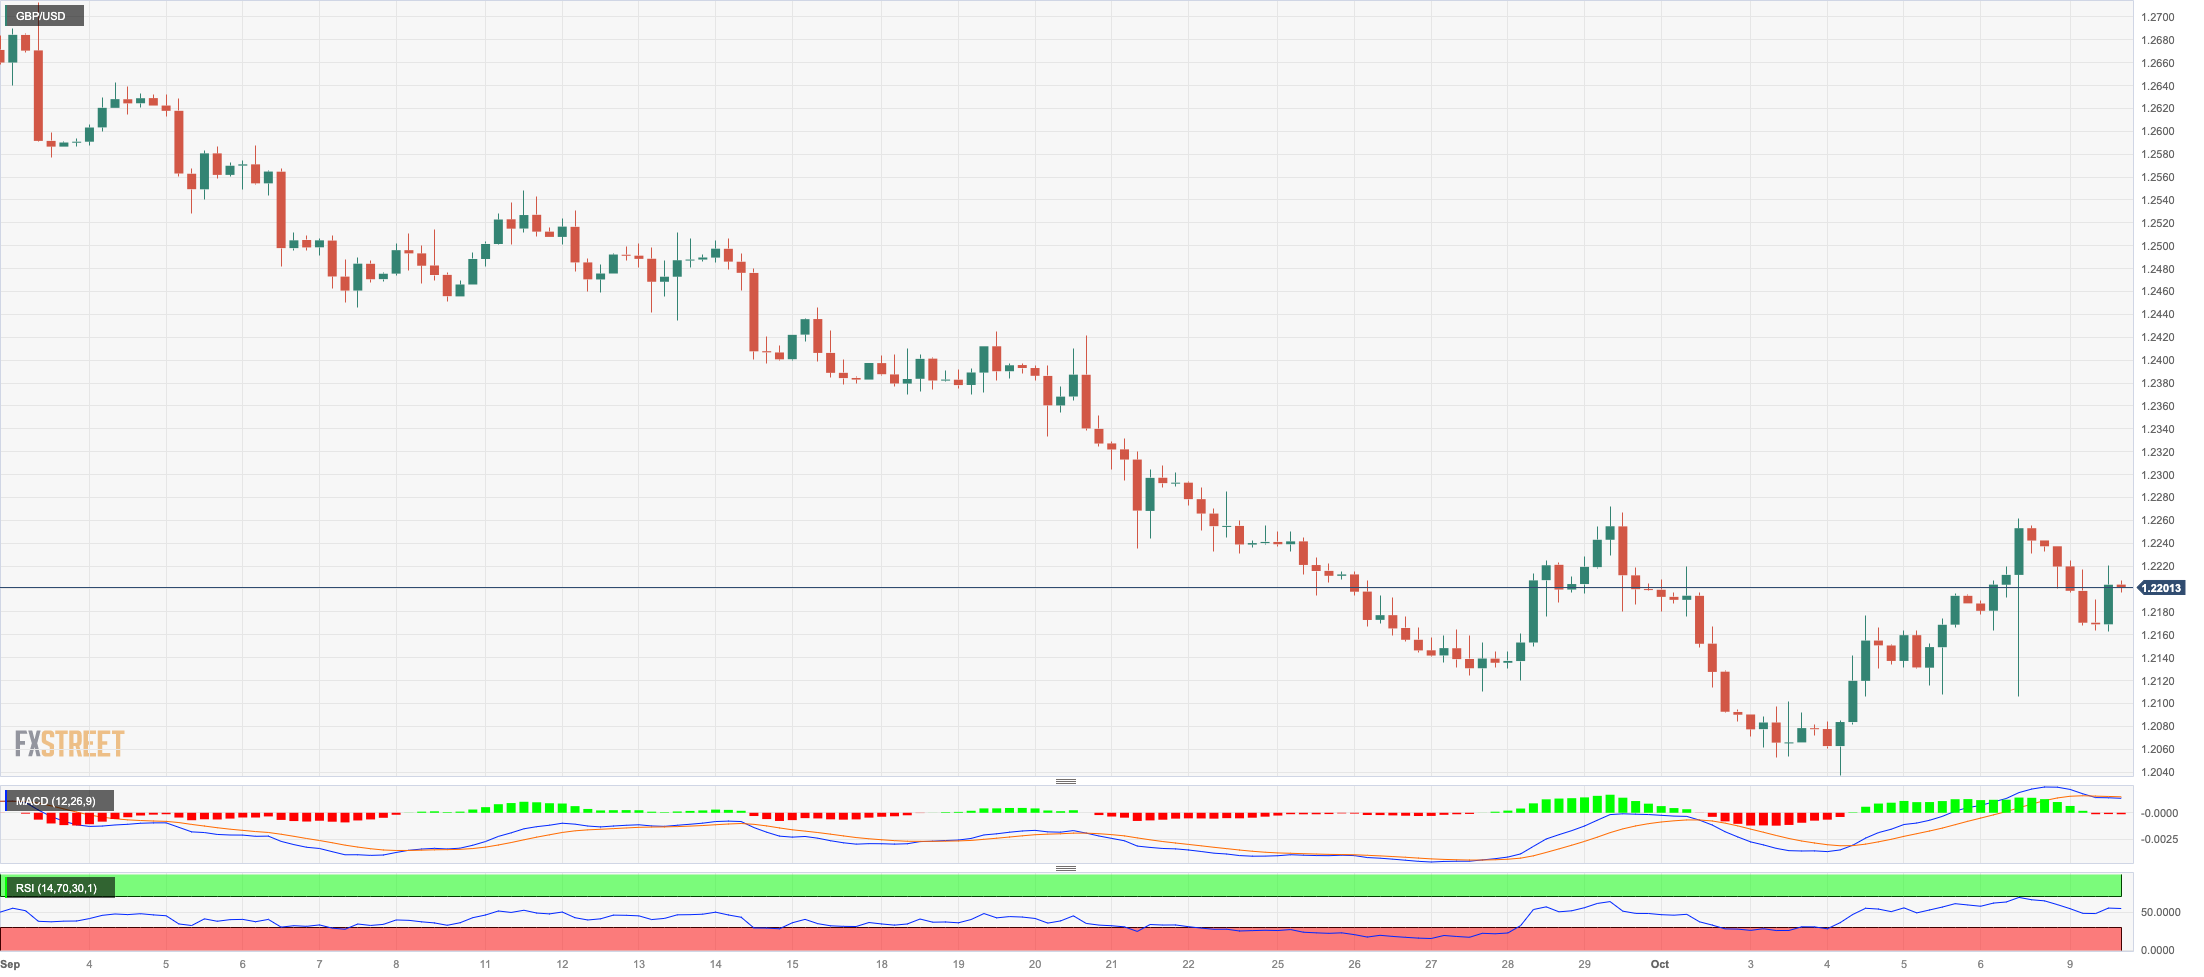
In line with the rest of the risky assets, the British pound surrendered part of last week’s advance and revisited the 1.2160 regio at the beginning of the week.
Indeed, Cable left behind three consecutive daily pullbacks in tandem with the rebound in the greenback amidst the generalized risk-off sentiment in response to geopolitical effervescence.
In the UK bond market, 10-year gilt yields dropped to five-day lows around 4.50%, mirroring the performance of their European peers.
The next uptrend for GBP/USD is the weekly high at 1.2271 (September 20) ahead of the 200-day SMA at 1.2437. North of here is the minor weekly top at 1.2548 (September 11), which looks reinforced by the interim 55-day SMA (1.2535) and aligns ahead of the provisional 100-day at 1.2603. Crossing the latter opens the door to weekly peaks at 1.2746 (August 30), 1.2818 (August 10) and 1.2995 (July 27), all ahead of the critical 1.3000 level. On the other hand, if Cable falls below the October low of 1.2037 (October 3), it could retreat to the significant round milestone of 1.2000 before falling to the 2023 low of 1.1802 (March 8). The daily RSI deflated to the 40 region.
Resistance levels: 1.2261 1.2271 1.2421 (4H chart)
Support levels: 1.2105 1.2037 1.2010 (4H chart)
AUDUSD
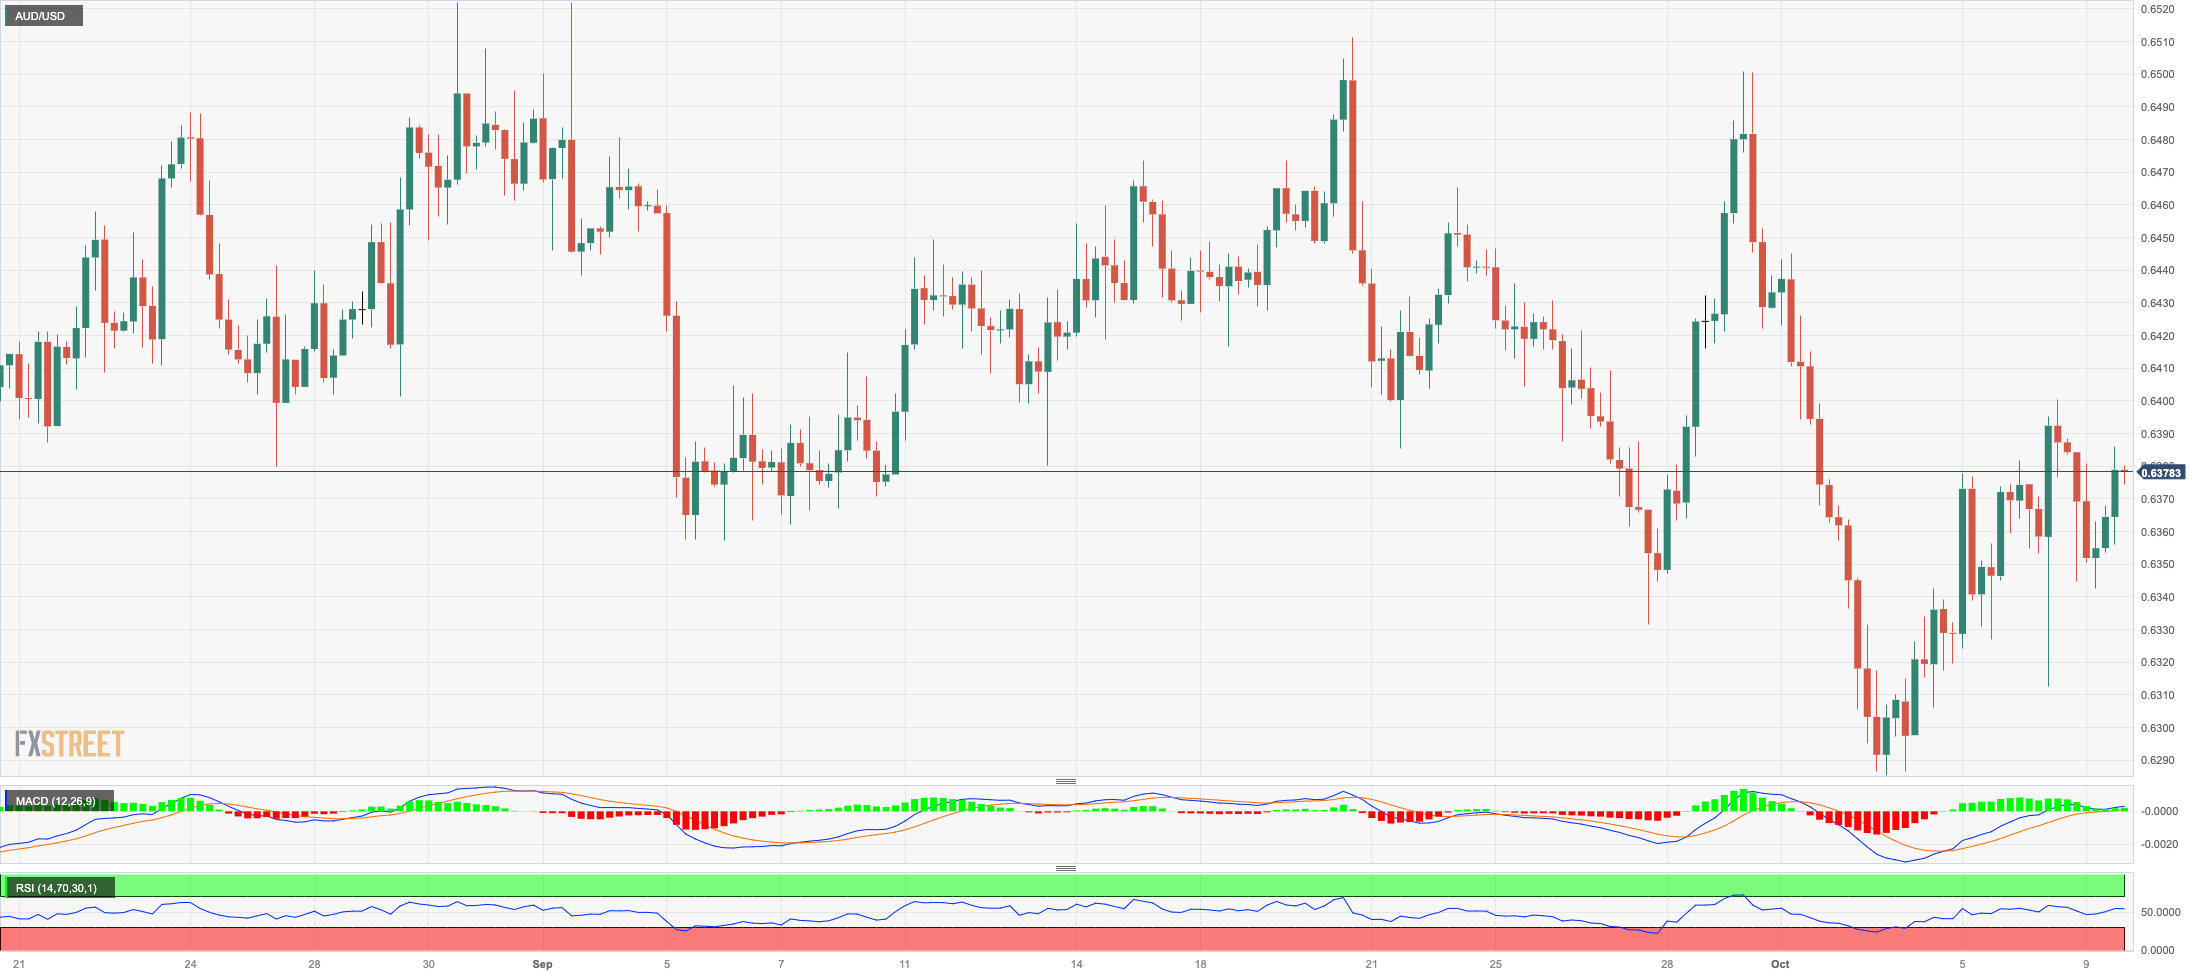
AUD/USD managed to reverse an initial drop to the 0.6340 region, ending the session with modest losses around 0.6380 at the beginning of the week.
The pick-up in buying interest in the greenback initially weighed on the Aussie dollar, although the broad-based positive session in the commodity complex helped the high-beta currency trim part of those losses and limit the downside at the same time.
The Australian docket was empty on Monday.
The most immediate threat to AUD/USD is the 2023 low at 0.6285 (October 3), seconded by the November 2022 low at 0.6272 (November 7) and the 2022 low at 0.6179 (October 13). On the upside, the next resistance is at the weekly high of 0.6522 (August 30), prior to another weekly top of 0.6616 (August 10) and the 200-day SMA of 0.6676. A further rise could take the pair to its July peak of 0.6894 (July 14), which is closely followed by the June high of 0.6899 (June 16) and the important milestone of 0.7000. The breakout from this region reveals the weekly top at 0.7029 (February 14) before the 2023 peak at 0.7157 (February 2). The daily RSI settled just above 46.
Resistance levels: 0.6400 0.6415 0.6501 (4H chart)
Support levels: 0.6312 0.6285 0.6272 (4H chart)
GOLD
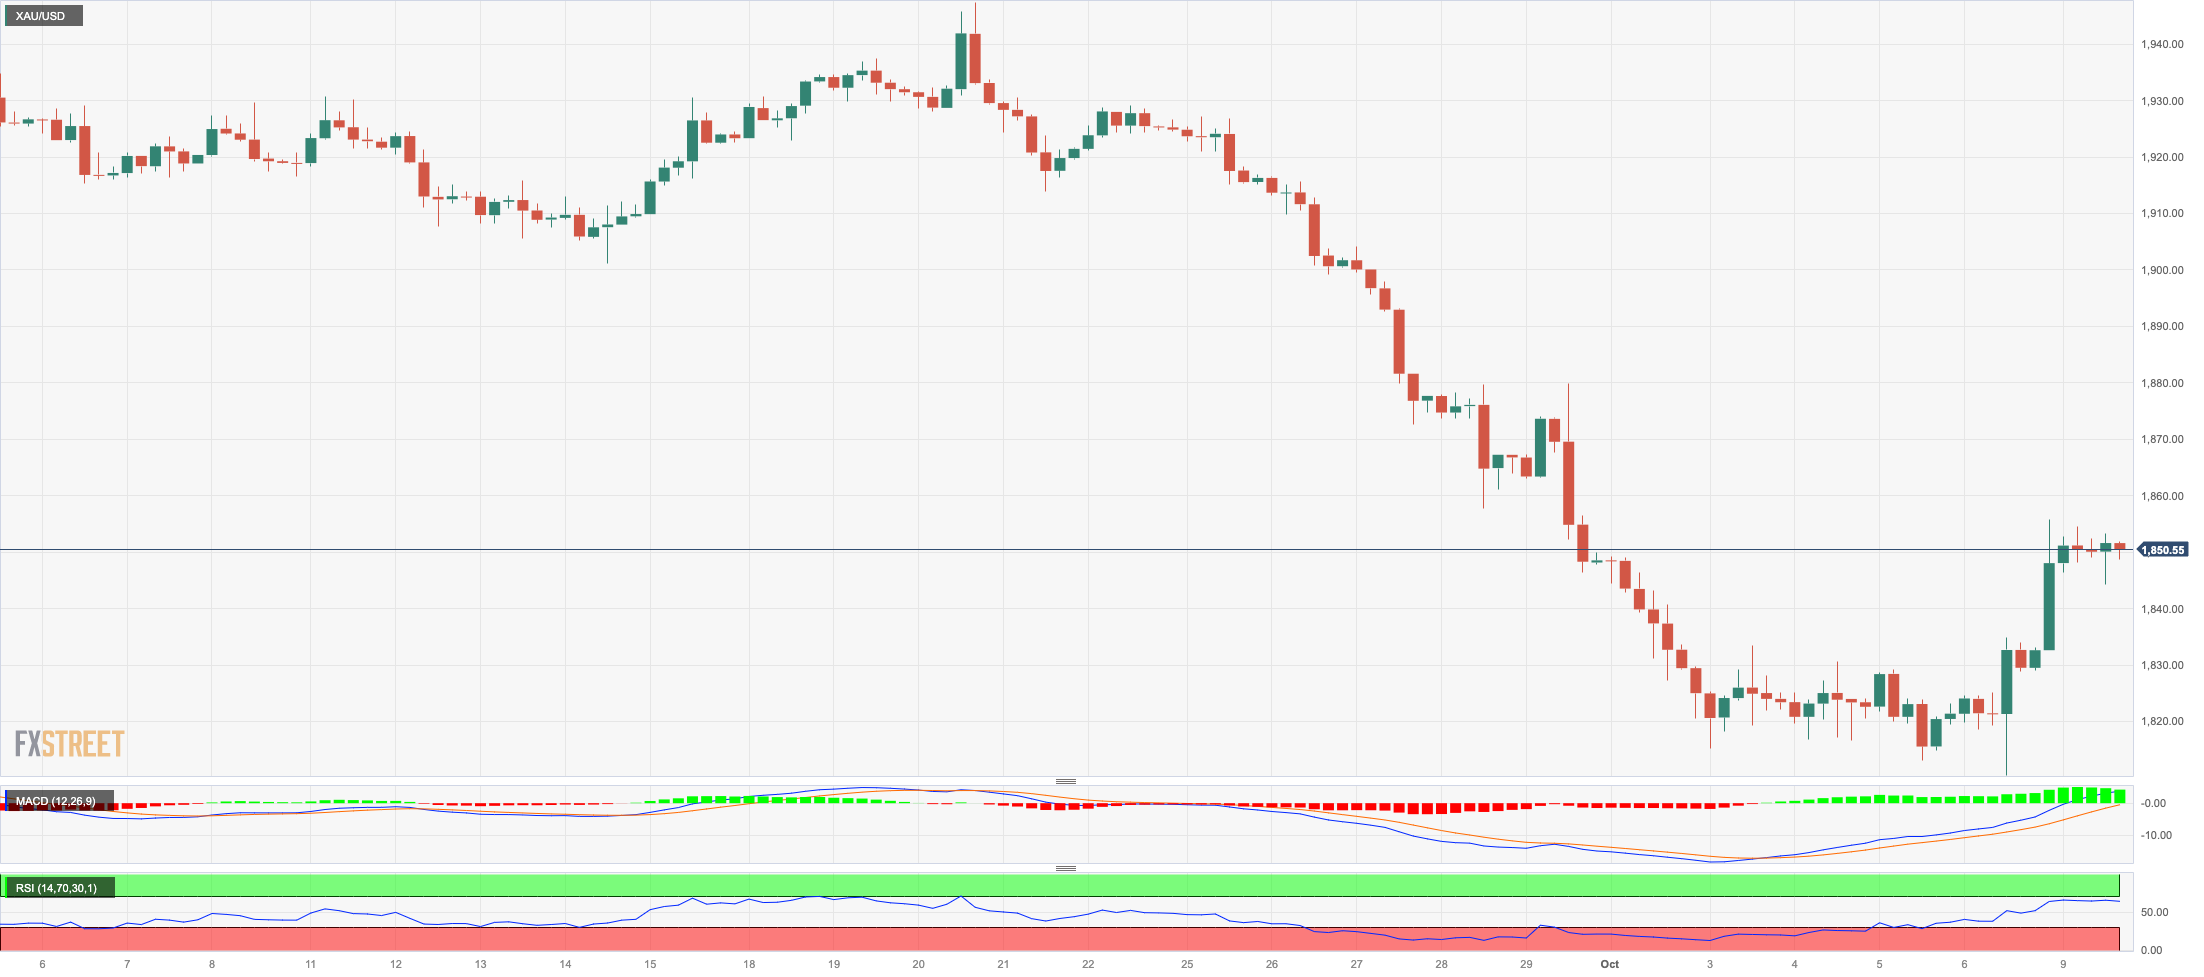
Gold prices added to Friday’s decent rebound and surpassed the key $1850 mark per troy ounce at the beginning of the week.
The continuation of the bullish move in the precious metal came despite the demand for the greenback, although it was fueled further by the flight-to-safety environment prevailing in the global markets due to fresh geopolitical concerns in the Near East.
Moving forward and other than geopolitics, the yellow metal is expected to remain under the microscope in light of the upcoming release of US inflation figures and the potential implications for the Fed’s ongoing tightening conditions.
Extra gains in gold are now expected to retarget initial resistance at the key 200-day SMA at $1928, prior to the weekly high at $1947 (September 20) and the September top at $1953 (September 1). If the precious metal breaks above the latter, it might aim for the July peak of $1987 (July 20), which is just below the crucial $2000 mark. From here, the 2023 high of $2067 (May 4) emerges, followed by the 2022 top of $2070 (March 8) and the all-time peak of $2075 (August 7, 2020). Just the opposite, a breach of the October low of $1810 (October 6) exposes the 2023 bottom of $1804 (February 28), which is just ahead of the important reversal zone at $1800.
Resistance levels: $1855 $1879 $1904 (4H chart)
Support levels: $1813 $1804 $1784 (4H chart)
CRUDE WTI
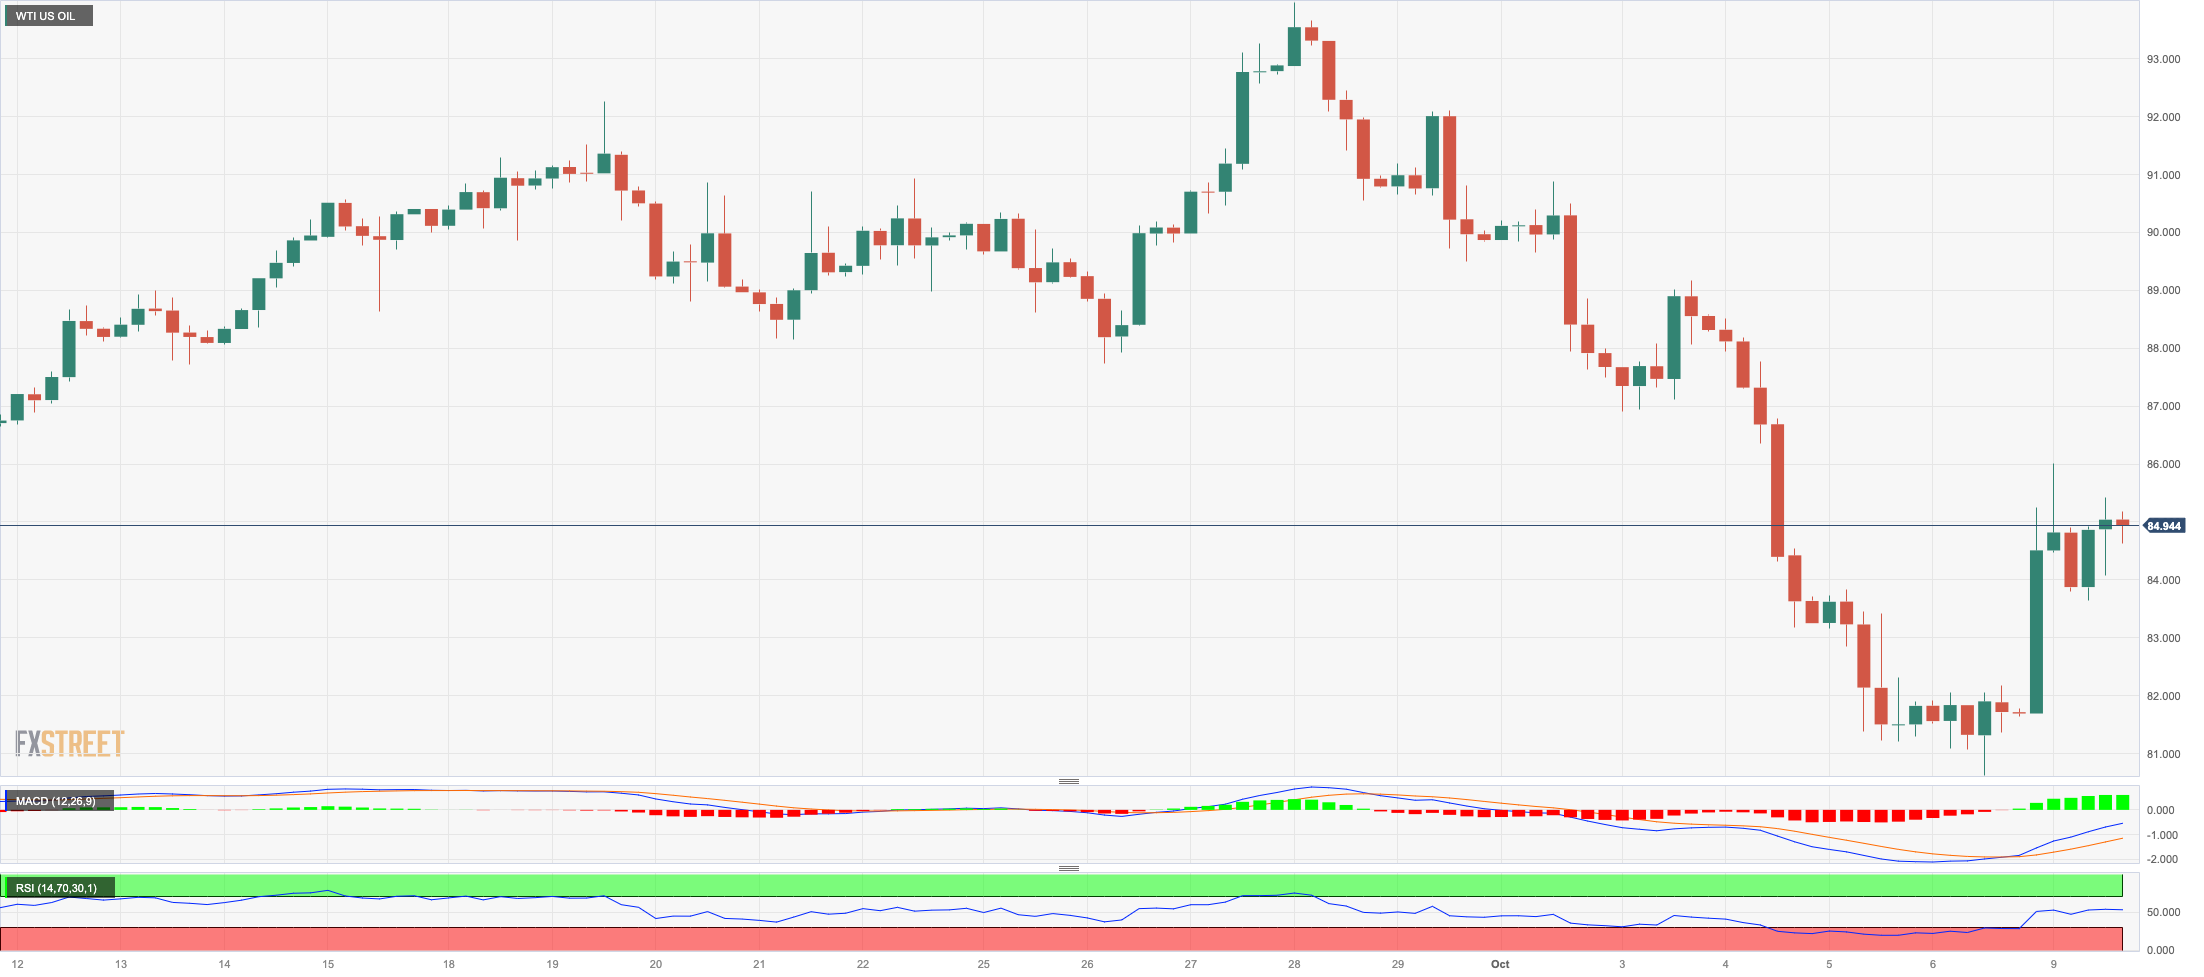
At the onset of the week, prices of WTI experienced a gap higher and surged to three-day highs, surpassing the $87.00 per barrel.
This upward movement in the commodity was triggered by renewed geopolitical tensions between Israel and Hamas over the weekend, creating concerns about potential regional ramifications.
Adding to this dynamic was the persistent narrative of limited supply, further supported by the voluntary oil production cuts implemented by Saudi Arabia and the reduction in crude oil exports by Russia.
The resumption of the selling pressure could prompt WTI prices to return to the important $80.00 level ahead of the August low of $77.64 (August 24), which appears to be supported by the 200-day SMA at $77.52. If the latter is cleared, WTI could fall to the weekly low of $73.89 (July 17) before the June low of $66.85 (June 12) and the 2023 low of $63.61 (May 4). Further south, the important $60.00 per barrel level appears. On the upside, a breakout above the 2023 high of $94.99 (September 28) could put a test of the weekly top of $97.65 (August 30, 2022) back on the radar ahead of the psychological $100.00 mark per barrel.
Resistance levels: $87.20 $90.23 $93.06 (4H chart)
Support levels: $81.47 $79.31 $77.56 (4H chart)
GER40
Geopolitical tensions resurfaced after an attack by the Islamist group Hamas on Israel over the weekend, causing significant market impact.
As a result, the German and other European stock markets opened the week on a defensive note due to increased risk aversion. There are concerns that the conflict could potentially escalate and have wider implications for the region.
Furthermore, the surge in crude oil prices has added to ongoing fears about inflation and the potential impact on major central banks' monetary policy. These concerns are also linked to worries about a possible recession or stagflation in Europe.
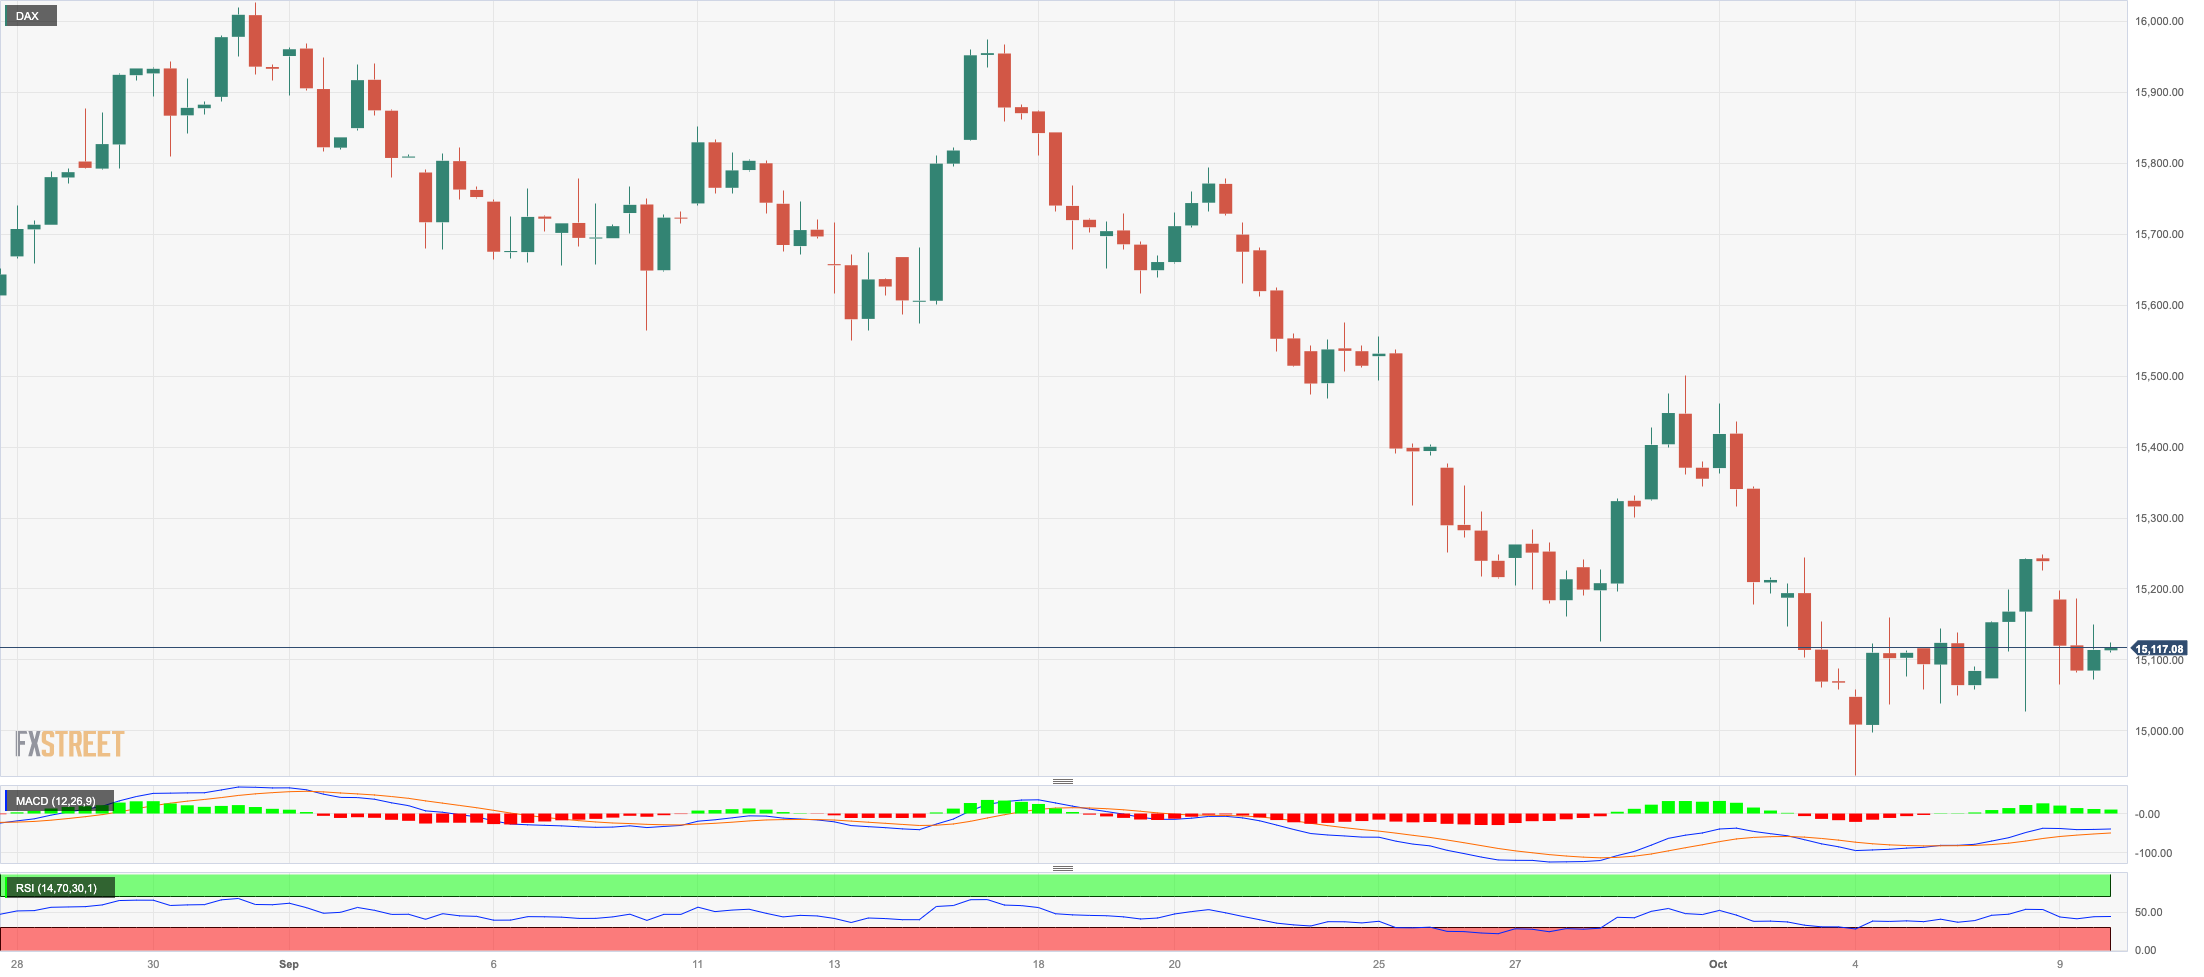
The decline in the DAX40 was accompanied by a drop in the 10-year bund yields to multi-day lows, with yields falling below 2.80%. This decline in yields reflects the flight to safety and increased demand for government bonds during times of market uncertainty.
If sellers regain control, the DAX40 could retarget the October low of 14948 (October 4) before targeting the March low of 14458 (March 20) and the December low of 13791 (December 20), all before the 2022 low of 11862 (September 28). On the upside, the 200-day SMA at 15613 appears to be the first upside hurdle ahead of the September high of 15989 (September 14), to be followed by weekly highs of 16042 (August 31) and 16060 (August 10). A break above this level could lead to a retest of the all-time peak of 16528 (July 31). The RSI on the daily chart deflated below 37.
Best Performers: Rheinmetall, Adidas, E.ON SE
Worst Performers: : Daimler Truck Holding, Infineon, Continental AG
Resistance levels: 15230 15515 15810 (4H chart)
Support levels: 14948 14809 14458 (4H chart)
NASDAQ
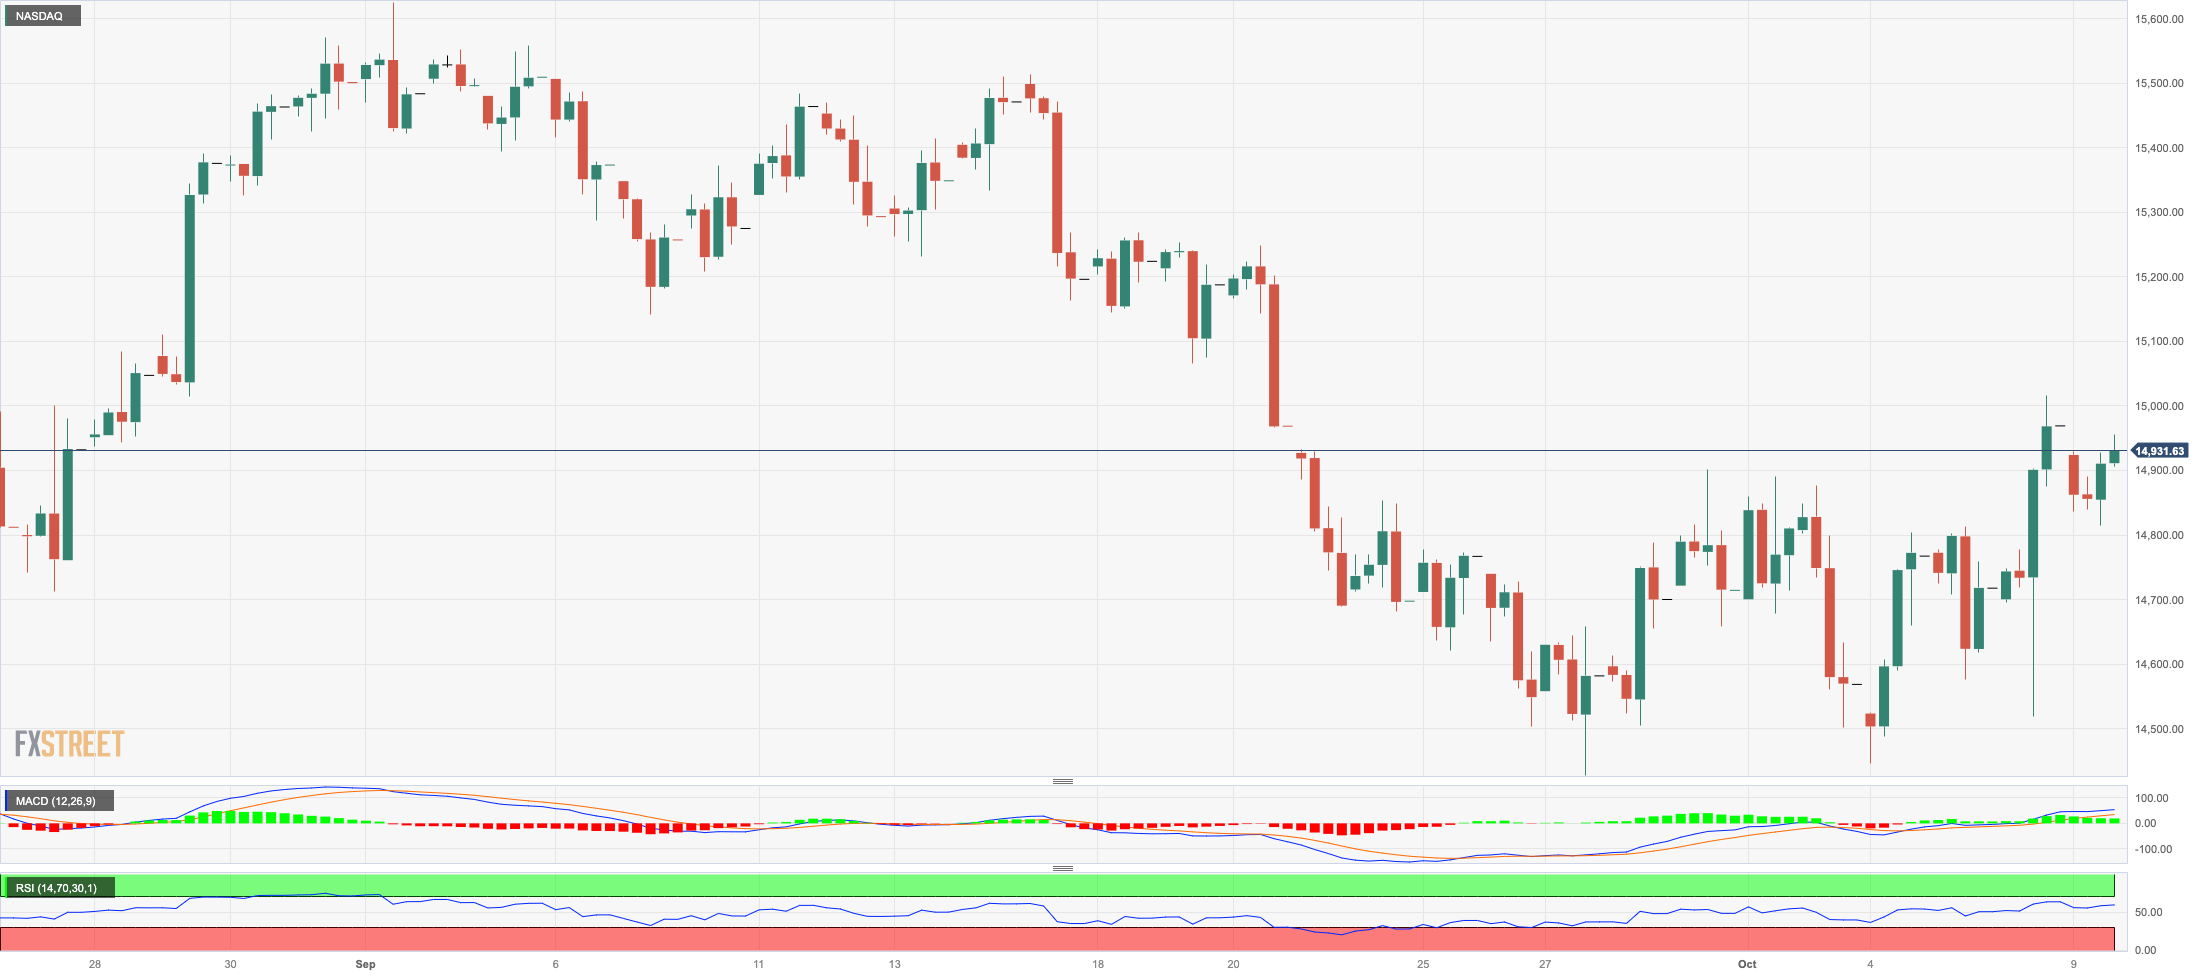
The generalized risk aversion atmosphere coupled with the lack of activity in the US bond market and the surge in the greenback, all weighed on the US tech sector, forcing the reference Nasdaq 100 to give away part of Friday’s strong upside.
In addition, cautious trade is expected to prevail in the next couple of sessions ahead of the publication of the US CPI for the month of September (October 12).
More increases might push the Nasdaq 100 to challenge the October high of 15021 (October 6) ahead of the provisional 55-day SMA of 15134 and the weekly top of 15512 (September 14). The breakout of the latter could open the door to the September peak of 15618 (September 1) prior to the weekly high of 15803 (July 31), and the 2023 top of 15932 (July 19), which precedes the round mark of 16000. A decline below the September low of 14432 (September 27), on the other hand, might put the weekly low of 14283 (June 7) back into play, ahead of the 200-day SMA at 13659 and the April low of 12724 ((April 25). After clearing this zone, the index might aim for the March low of 11695 (March 13) before the 2023 low of 10696 (January 6). The daily RSI drifted lower to the sub-50 region.
Top Gainers: Zscaler, Baker Hughes, Diamondback
Top Losers: Lucid Group, Moderna, Datadog
Resistance levels: 15021 15512 15618 (4H chart)
Support levels: 14432 14283 13520 (4H chart)
DOW JONES
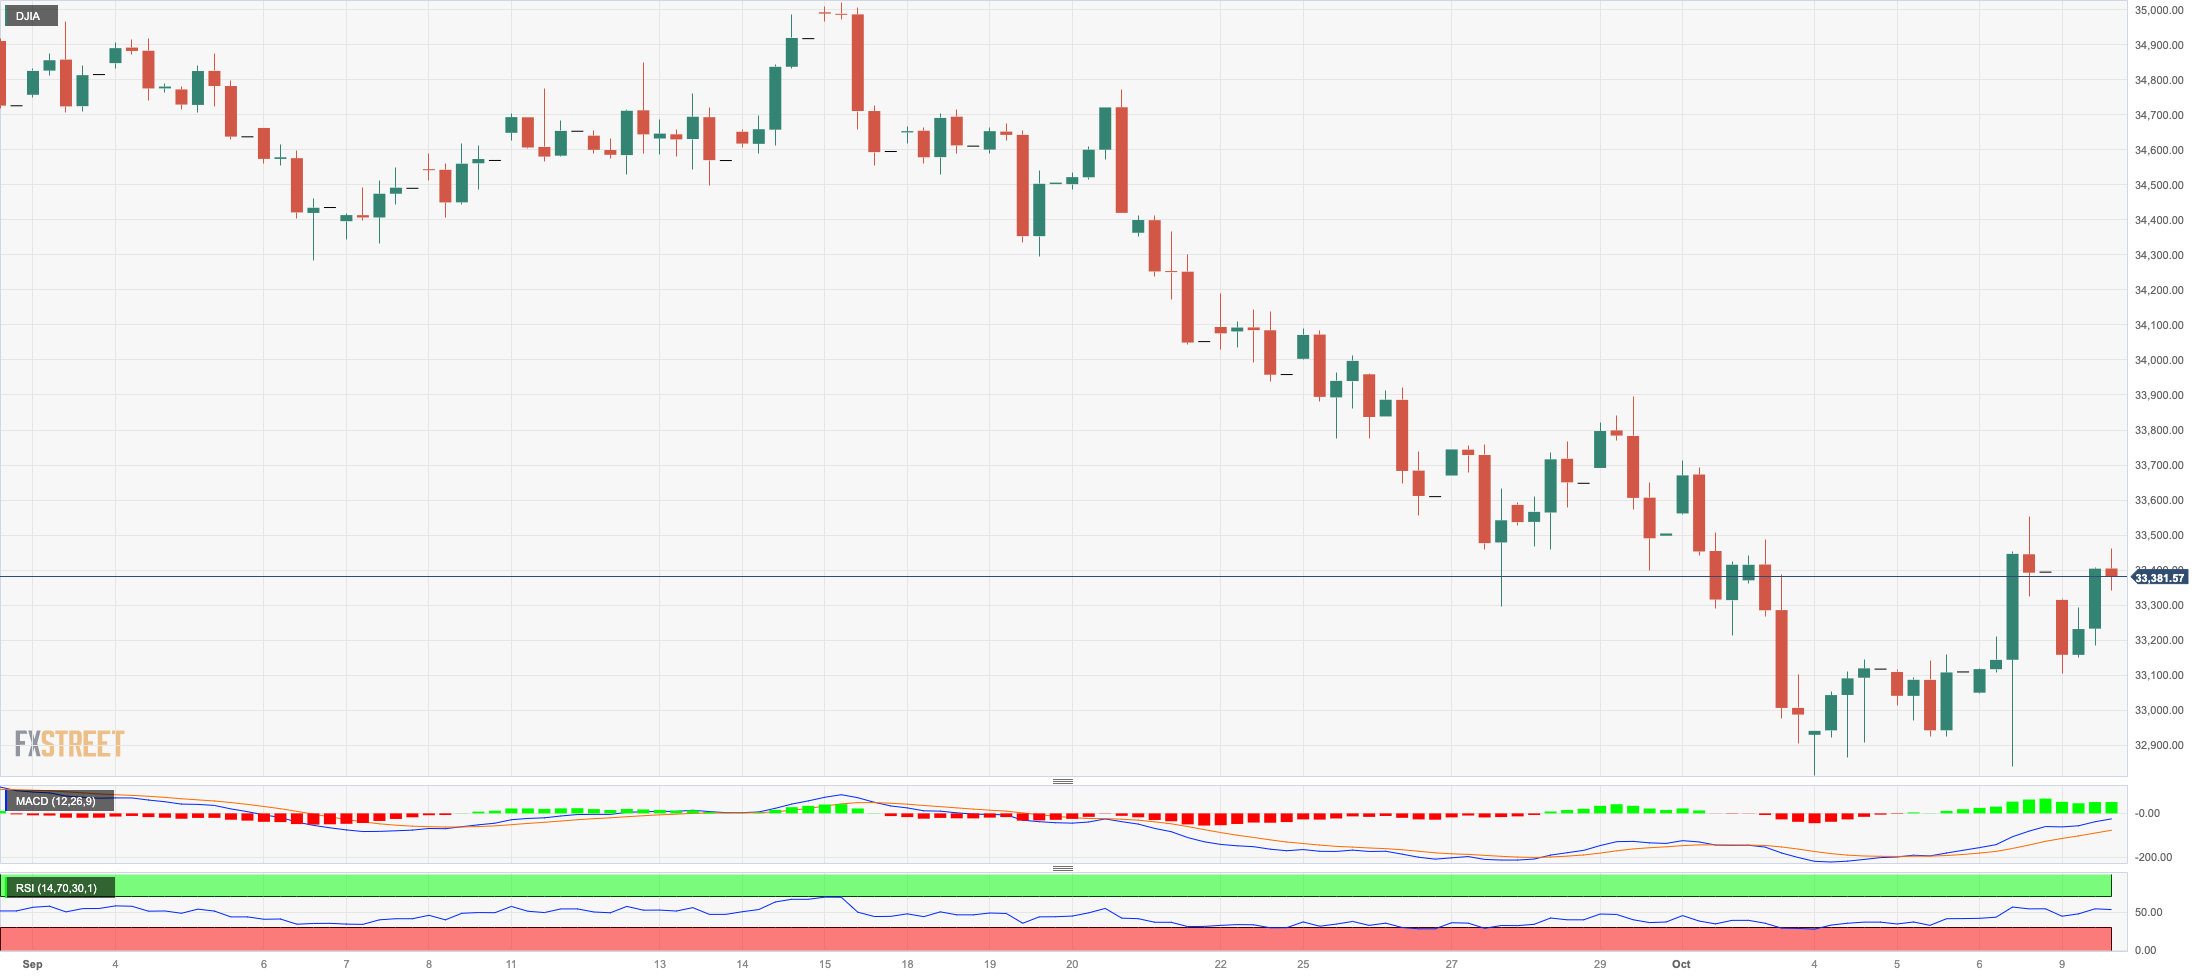
The US benchmark Dow Jones started the week on the backfoot and hovered around the 33400 region following Friday’s pronounced rebound.
Indeed, cautiousness prevailed among market participants on the back of the re-emergence of risk aversion led by geopolitical concerns, while prudence also kicked in ahead of the release of key US inflation figures tracked by the CPI later in the week.
All in all, the Dow Jones retreated 0.15% to 33358, the S&P500 dropped 0.15% to 4302, and the tech-focused Nasdaq Composite deflated 0.42% to 13374.
If the Dow Jones falls below the October low of 32873 (October 4), it is likely to touch the May low of 32586 (May 25) before reaching the 2023 low of 31429 (March 15). In contrast, there is an immediate hurdle at the 200-day SMA at 33805 followed by the temporary 100-day and 55-day SMAs at 34269 and 34559, respectively, all prior to the September high of 34977 (September 14). North from here comes the weekly top of 35070 (August 31) and the 2023 peak of 35679 (August 1). If the latter is exceeded, the 2022 high of 35824 (February 9) may be reached before the all-time high of 36952 (January 5, 2022). The day-to-day RSI eased below 37.
Top Performers: Chevron, Walt Disney, Verizon
Worst Performers: Coca-Cola, Intel, Walmart
Resistance levels: 33557 33893 34269 (4H chart)
Support levels: 32846 32586 31805 (4H chart)
MACROECONOMIC EVENTS


