
- Contact Us:
-

-

-

-


Daily Market Updates
11 Oct 2023
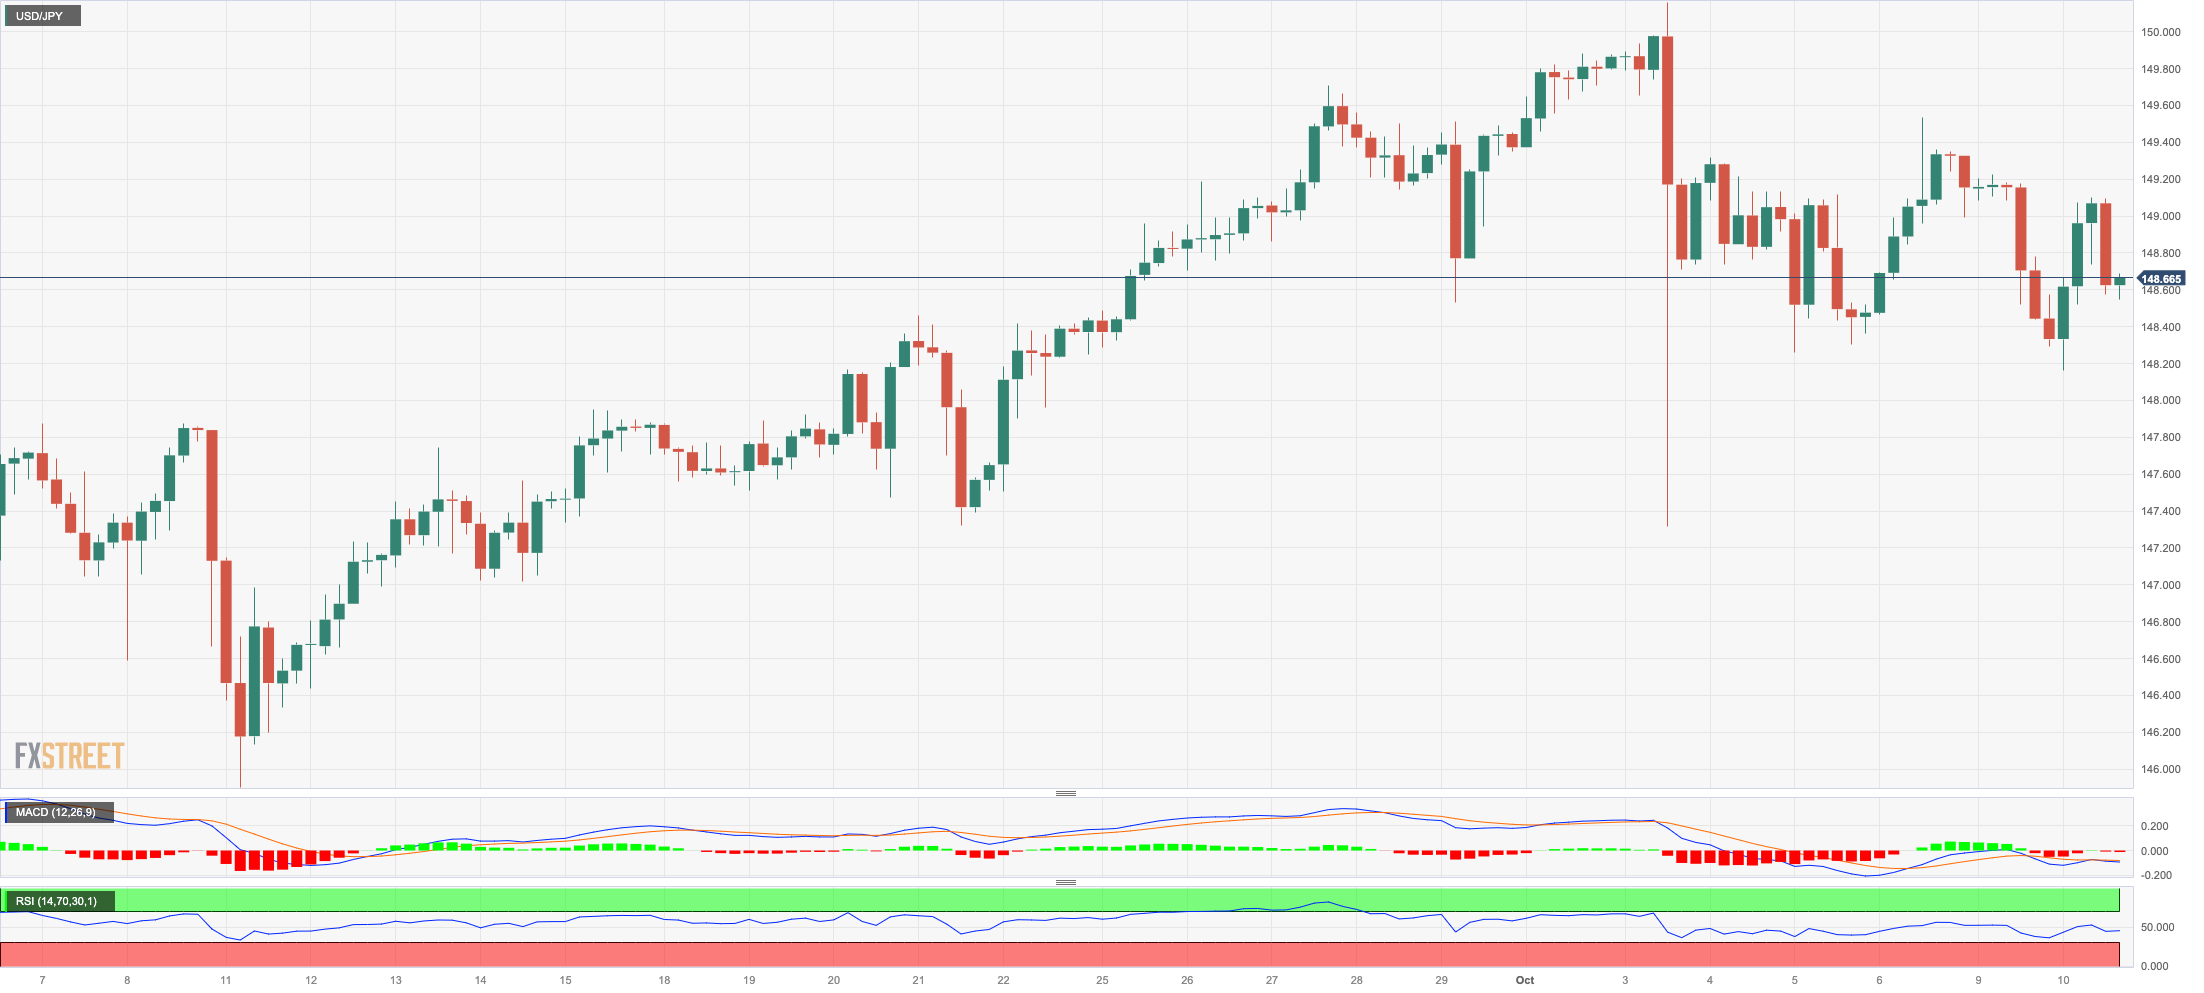
USDJPY
The better tone in the risk-associated universe put the Japanese yen under further pressure and sponsored the daily uptick in USD/JPY, this time briefly surpassing the key 149.00 hurdle on Tuesday.
Additionally, the mixed performance in US yields across different maturities vs. a modest decline in JGB 10-year yields seems to have also bolstered the daily uptick in spot.
Some news around the BoJ said that the central bank might raise the inflation goal to near 3.0% for FY 2023.
In the Japanese calendar, the Eco Watchers Survey Current eased to 49.9 and the Eco Watchers Survey Outlook eased to 49.5, both prints for the month of September.
If USD/JPY breaks above the 2023 high at 150.16 (October 3), it could target the 2022 top at 151.94 (October 21). On the flip side, the 55-day SMA at 146.24 should offer provisional support prior to the weekly low of 145.89 (September 11). The loss of the latter exposes a potential deeper decline to the September low of 144.43 (September 1) ahead of the temporary 100-day SMA at 143.92 and the August low of 141.50 (August 7). South of this, the 200-day SMA is at 138.60 before the July low of 137.23 (July 14). The everyday RSI ticked a tad higher to the proximity of 55.
Resistance levels: 149.53 150.16 151.94 (4H chart)
Support levels: 148.16 147.27 145.89 (4H chart)
GBPUSD
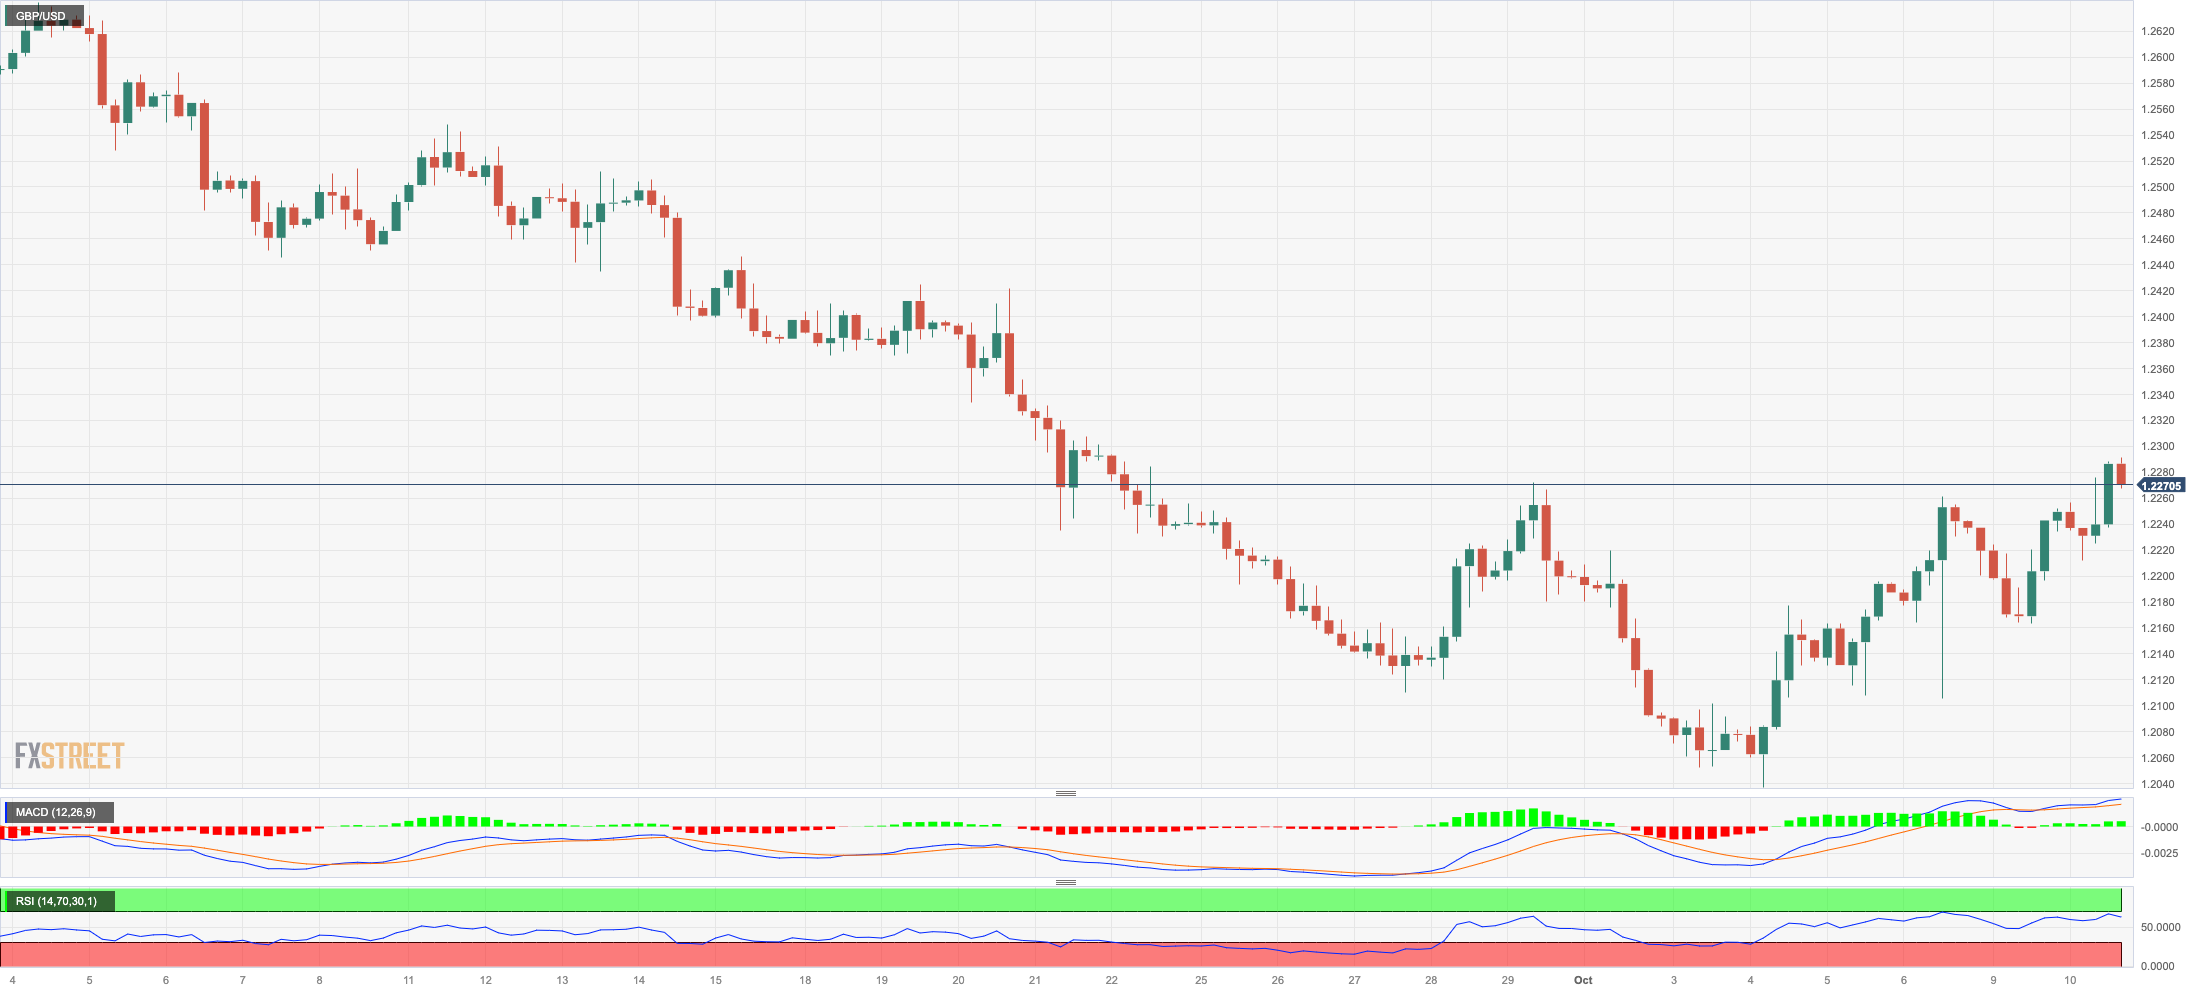
GBP/USD extended its upside for the fifth consecutive session on Tuesday on the back of persistent selling pressure hitting the greenback.
Indeed, the better tone in the risk complex lent fresh wings to the British pound and the rest of the risky assets, motivating Cable to climb to fresh multi-day highs in levels just shy of 1.2200 the figure.
Following the uneven recovery in the global bond market, the 10-year gilt dropped to multi-session lows near 4.40%.
Across the Channel, BRC Retail Sales Monitor expanded 2.8% YoY in September.
The October high at 1.2291 (October 10) is the next uptrend for GBP/USD, followed by the 200-day SMA at 1.2439. The small weekly high at 1.2548 (September 11) appears to be strengthened by the interim 55-day SMA (1.2535) and aligns ahead of the provisional 100-day at 1.2603. Crossing the latter opens the door to weekly highs of 1.2746 (August 30), 1.2818 (August 10) and 1.2995 (July 27), all of which are ahead of the key 1.3000 barrier. If Cable goes below the October low of 1.2037 (October 3), it may fall to the key round milestone of 1.2000 before plunging to the 2023 low of 1.1802. (March 8). The daily RSI rose past the 45 mark.
Resistance levels: 1.2291 1.2390 1.2421 (4H chart)
Support levels: 1.2162 1.2105 1.2037 (4H chart)
AUDUSD
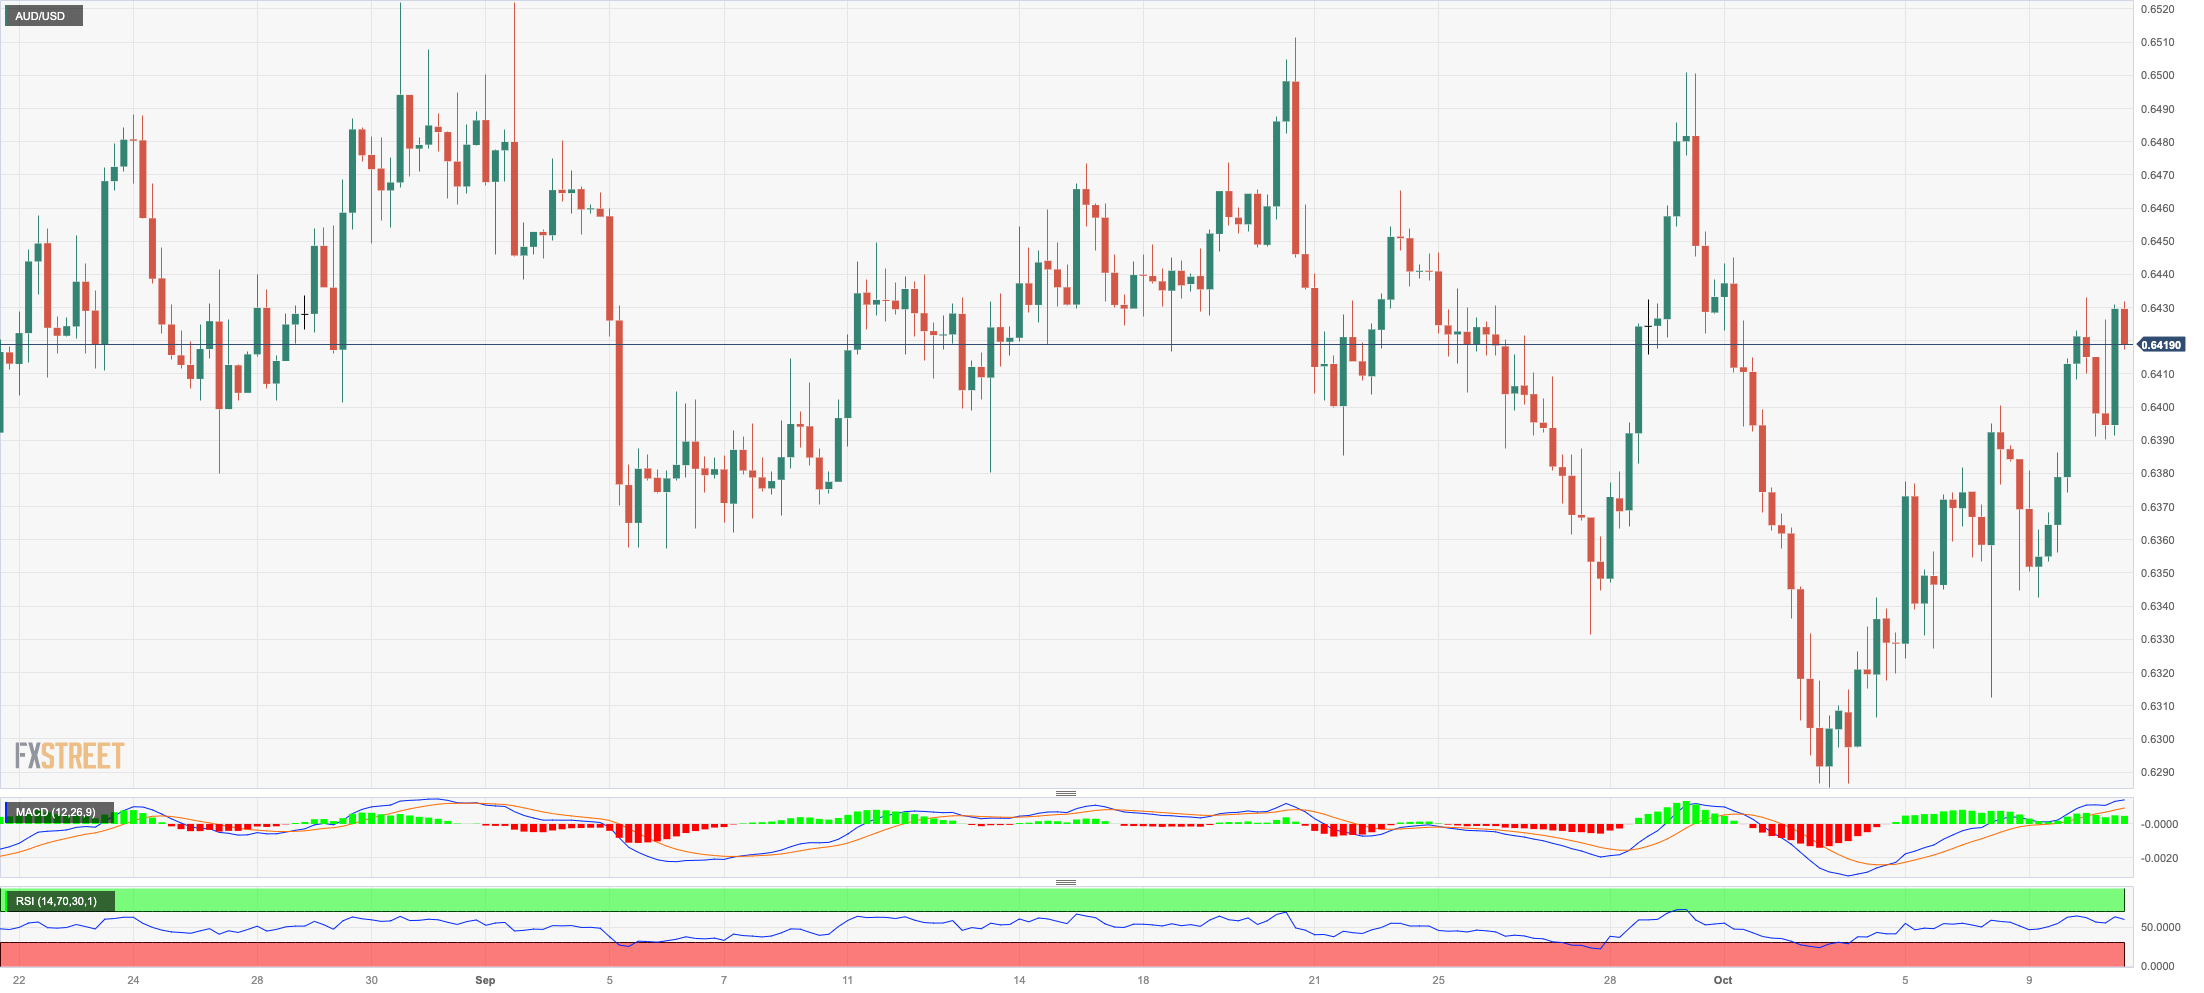
AUD/USD added to the ongoing rebound and reclaimed the area above the key 0.6400 hurdle on Tuesday.
The bullish performance of the Aussie dollar came in response to further selling bias in the greenback and auspicious news citing that China could announce further stimulus measures to support the country’s growth target.
However, the generalized poor session in the commodity space seems to have limited the daily gains in spot somehow.
In Oz, Consumer Confidence tracked by Westpac improved to 82 in October.
The most immediate danger to the AUD/USD is the 2023 low of 0.6285 (October 3), seconded by the November 2022 low of 0.6272 (November 7) and the 2022 low of 0.6179 (October 13). Having said that, the next barrier on the upside is at the weekly high of 0.6522 (August 30), ahead of another weekly top of 0.6616 (August 10) and the 200-day SMA of 0.6674. A further gain might take the pair to its July top of 0.6894 (July 14), which is followed by the June peak of 0.6899 (June 16) and comes just ahead of the crucial 0.7000 mark. The weekly high at 0.7029 (February 14) is shown by the breakout from this sector before the 2023 peak at 0.7157 (February 2). The day-to-day RSI surpassed the 50 threshold.
Resistance levels: 0.6433 0.6501 0.6511 (4H chart)
Support levels: 0.6312 0.6285 0.6272 (4H chart)
GOLD
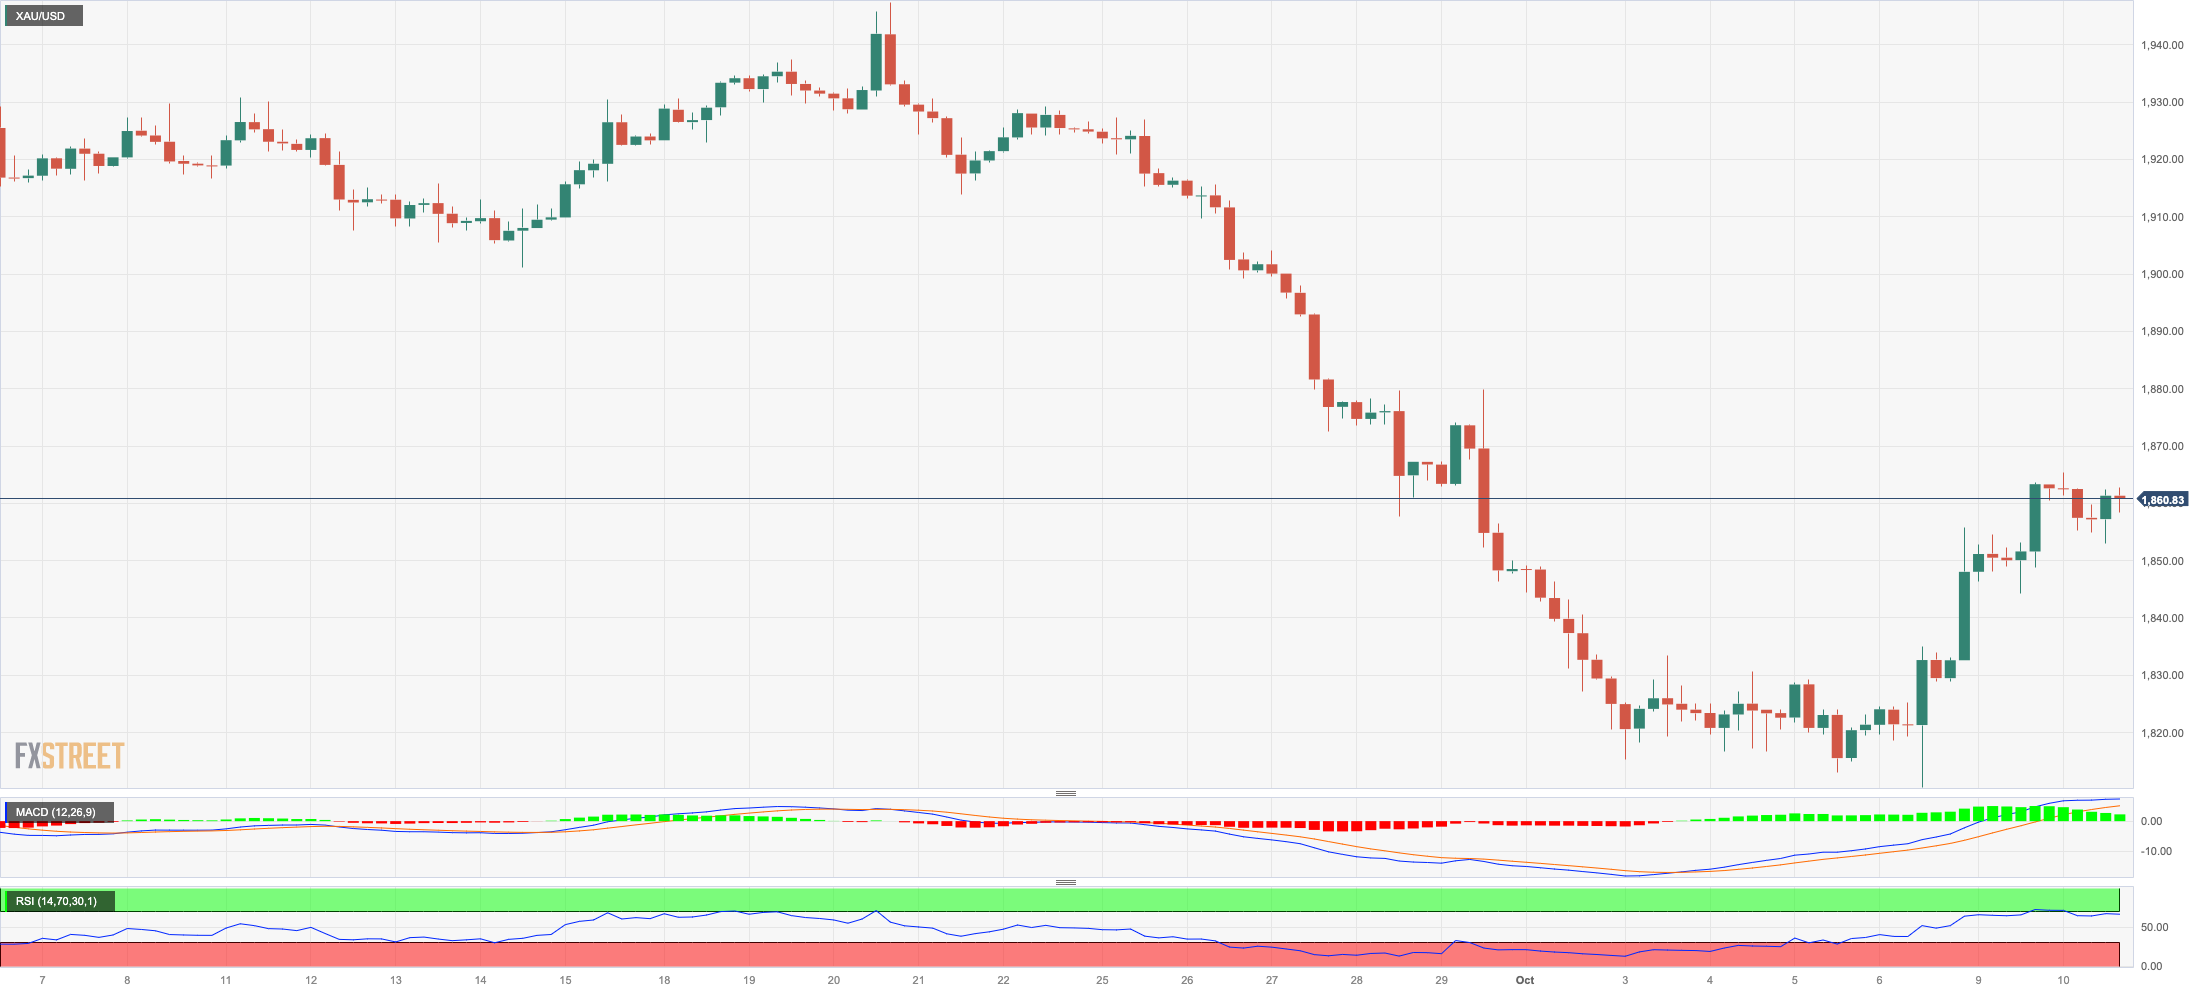
Prices of the troy ounce of the precious metal corrected lower and revisited the $1850 region after a two-day strong advance on Tuesday.
In fact, the yellow metal gave away part of the recent gains despite the marked retracement in the greenback, although the mixed tone in US yields and somewhat easing risk aversion appear to have bolstered the daily decline.
Aside from geopolitics, bullion is projected to stay under scrutiny in the coming months due to the imminent release of US inflation numbers (October 12) and the potential implications for the Fed's continuous tightening conditions.
Additional gains in gold should now retarget initial resistance at the key 200-day SMA at $1928 before reaching the weekly high at $1947 (September 20) and the September top at $1953 (September 1). If the precious metal breaks above the latter, it could target the July peak of $1987 (July 20), which is just below the crucial $2000 threshold. From here, the 2023 high of $2067 (May 4) emerges, seconded by the 2022 top of $2070 (March 8) and the all-time peak of $2075 (August 7, 2020). Exactly the opposite, a breach of the October low of $1810 (October 6) exposes the 2023 bottom of $1804 (February 28), which is just ahead of the important reversal zone at $1800.
Resistance levels: $1865 $1879 $1904 (4H chart)
Support levels: $1810 $1804 $1784 (4H chart)
CRUDE WTI
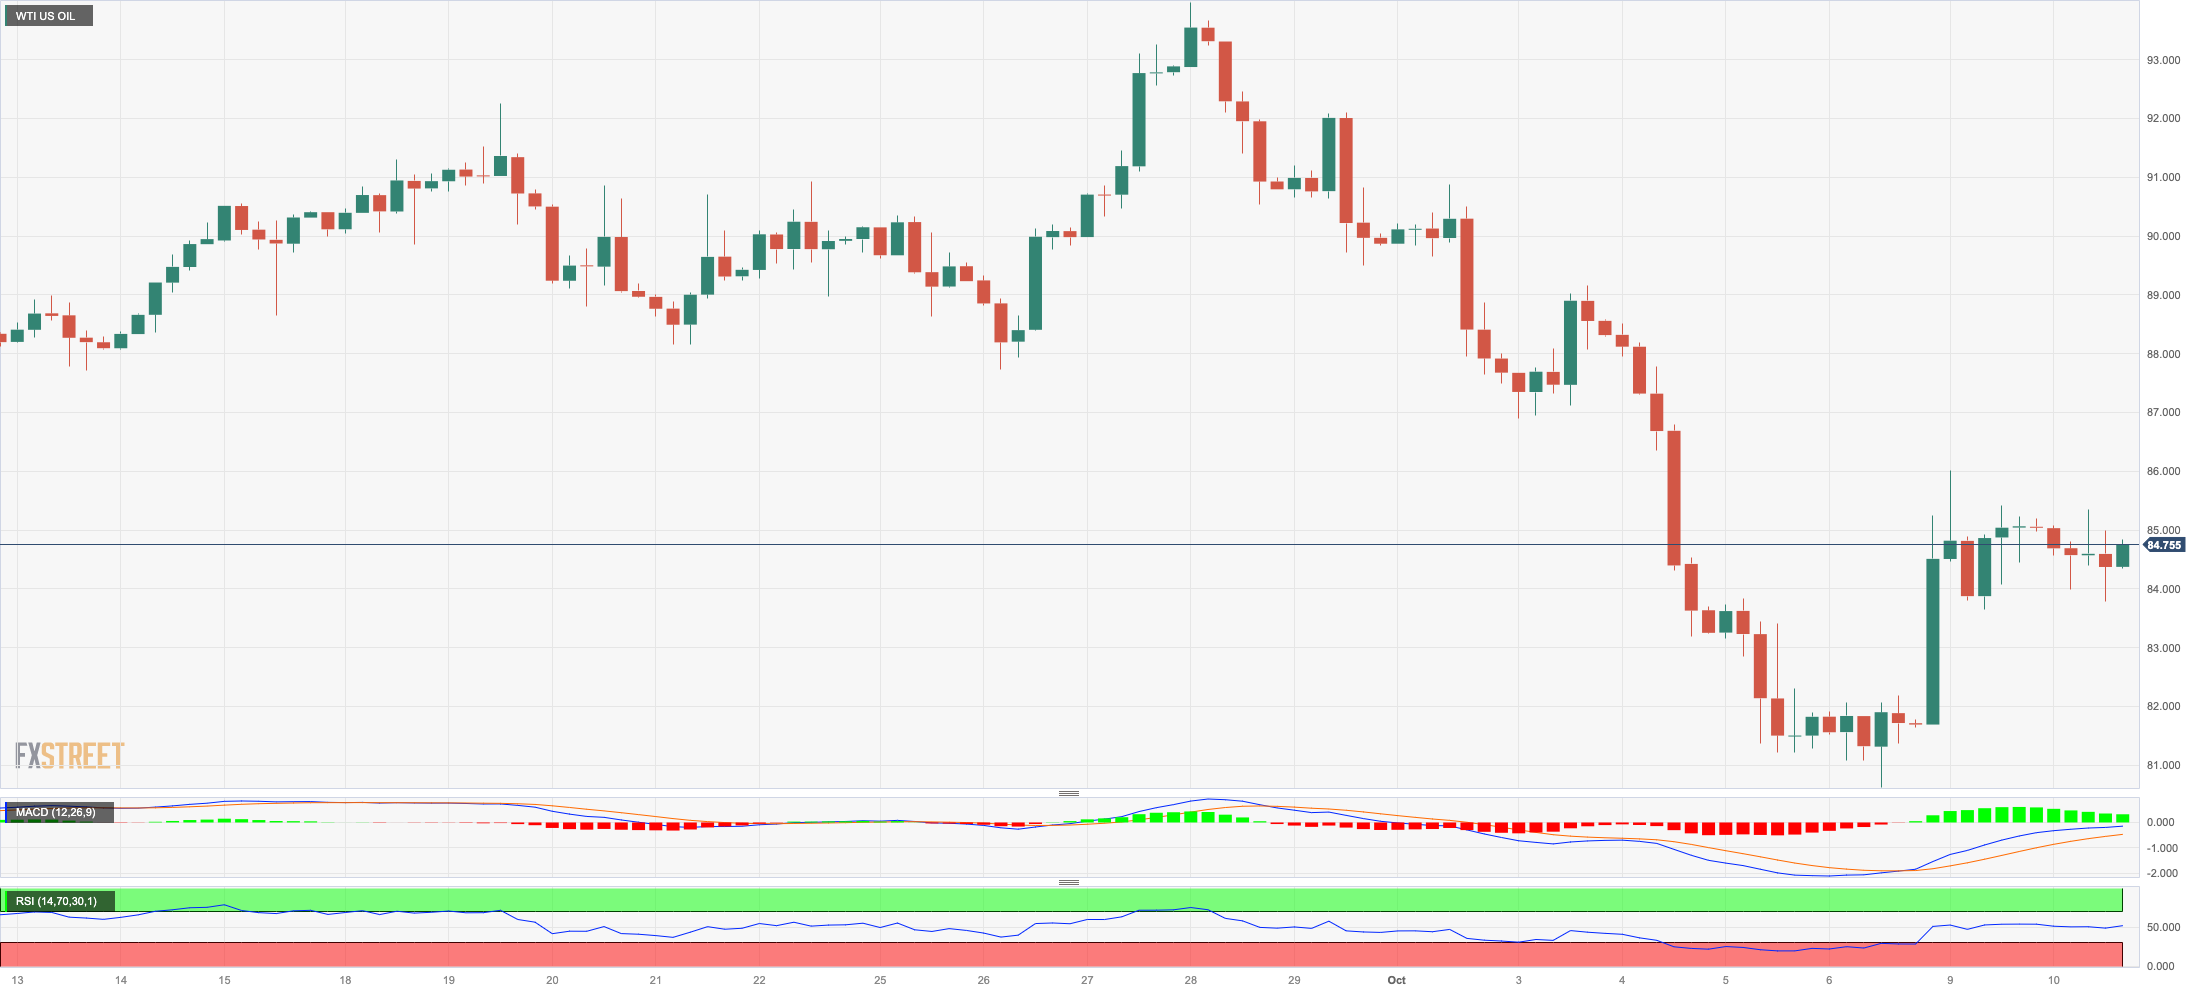
Prices of WTI traded with modest losses around the $86.00 mark per barrel on Tuesday, giving away part of the strong advance recorded at the beginning of the week.
In fact, demand concerns seem to have weighed on traders’ sentiment after the IMF downgraded its global growth projections for the next year on Tuesday, although intensifying effervescence in the Middle East is expected to somehow put a floor to occasional weakness in the commodity.
Contributing to the above scenario was the ongoing narrative of constrained supply, which was reinforced by the voluntary oil production cuts enacted by Saudi Arabia and the decrease in crude oil exports from Russia.
The resumption of selling pressure could prompt WTI prices to retest the October low of $81.56 (October 6) ahead of the important $80.00 level and prior to the August low of $77.64 (24 August), which appears to be supported by the 200-day SMA at $77.56. If the latter is breached, WTI could fall to the weekly low of $73.89 (July 17) before reaching the June low of $66.85 (June 12) and the 2023 low of $63.61 (May 4), all preceding the important $60.00 mark per barrel. On the upside, a breakout above the 2023 high of $94.99 (September 28) could put a test of the weekly top of $97.65 (August 30, 2022) back on the radar ahead of the psychological $100.00 threshold per barrel.
Resistance levels: $87.20 $90.23 $93.06 (4H chart)
Support levels: $81.47 $79.31 $77.56 (4H chart)
GER40
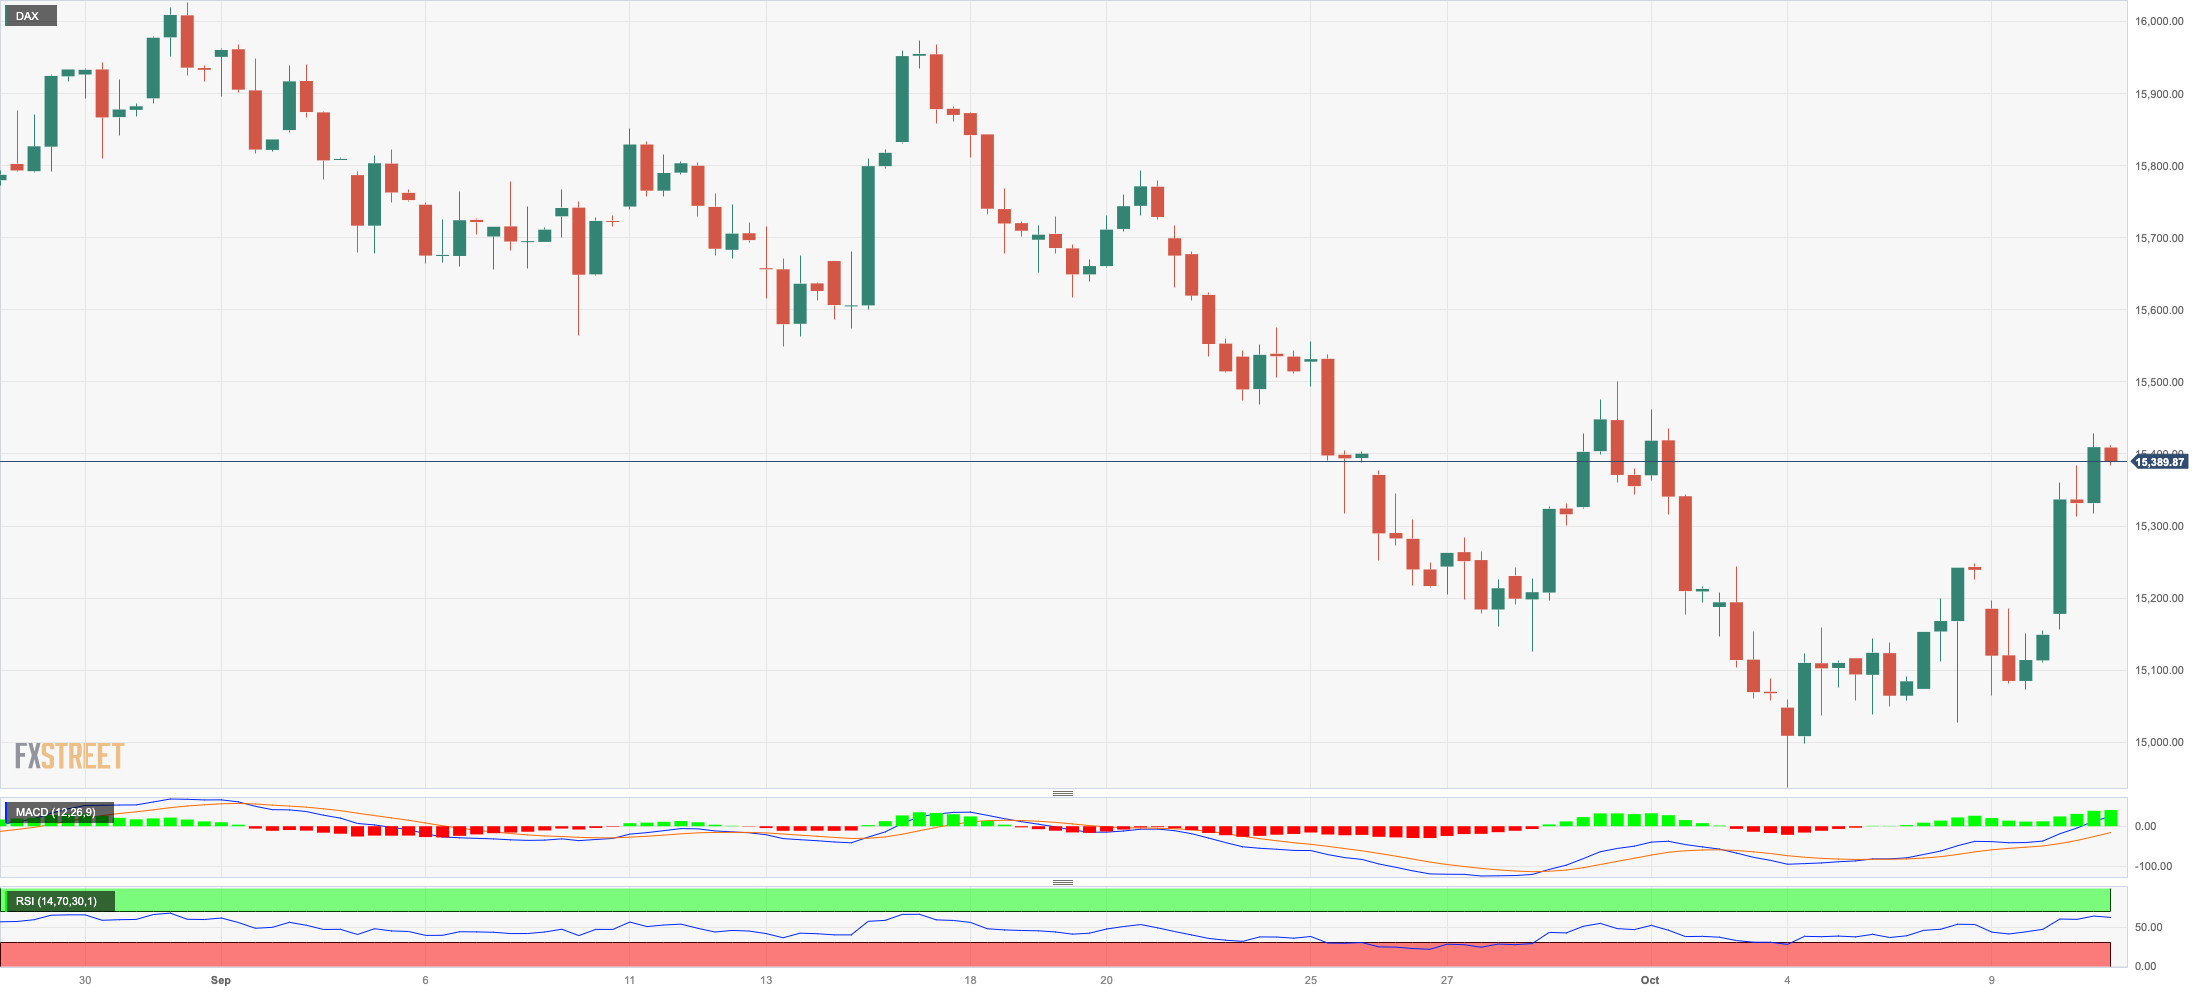
Germany’s benchmark DAX40 extended the rebound to new multi-day highs and approached the 15500 region on Tuesday.
Additional advances in German stocks followed the overall positive sentiment in European markets, driven by reports suggesting that China may be considering additional stimulus measures.
In addition, firmer speculation of a pause by the ECB until H2 2024 and dovish messages from Fed speakers also added to the upbeat mood among investors.
Immediately to the upside for the DAX40 emerges the 200-day SMA at 15620 prior to the September high of 15989 (September 14), followed by the weekly tops of 16042 (August 31) and 16060 (August 10). A breakout above this level could lead to a retest of the all-time peak of 16528 (July 31). On the contrary, if sellers take control again, the index could retarget the October low of 14948 (October 4) before targeting the March low of 14458 (March 20) and the December 2022 low of 13791 (December 20), all preceding the 2022 low of 11862 (September 28). The RSI on the daily chart improved north of 49.
Best Performers: Zalando SE, Sartorius AG VZO, RWE AG ST
Worst Performers: : Daimler Truck Holding, Henkel VZO, Fresenius SE
Resistance levels: 15443 15515 15777 (4H chart)
Support levels: 14948 14809 14458 (4H chart)
NASDAQ
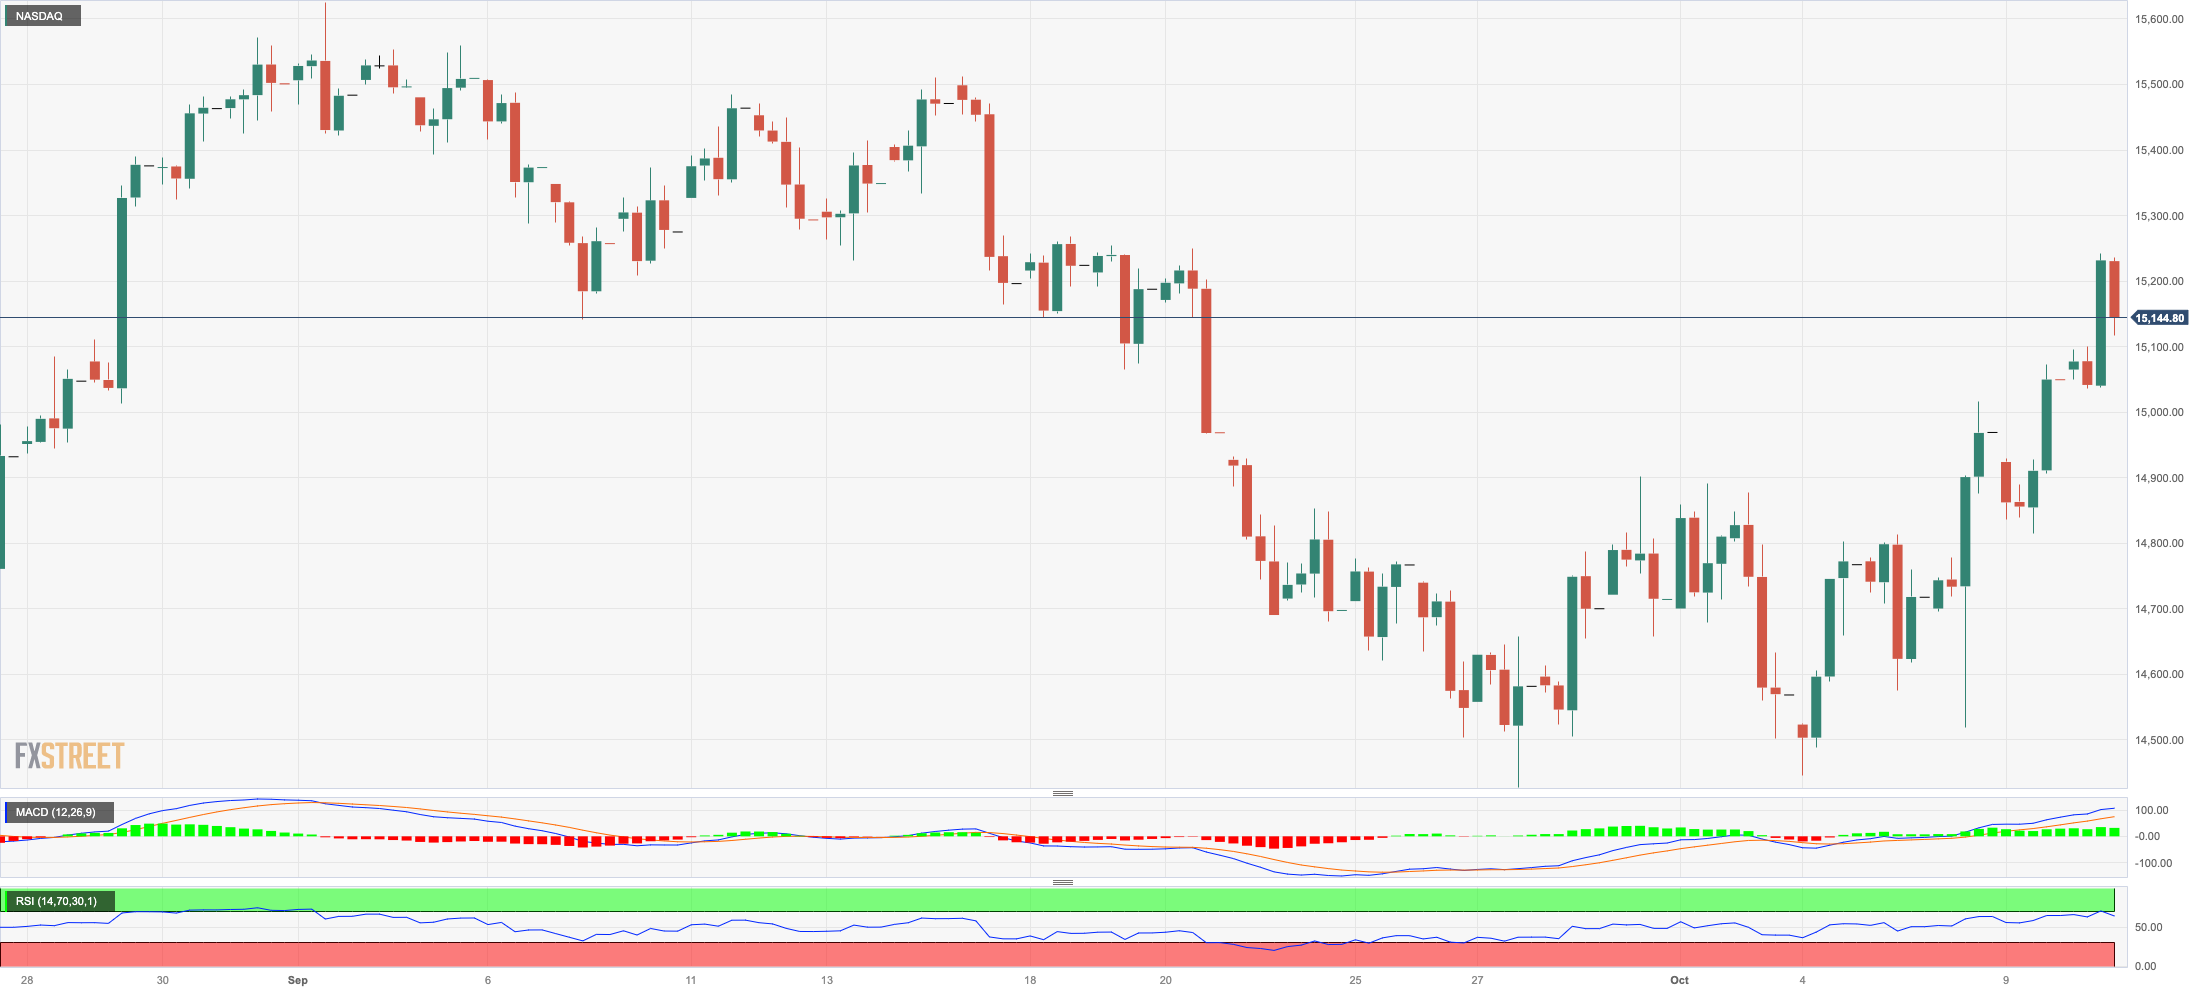
The tech reference Nasdaq 100 rose to fresh three-week tops around the 15200 zone amidst the broad-based optimism in the US stock markets.
Dovish comments from the Fed’s policymakers coupled with the mixed performance of US yields across the curve, the sell-off in the greenback, and potential extra stimulus from China all accompanied the positive developments in the US tech sector on Tuesday.
More gains might send the Nasdaq 100 above the October high of 15241 (October 10), ahead of the weekly top of 15512 (September 14). The latter's breakout might lead to the September peak of 15618 (September 1), which precedes the weekly high of 15803 (July 31), and the 2023 top of 15932 (July 19), which comes before the round mark of 16000. On the other hand, a drop below the September low of 14432 (September 27) may reintroduce the weekly low of 14283 (June 7) into play, ahead of the 200-day SMA at 13680 and the April low of 12724 ( (April 25). After clearing this zone, the index might target the March low of 11695 (March 13) before the 2023 low of 10696 (January 6). The daily RSI climbed past the 55 level.
Top Gainers: Lucid Group, Enphase, Dollar Tree
Top Losers: Netflix, Fastenal, PACCAR
Resistance levels: 15241 15512 15618 (4H chart)
Support levels: 14432 14283 13520 (4H chart)
DOW JONES
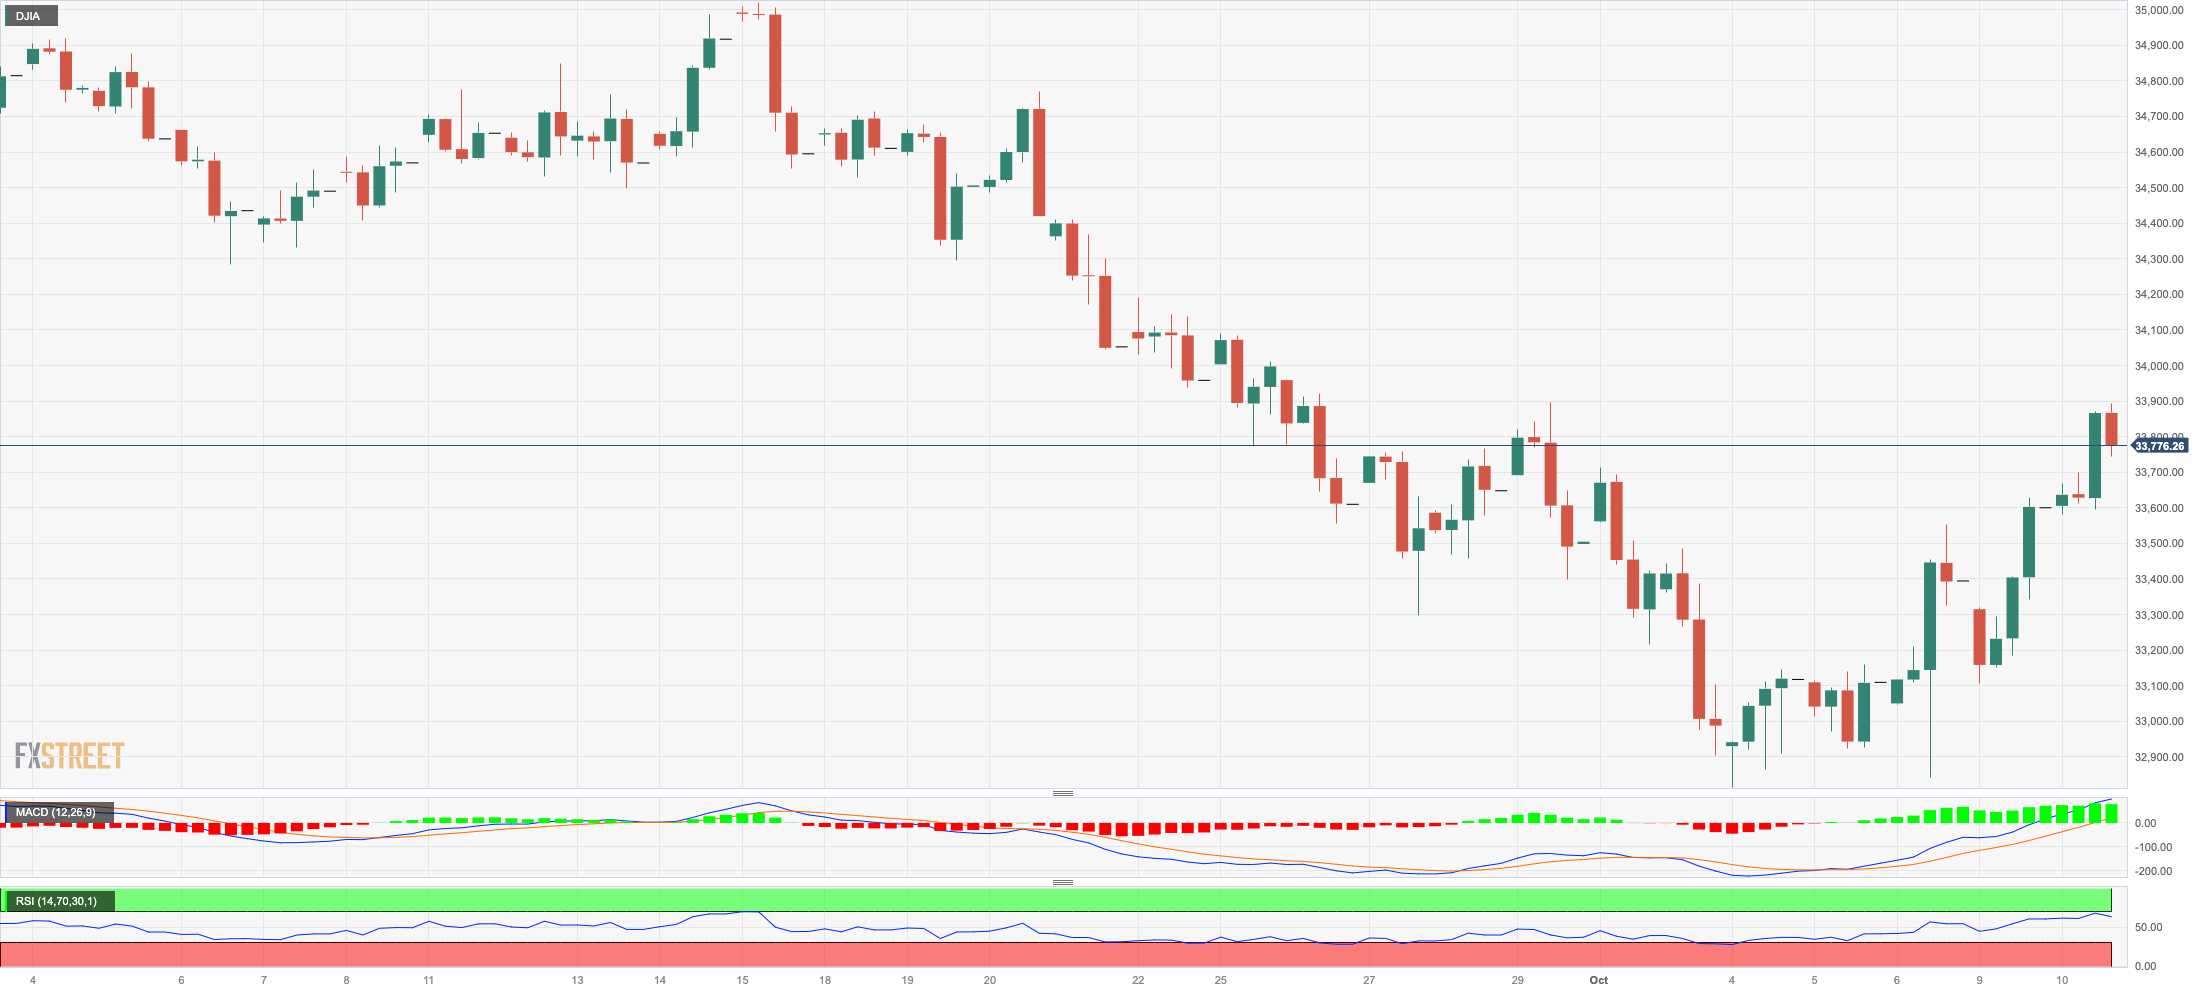
US equities tracked by the Dow Jones rose for the third consecutive session on Tuesday, trading at shouting distance from the key 34000 hurdle.
News that China could be planning further stimulus measures in combination with dovish comments from the Fed’s rate setters boosted investors’ sentiment and sponsored another positive session in the index.
Overall, the Dow Jones rose 0.60% to 33804, the S&P500 advanced 0.76% to 4368, and the tech-heavy Nasdaq Composite gained 0.79% to 13590.
The continuation of the upside momentum could prompt the Dow Jones to test the temporary 100-day and 55-day SMAs at 34275 and 34534, respectively, before reaching the September high of 34977 (September 14). The weekly top of 35070 (August 31) and the 2023 peak of 35679 are both north of here (August 1). If the latter is surpassed, the 2022 high of 35824 (February 9) may be attained before the all-time top of 36952 is reached (January 5, 2022). On the flip side, if the index goes below the October low of 32873 (October 4), it will most certainly reach the May low of 32586 (May 25) before falling to the 2023 low of 31429 (March 15). The RSI for the day leapt to the 47 area.
Top Performers: Boeing, Coca-Cola, 3M
Worst Performers: Travelers, Merck&Co, UnitedHealth
Resistance levels: 33898 34276 34977 (4H chart)
Support levels: 32846 32586 31805 (4H chart)
MACROECONOMIC EVENTS
All Information & Updates provided by:

All information relating to the financial markets available on this page has been prepared and issued by FXStreet (Forexstreet SL, Spain, Reg: B62498233) on the basis of publicly available information and all information believed to be reliable and does not conflict with Kuwaiti local laws, and all necessary care has been taken to before the company to ensure that the facts mentioned are correct from the source.
NCM Investment nor any of its directors or employees shall in any way be held responsible for the contents of this news, and the information contained on this page is intended only to provide clients with publicly available information and should not be construed as investment advice, report or analysis and/or constitute an offer or invitation to buy or sell financial instruments of any kind.
RISK WARNING: Forex and CFDs are highly risky leveraged products, as losses can exceed deposits. Please ensure you understand all the risks and take independent advice if necessary. NCM will segregate the clients based on the criteria of the regulator and its bylaws. NCM does not provide any advisory service; the material published does not constitute advice or a recommendation for a transaction in any financial instrument. NCM accepts no responsibility for any use of the content presented and any consequences of that use. Anyone acting on the information provided does so at their own risk.