
- Contact Us:
-

-

-

-


Daily Market Updates
12 Oct 2023
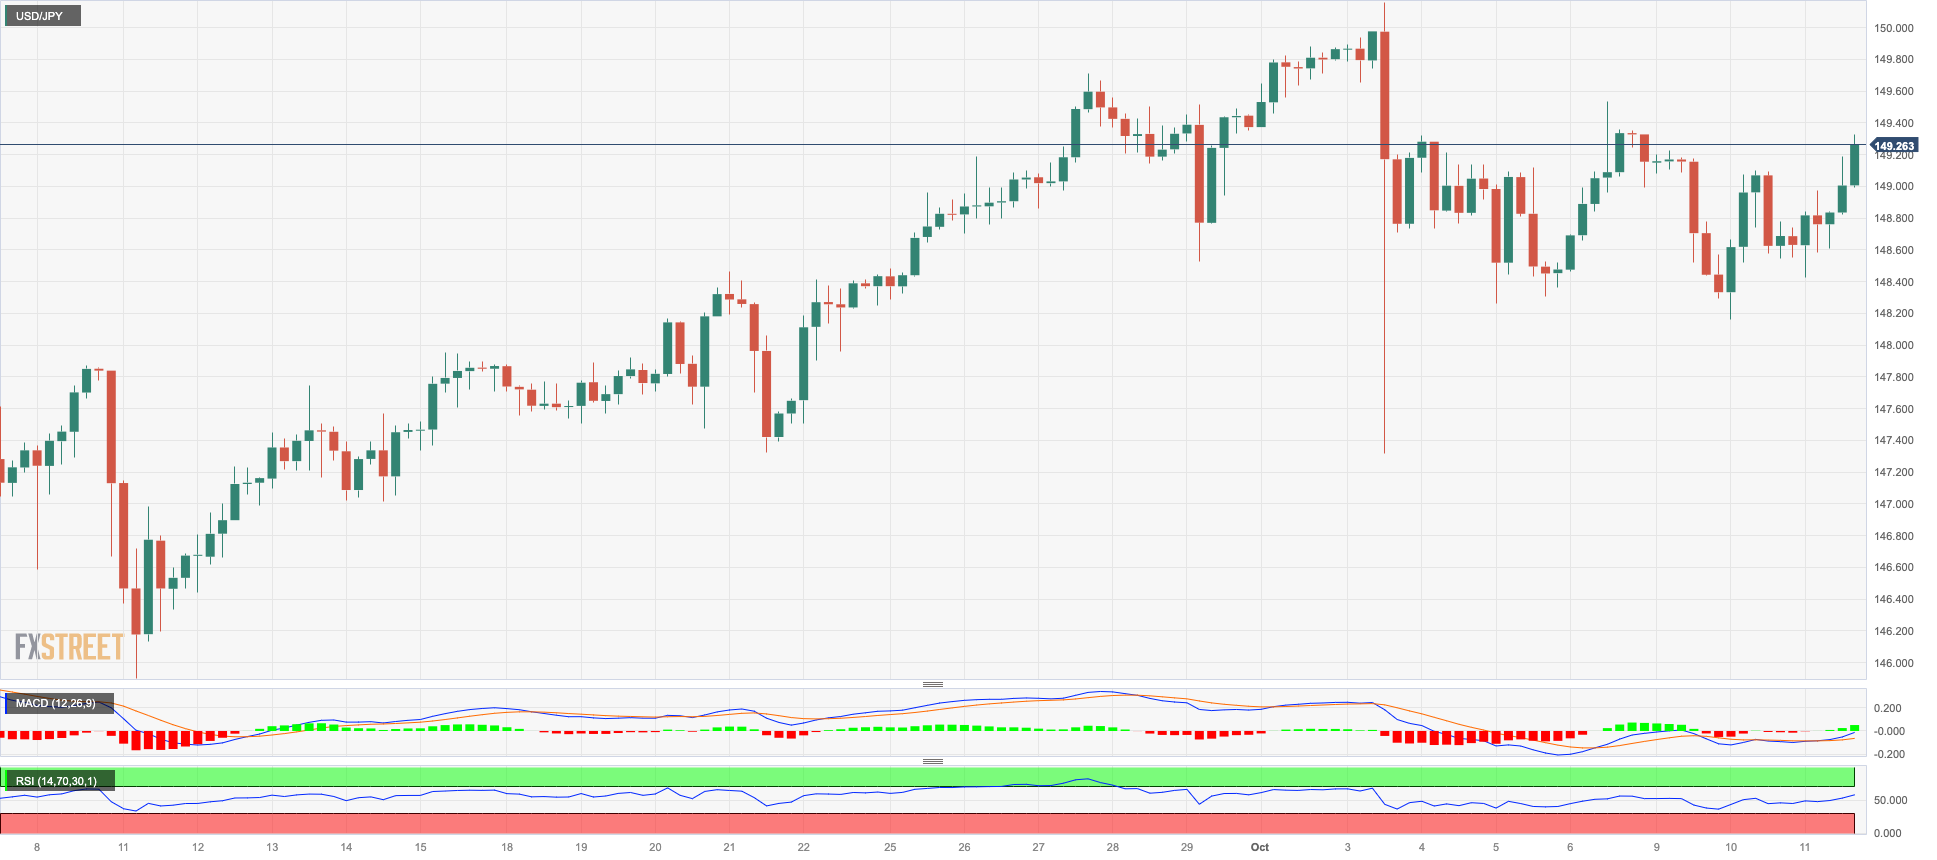
USDJPY
USD/JPY added to the previous daily uptick and advanced north of the 149.00 hurdle, printing decent gains for the day.
The second session in a row of gains in the pair came amidst the late rebound in the greenback and the continuation of the downtrend in US yields in the belly and the long end of the curve, while the short end extended the uptick for the second straight day.
In the Japanese bond market, the JGB 10-year yields eased further to the 0.75% region, fresh monthly lows.
In Japan, the Reuters Tankan Index remained unchanged at 4 in October, while Machine Tools Orders contracted 11.2% in the year to September.
If USD/JPY rises over the 2023 high of 150.16 (October 3), it may aim for the 2022 top of 151.94 (October 21). On the other hand, the 55-day SMA at 146.40 should provide temporary support before the weekly low of 145.89 (September 11). The loss of the latter opens up the possibility of a further slide to the September low of 144.43 (September 1), which is ahead of the temporary 100-day SMA at 144.02 and the August low of 141.50 (August 7). The 200-day SMA is at 138.60, just ahead of the July low of 137.23 (July 14). The daily RSI improved past the 58 level.
Resistance levels: 149.53 150.16 151.94 (4H chart)
Support levels: 148.16 147.27 145.89 (4H chart)
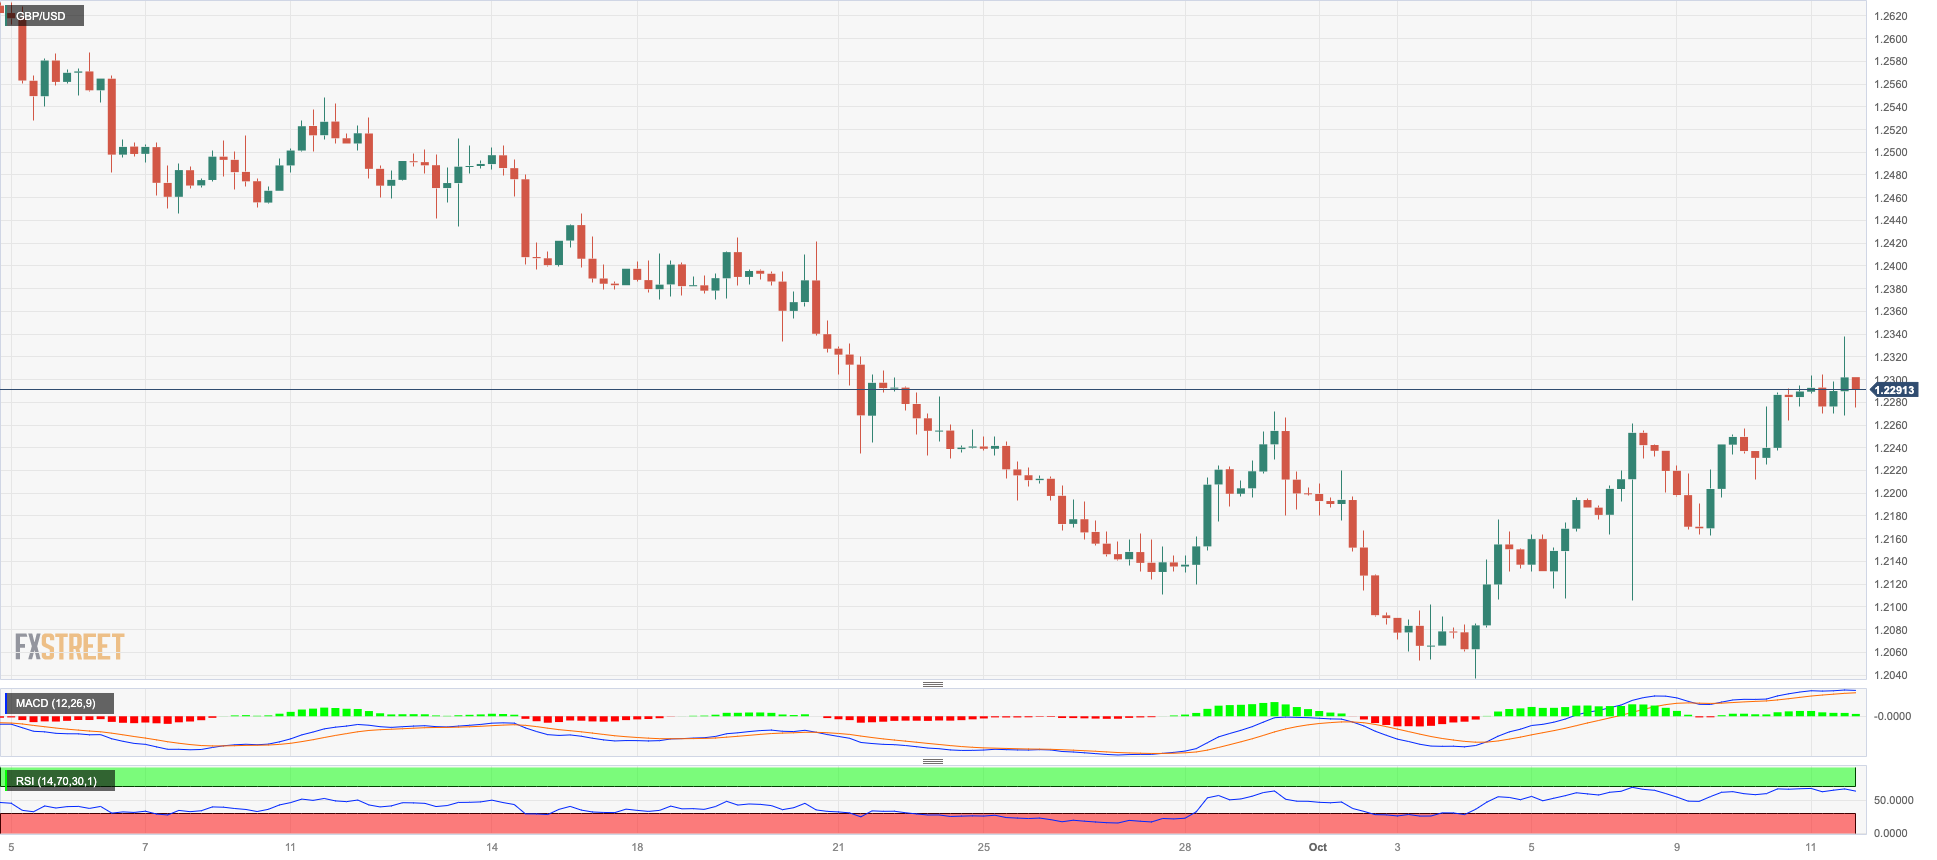
GBPUSD
The rally in GBP/USD remained everything but abated for yet another session on Wednesday, this time reclaiming the area beyond the key 1.2300 hurdle to clinch new three-week highs and turn positive when it comes to the monthly performance.
The modest advance in the greenback did not prevent the optimism to remain well in place around the British pound for the sixth session in a row, paving the way for a potential visit to the critical 200-day SMA in the 1.2440 region.
There were no data releases scheduled in the UK calendar on Wednesday.
The October high at 1.2315 (October 11) is the next up-barrier for GBP/USD, followed by the 200-day SMA at 1.2440. The minor weekly high at 1.2548 (September 11) seems to be strengthened by the interim 55-day SMA (1.2513) and aligns ahead of the provisional 100-day at 1.2601. Crossing the latter opens the door to weekly highs of 1.2746 (August 30), 1.2818 (August 10) and 1.2995 (July 27), all ahead of the key 1.3000 level. If Cable falls below the October low of 1.2037 (October 3), it might put a probable test of the key round milestone of 1.2000 back on the radar prior to the 2023 low of 1.1802 (March 8). The daily RSI climbed past the 47 level.
Resistance levels: 1.2337 1.2390 1.2421 (4H chart)
Support levels: 1.2162 1.2105 1.2037 (4H chart)
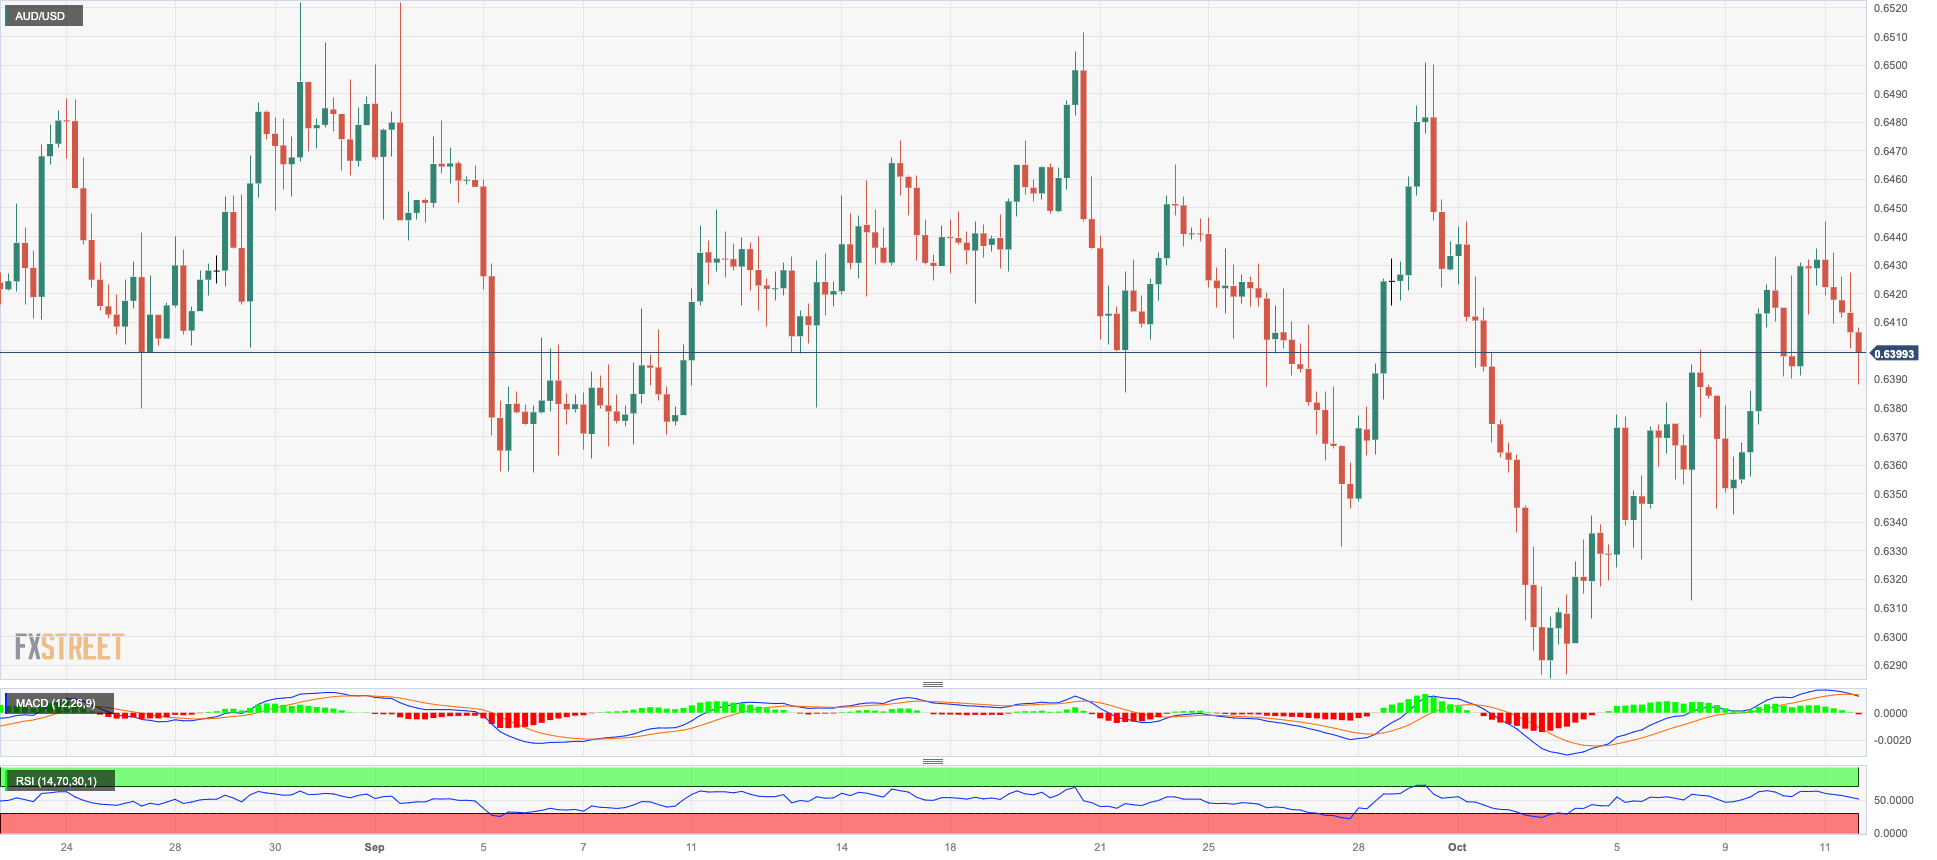
AUDUSD
AUD/USD could not sustain the early move to fresh tops around 0.6450, retreating to the 0.6420 region towards the end of Wednesday’s session.
The daily pullback in the Aussie dollar came on the back of a U-turn in the greenback in the latter part of the session, while the mixed tone in the commodity universe seems to have also added to the daily retracement in spot.
On the Australian calendar, RBA Assistant Governor Kent reiterated that the bank is navigating a phase that involves policymakers evaluating the effects of previous interest rate increases. Kent further mentioned that there may still be a need for additional rate hikes.
Immediately to the upside for AUD/USD emerges the weekly high of 0.6522 (August 30), ahead of another weekly top of 0.6616 (August 10) and the 200-day SMA of 0.6672. A further rise could take the pair to its July high of 0.6894 (July 14), followed by the June top of 0.6899 (June 16) and just ahead of the crucial 0.7000 mark. The weekly peak at 0.7029 (February 14) is shown by the breakout from this sector before the 2023 high at 0.7157 (February 2). Next on the downside aligns the 2023 low at 0.6285 (October 3), before the November 2022 low at 0.6272 (November 7) and the 2022 low at 0.6179 (October 13). The day-to-day RSI slipped back to the boundaries of 48.
Resistance levels: 0.6445 0.6501 0.6511 (4H chart)
Support levels: 0.6312 0.6285 0.6272 (4H chart)
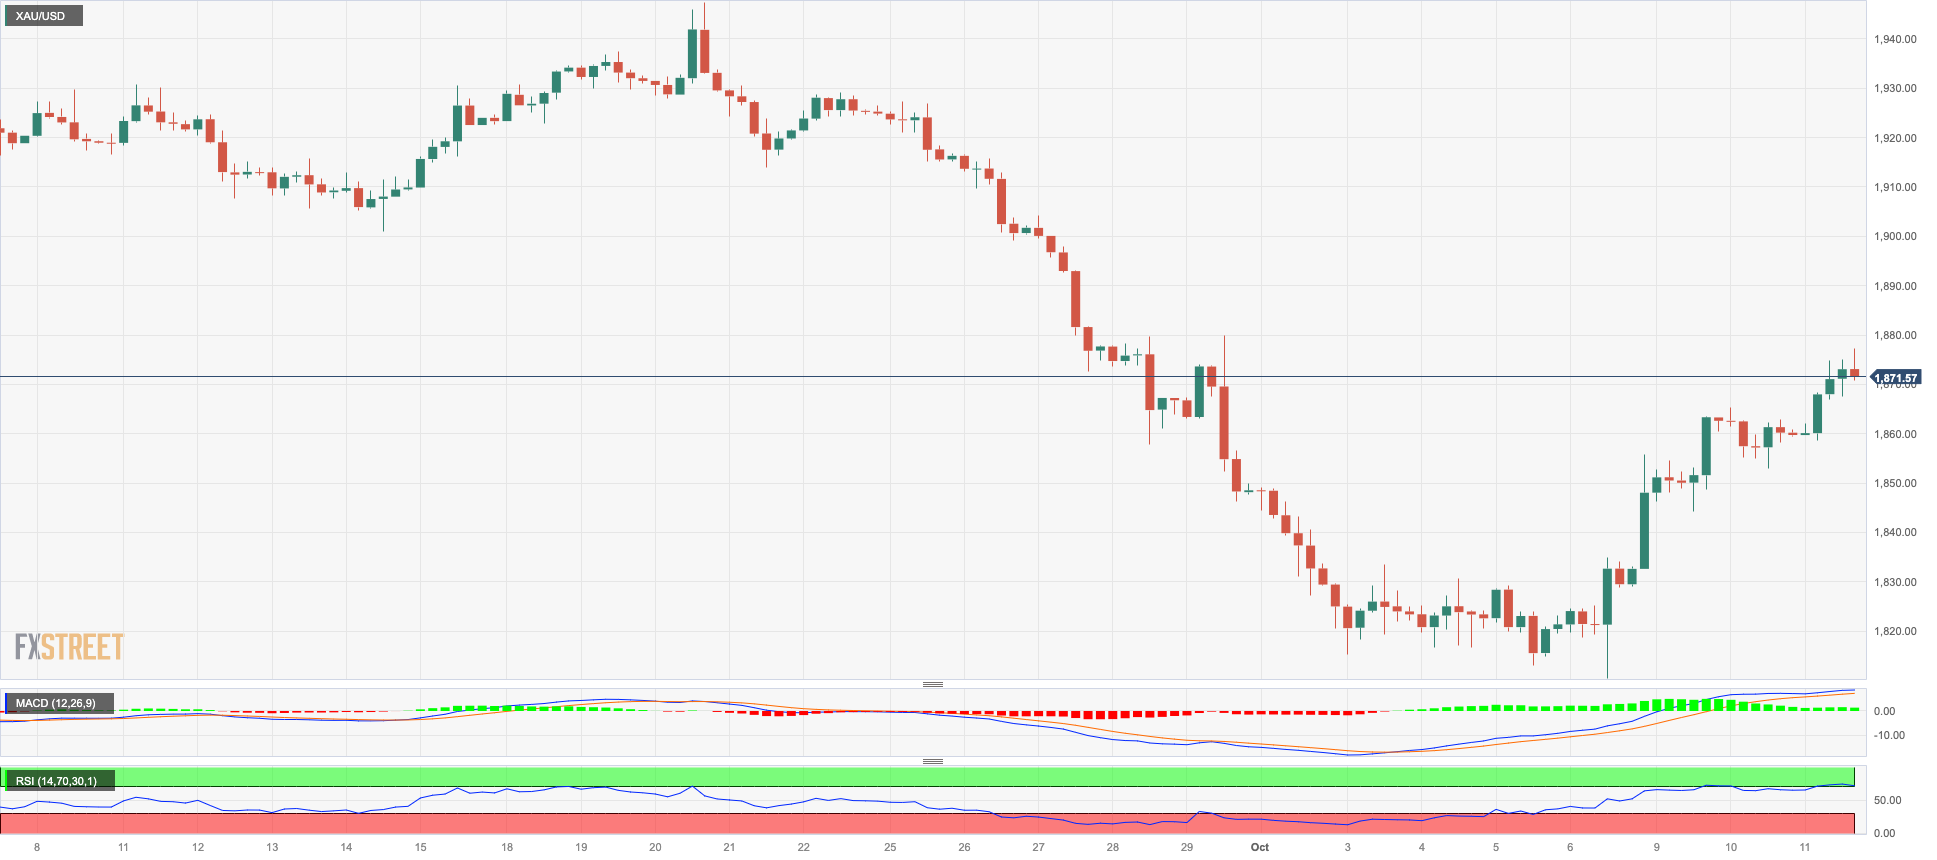
GOLD
Declining US yields in the 10-year/30-year segment underpinned the move in gold prices to fresh two-week highs near $1880 per troy ounce on Wednesday.
In addition, mounting concerns around the Israel-Hamas conflict and the likelihood that the situation could extend to neighbouring countries seem to have also bolstered the demand for the precious metal.
Additional gold advances should now retarget the major 200-day SMA at $1928 before hitting the weekly high at $1947 (September 20) and the September top at $1953 (September 1). If the precious metal breaks above the latter, it may aim for the July peak of $1987 (July 20), which is just below the critical $2000 level. The 2023 high of $2067 (May 4) emerges from here, seconded by the 2022 top of $2070 (March 8) and the all-time peak of $2075 (August 7, 2020). On the contrary, a break of the October low of $1810 (October 6) reveals the 2023 bottom of $1804 (February 28), which is just ahead of the critical reversal zone at $1800.
Resistance levels: $1877 $1900 $1929 (4H chart)
Support levels: $1844 $1810 $1804 (4H chart)
CRUDE WTI
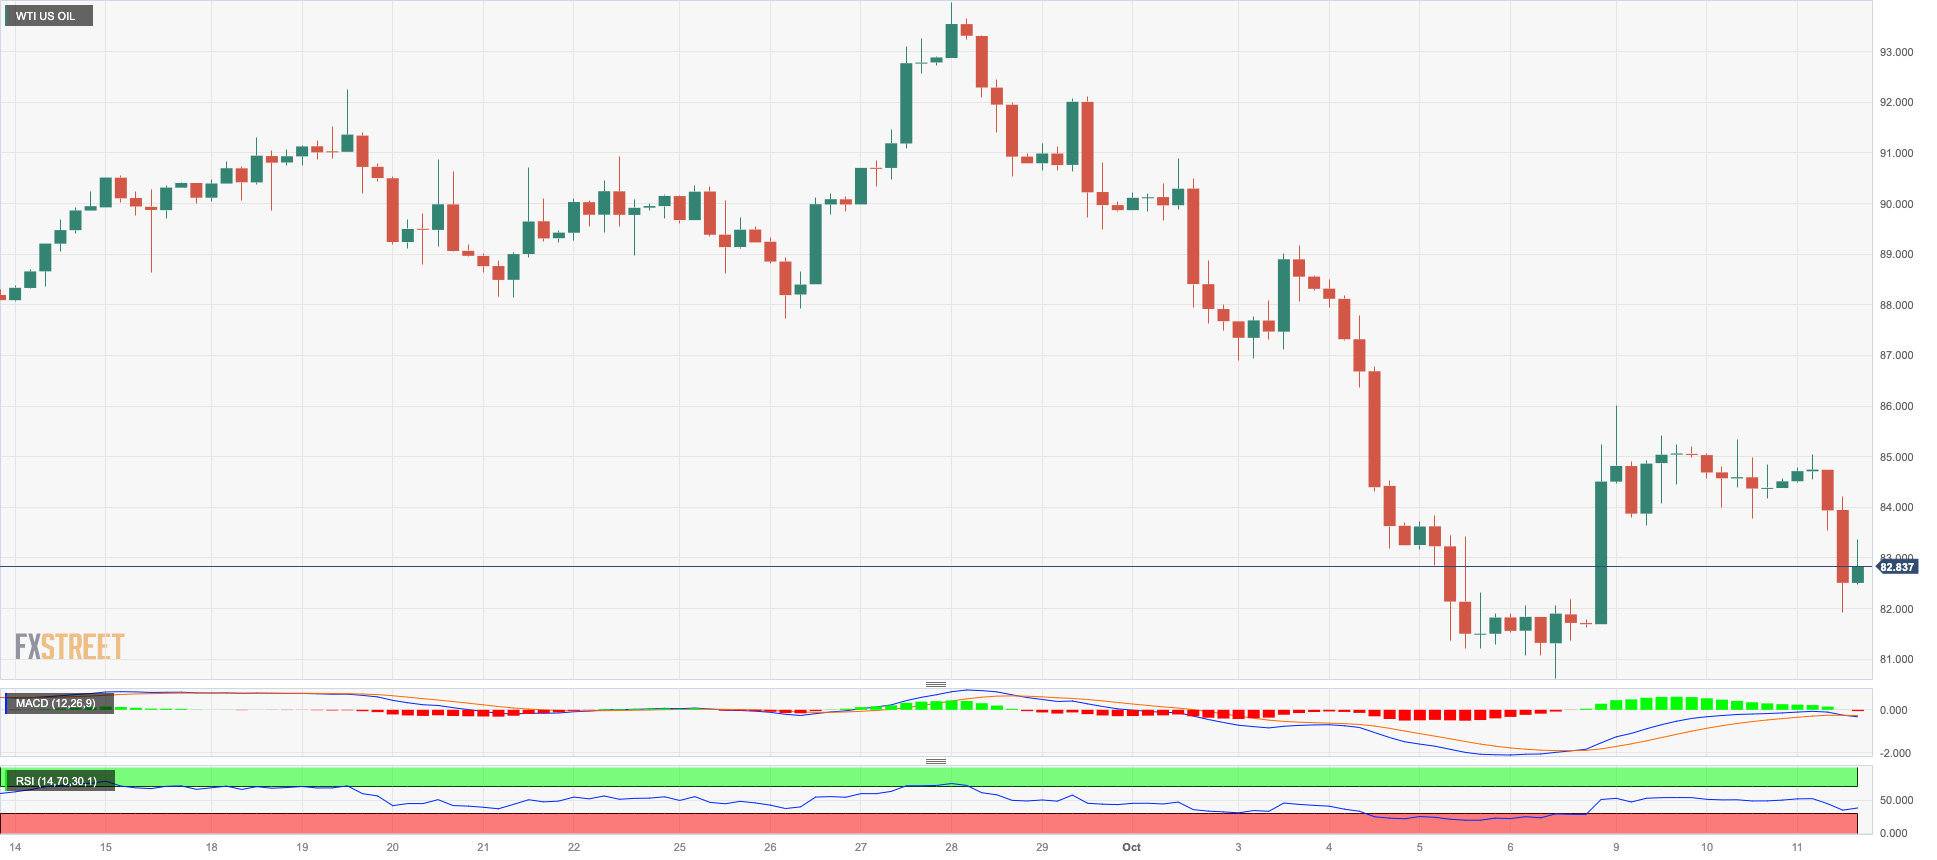
WTI prices dropped to three-day lows and briefly revisited the $83.00 region on Wednesday.
The negative price action around the commodity came in response to Saudi Arabia’s pledge to maintain the oil market stabilized, all against the backdrop of mounting geopolitical effervescence in the Middle East.
Also playing against the continuation of the upside momentum in WTI are the prospects of the continuation of the restrictive monetary policy stance from major central banks, which carries the potential to undermine economic growth and hence the demand for crude oil.
Later in the NA session, the API will report on US crude oil inventories in the week to October 6.
The continuation of selling pressure might cause WTI prices to retest the October low of $81.56 (October 6) before the critical $80.00 threshold and before the August low of $77.64 (August 24), which looks to be supported by the 200-day SMA at $77.58. If the latter is breached, WTI may fall to the weekly low of $73.89 (July 17), then to the June low of $66.85 (June 12) and the 2023 low of $63.61 (May 4), all before hitting the crucial $60.00 mark per barrel. On the upside, a break above the 2023 high of $94.99 (September 28) might reintroduce a challenge of the weekly top of $97.65 (August 30, 2022) ahead of the psychological $100.00 per barrel.
Resistance levels: $87.20 $90.23 $93.06 (4H chart)
Support levels: $83.17 $81.47 $79.31 (4H chart)
GER40
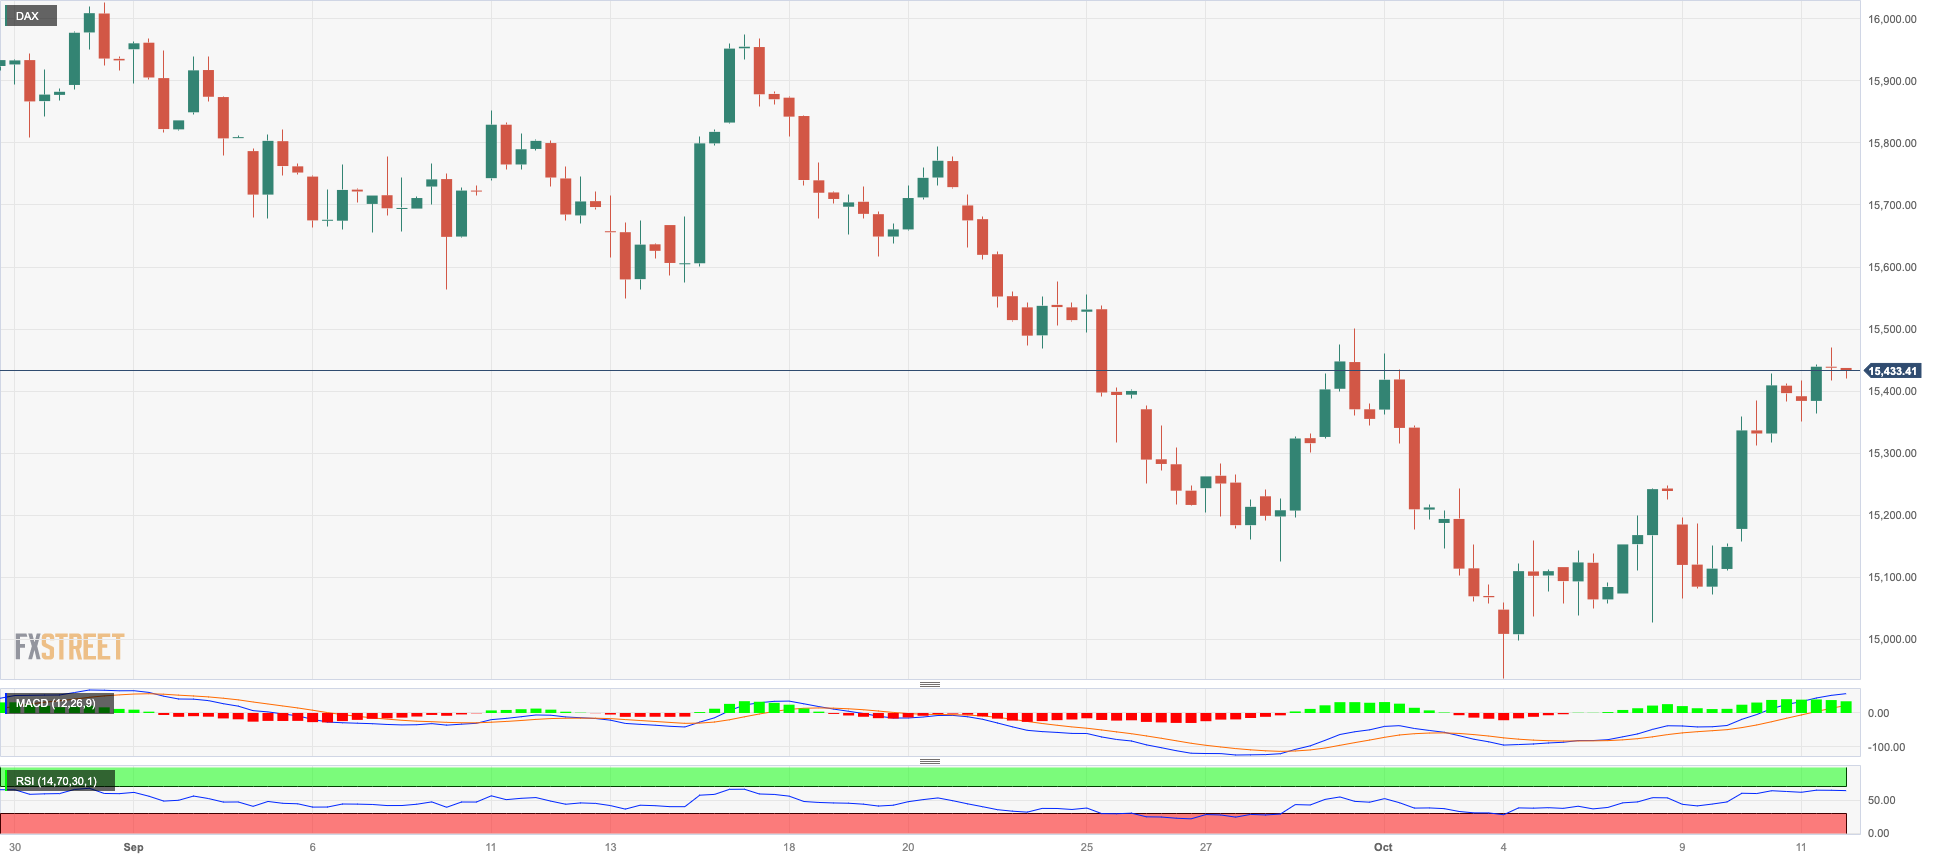
German stocks advanced for the second consecutive session on Wednesday, lifting the blue-chip DAX40 to new multi-day peaks around the 15500 zone.
The continuation of the upbeat mood among European investors remained propped up by expectations that the Federal Reserve might refrain from hiking rates for the remainder of the year, a decision that would likely be mirrored by the ECB.
In addition, news of a potential announcement of further stimulus by the Chinese government added to the sentiment, while cautiousness around the Middle East conflict could also be a source of risk aversion going forward.
The 200-day SMA at 15628 appears immediately to the upside for the DAX40 before to the September high of 15989 (September 14), followed by weekly tops of 16042 (August 31) and 16060 (August 10). A break above this level may result in a retest of the all-time peak of 16528 (July 31). If sellers regain control, the index may retarget the October low of 14948 (October 4) before moving on to the March low of 14458 (March 20) and the December 2022 low of 13791 (December 20), both of which precede the 2022 low of 11862 (September 28). The RSI on the daily chart climbed past the 50 threshold.
Best Performers: Rheinmetall AG, Vonovia, Siemens Energy AG
Worst Performers: Fresenius SE, Zalando SE, Deutsche Boerse
Resistance levels: 15486 15515 15773 (4H chart)
Support levels: 14948 14809 14458 (4H chart)
NASDAQ
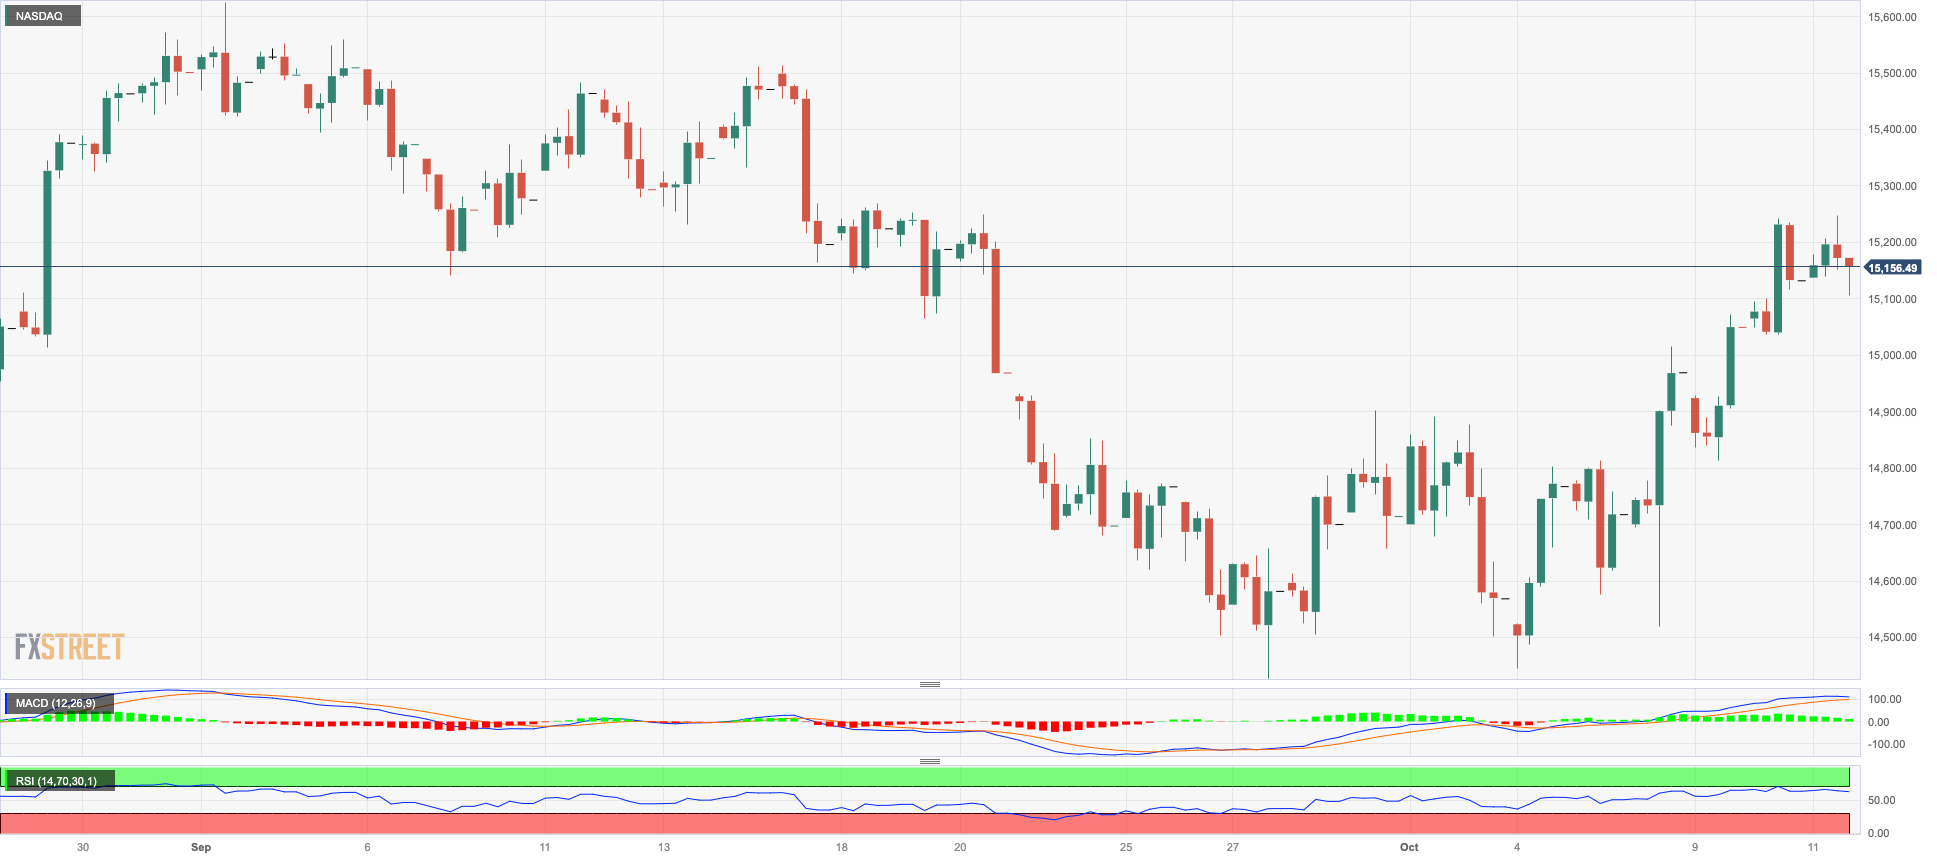
US tech equities tracked by the Nasdaq 100 rose for the fourth session in a row on Wednesday, revisiting the area of fourth-week peaks near the 15300 zone.
In fact, optimism in the US tech sector remained well in place on the back of further weakness in US yields, particularly in the belly and the long end of the curve.
That said, investors seem to have looked past hawkish comments from FOMC M. Bowman, who advocated for extra tightening, particularly following higher-than-expected US Producer Prices in September.
Further gains could encourage the Nasdaq 100 to test the weekly high of 15512 (September 14). The breakout from the latter could lead to the September top of 15618 (September 1), preceding the weekly peak of 15803 (July 31), and the 2023 high of 15932 (July 19), all ahead of the round 16000 mark. On the other hand, a drop below the September low of 14432 (September 27) could bring the weekly low of 14283 (June 7) back into play, ahead of the 200-day SMA at 13700 and the April low of 12724 (April 25). After clearing this zone, the index might target the March low of 11695 (March 13) before the 2023 low of 10696 (January 6). The daily RSI climbed north of the 56 zone.
Top Gainers: Amgen, Adobe, CrowdStrike Holdings
Top Losers: DexCom, Intuitive Surgical, Keurig Dr Pepper
Resistance levels: 15248 15512 15618 (4H chart)
Support levels: 14432 14283 13520 (4H chart)
DOW JONES
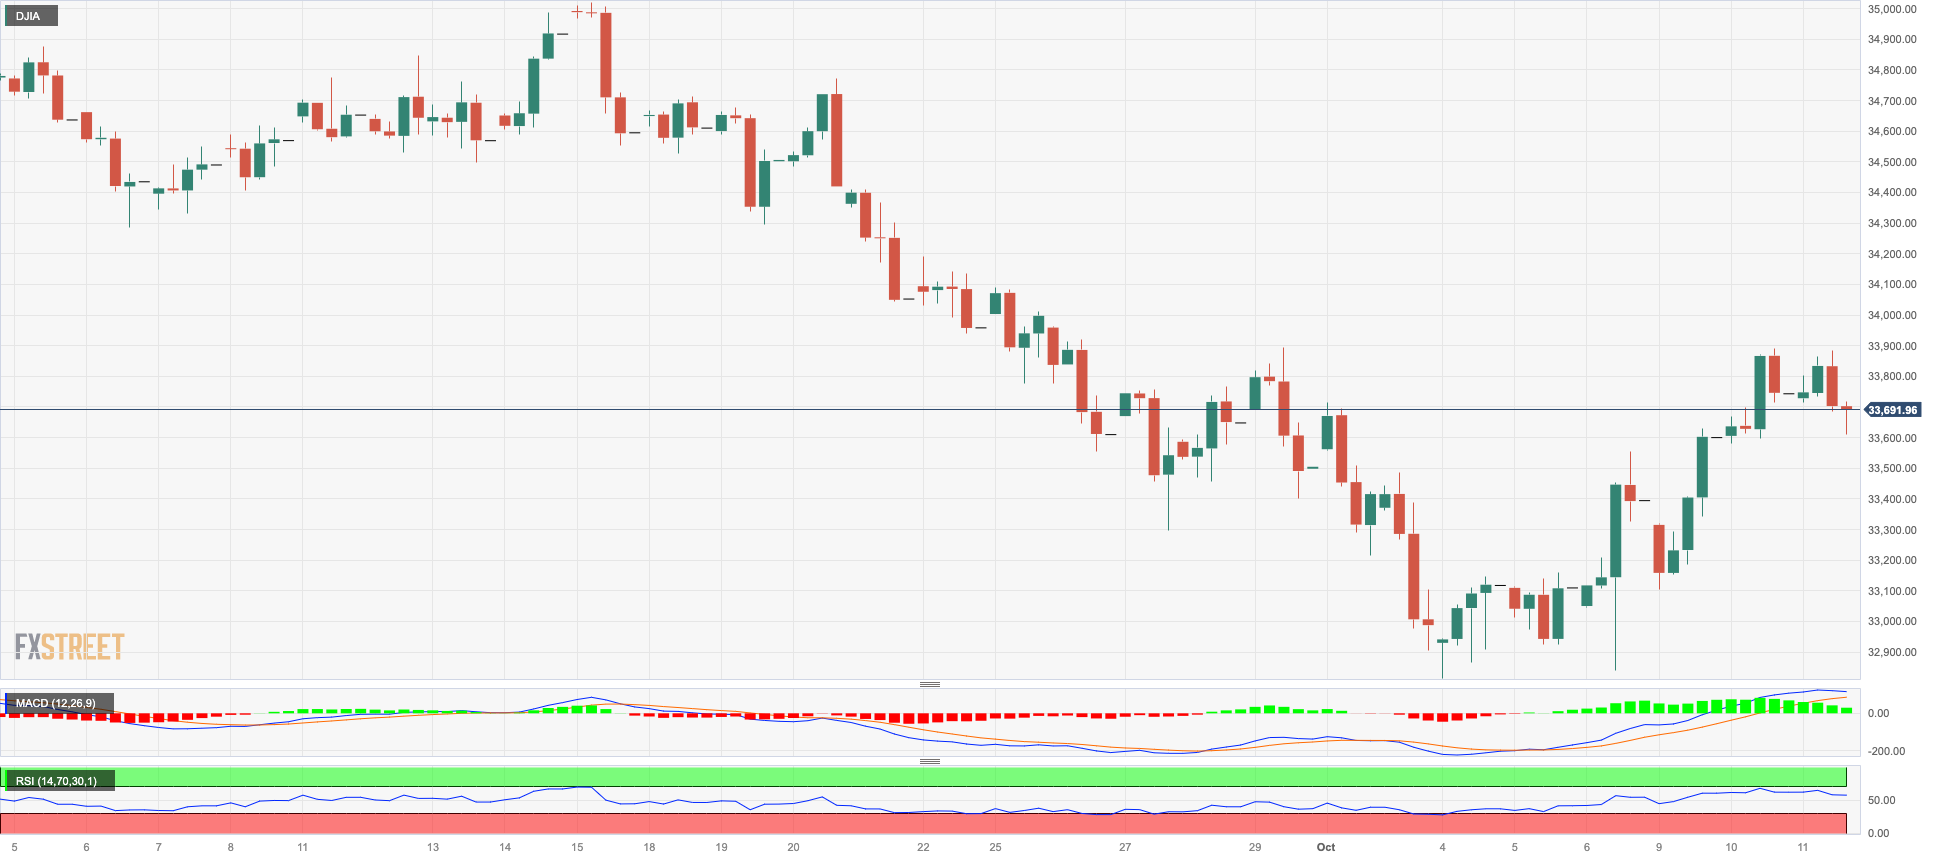
The three-day positive streak in the Dow Jones came to an end on Wednesday after the index met decent resistance around the key 200-day SMA in the 33800 zone.
Further tighter-for-longer narrative from Fed speakers and even comments favouring the continuation of the hiking cycle (M. Bowman) seem to have undermined the strong rebound seen in the index in past sessions.
All in all, the Dow Jones dropped 0.29% to 33640, the S&P500 deflated 0.26% to 4347, and the tech-reference Nasdaq Composite retreated 0.06% to 13554.
The continuation of upward momentum may cause the Dow Jones to test the temporary 100-day and 55-day SMAs at 34276 and 34500, respectively, before reaching the September high of 34977 (September 14). The weekly top of 35070 (August 31) and the 2023 peak of 35679 (August 1) are both north of here. If the latter is surpassed, the 2022 high of 35824 (February 9) could be reached before the all-time top of 36952 (January 5, 2022). On the other hand, if the index falls below the October low of 32873 (October 4), it will most certainly reach the May low of 32586 (May 25) before falling to the 2023 low of 31429 (March 15). The RSI for the day receded below 44.
Top Performers: Amgen, Nike, Boeing
Worst Performers: Chevron, Dow, Procter&Gamble
Resistance levels: 33898 34280 34977 (4H chart)
Support levels: 32846 32586 31805 (4H chart)
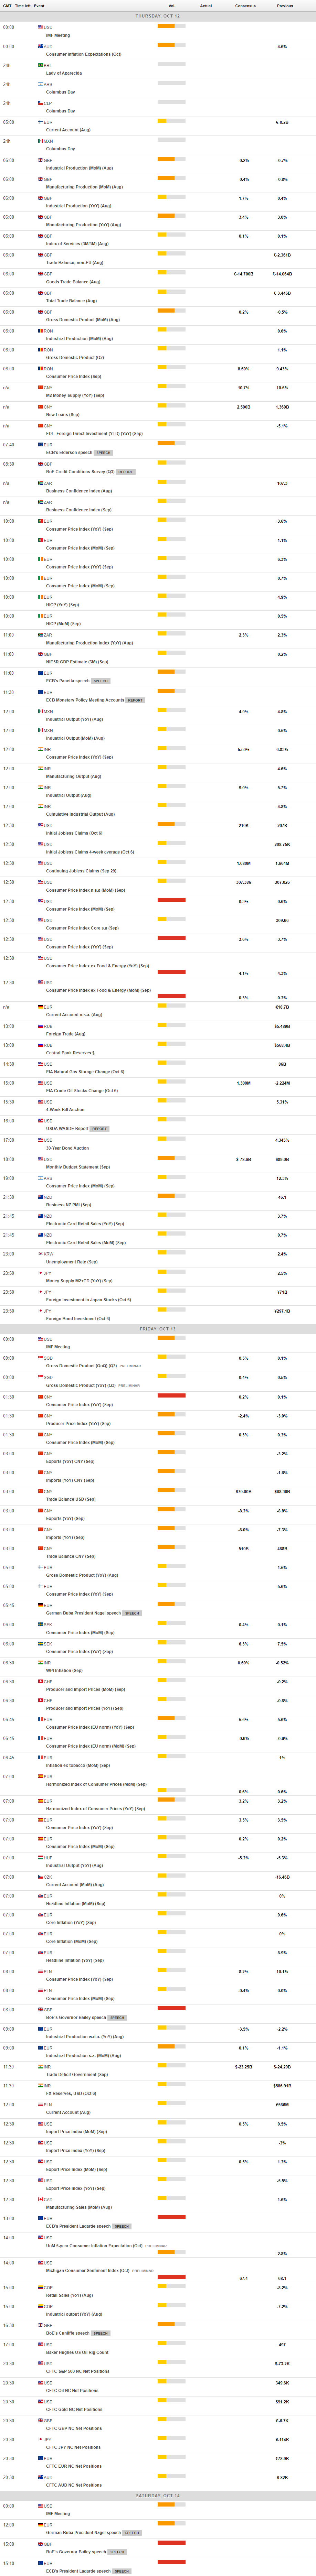
MACROECONOMIC EVENTS
All Information & Updates provided by:

All information relating to the financial markets available on this page has been prepared and issued by FXStreet (Forexstreet SL, Spain, Reg: B62498233) on the basis of publicly available information and all information believed to be reliable and does not conflict with Kuwaiti local laws, and all necessary care has been taken to before the company to ensure that the facts mentioned are correct from the source.
NCM Investment nor any of its directors or employees shall in any way be held responsible for the contents of this news, and the information contained on this page is intended only to provide clients with publicly available information and should not be construed as investment advice, report or analysis and/or constitute an offer or invitation to buy or sell financial instruments of any kind.
RISK WARNING: Forex and CFDs are highly risky leveraged products, as losses can exceed deposits. Please ensure you understand all the risks and take independent advice if necessary. NCM will segregate the clients based on the criteria of the regulator and its bylaws. NCM does not provide any advisory service; the material published does not constitute advice or a recommendation for a transaction in any financial instrument. NCM accepts no responsibility for any use of the content presented and any consequences of that use. Anyone acting on the information provided does so at their own risk.