
- Contact Us:
-

-

-

-


Daily Market Updates
13 Oct 2023
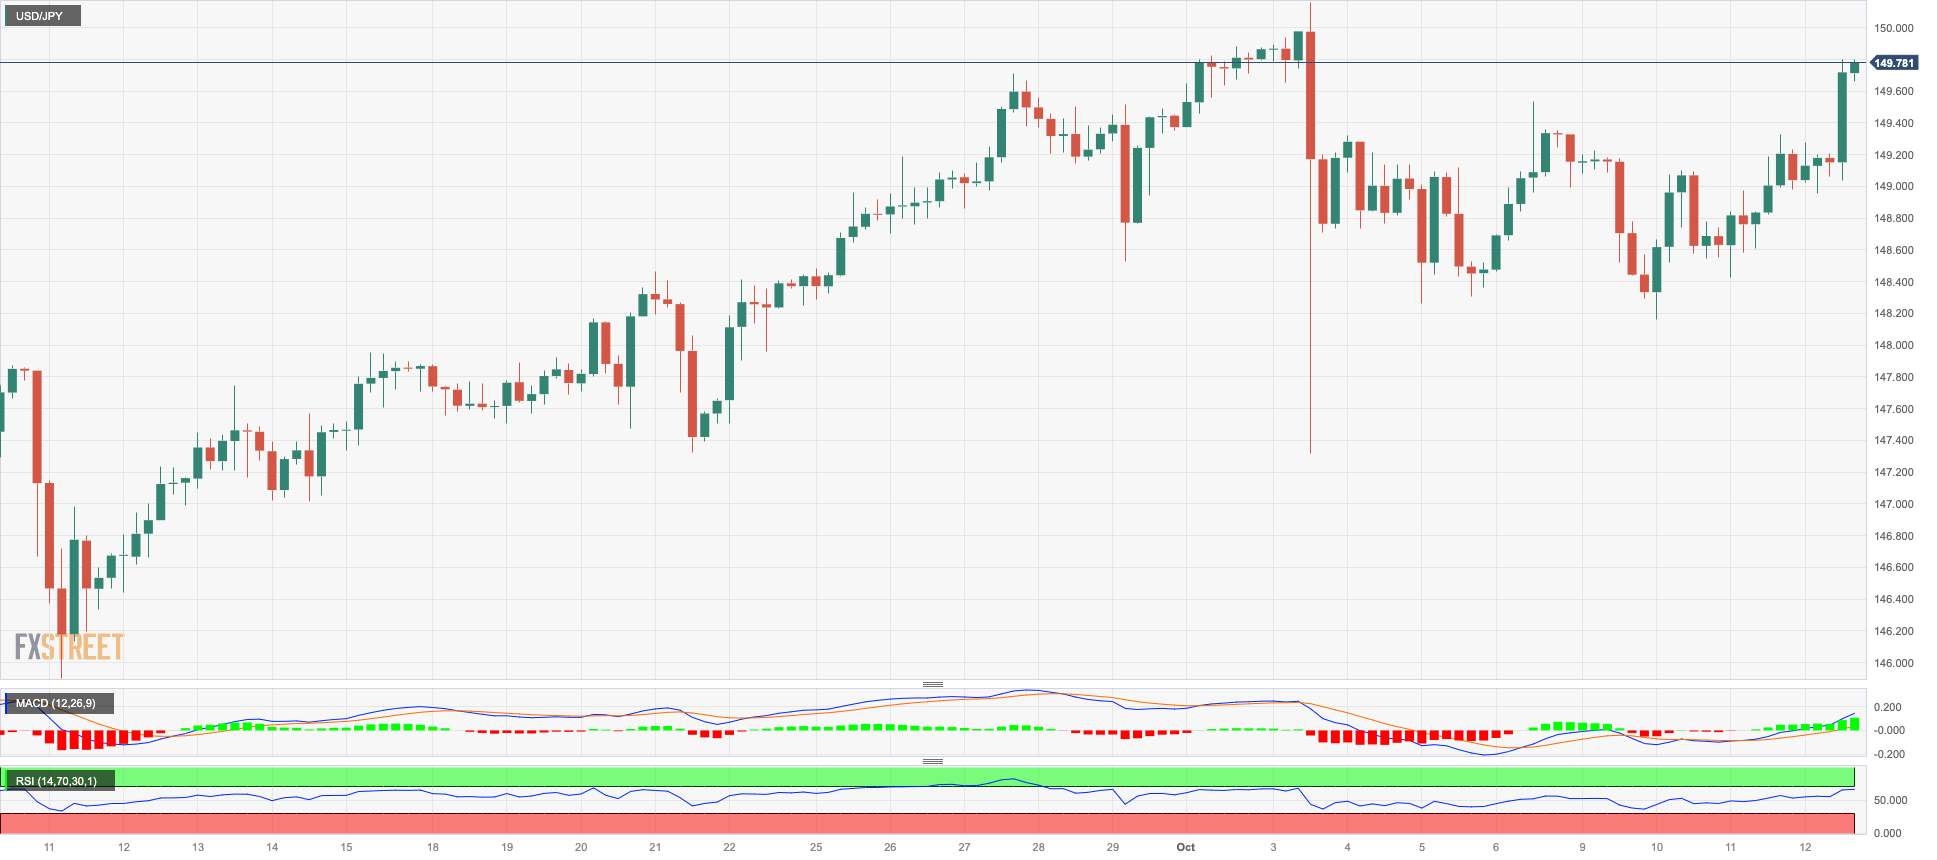
USDJPY
The resurgence of strong buying interest in the greenback, in combination with the equally robust advance in US yields across different maturities, favoured the continuation of the weekly recovery in USD/JPY on Thursday.
In fact, the pair rose to multi-session peaks around 149.80, adding to gains seen in the first half of the week, while speculation of the continuation of the tightening campaign by the Federal Reserve also contributed to the pair’s uptick.
In line with their US peers, the JGB 10-year yields rose to the 0.78% region after four sessions in a row of losses.
In Japan, Producer Prices contracted 0.3% MoM in September and rose 2.0% vs. the same month in 2022. In addition, Bank Lending expanded at an annualized 2.9%, and Machinery Orders contracted 7.7% in the year to August.
If USD/JPY rises above the 2023 high of 150.16 (October 3), it could target the 2022 top of 151.94 (October 21). On the other hand, the 55-day SMA at 146.59 should provide temporary support before reaching the weekly low at 145.89 (September 11). The loss of the latter opens the possibility of a further slide to the September low of 144.43 (September 1), which is ahead of the interim 100-day line SMA at 144.12 and the August low of 141.50 (August 7). The 200-day SMA is at 138.76, just ahead of the July low of 137.23 (July 14). The daily RSI surpassed the 61 level.
Resistance levels: 149.79 150.16 151.94 (4H chart)
Support levels: 148.16 147.27 145.89 (4H chart)
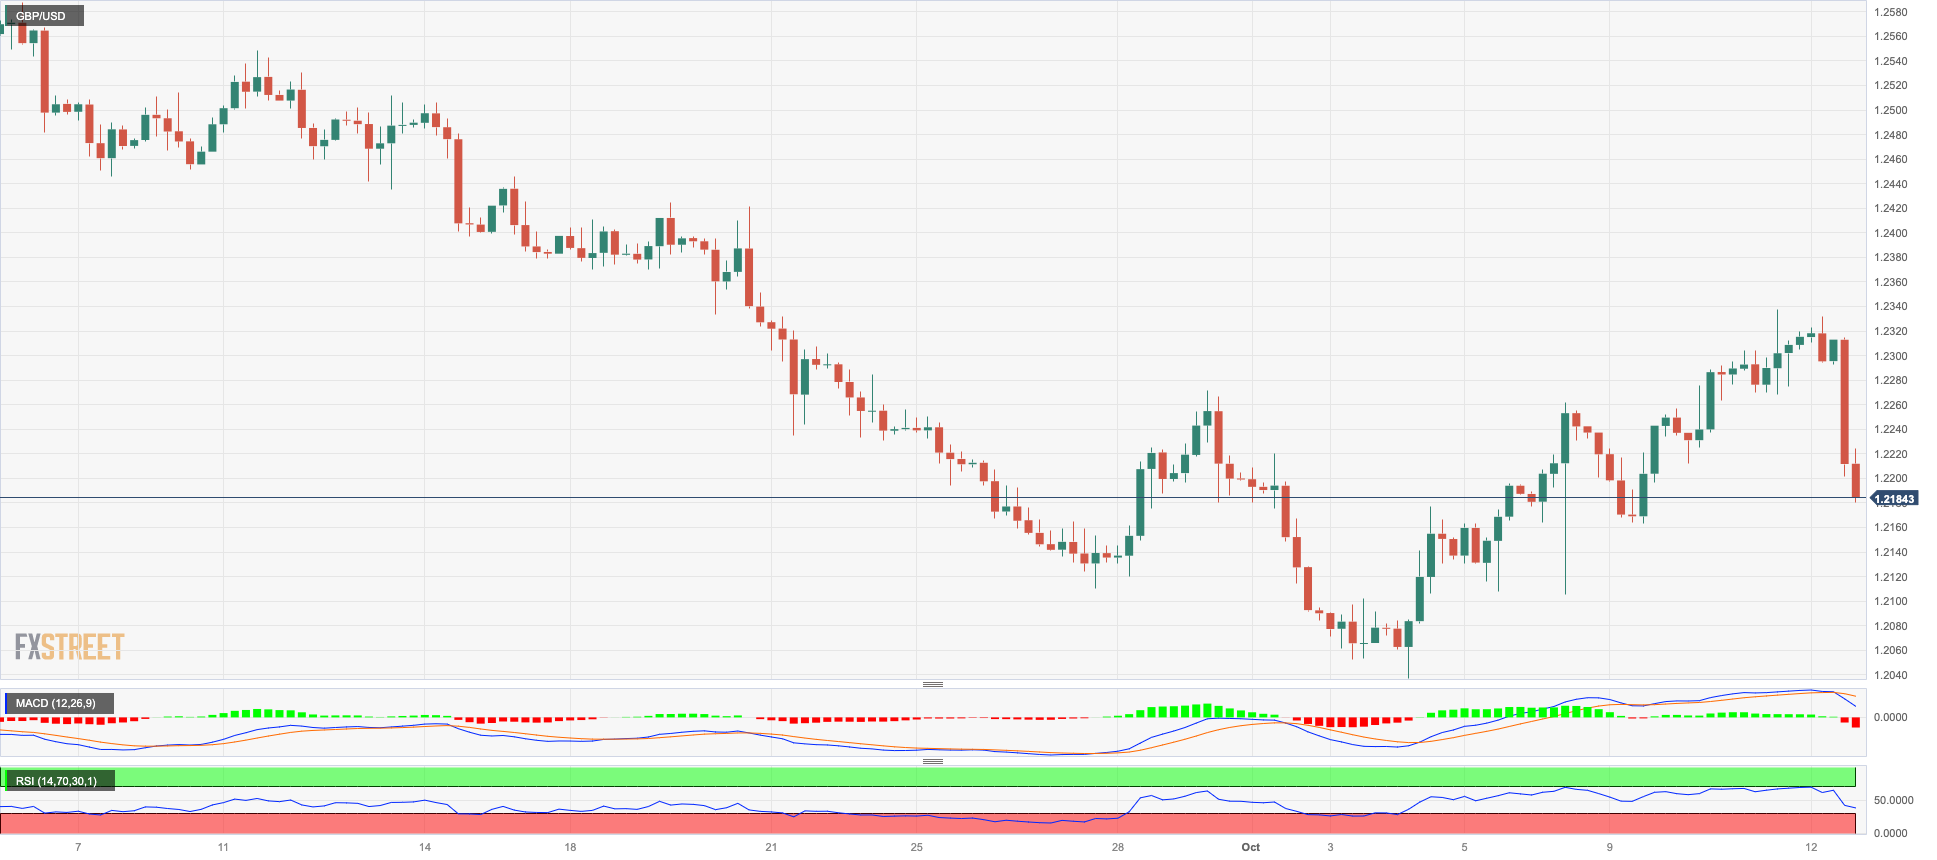
GBPUSD
The sharp recovery in sterling seems to have halted on Thursday.
In fact, GBP/USD reversed six consecutive daily advances and dropped sharply to three-day lows around the 1.2200 neighbourhood on Thursday, all against the backdrop of another late rebound in the greenback and mixed results from the UK docket.
On the latter, the GDP 3-Month Average expanded to 0.3% and 0.5% when it comes to the GDP YoY. In addition, the trade deficit widened to £3.415B in August, and Construction Output rose 2.3% YoY in the same month. Additional data for the month of August saw Industrial Production expand 1.3% over the last twelve months and Manufacturing Production increase 2.8% from a year earlier, both falling short of expectations. Finally, the NIESR Monthly GDP Tracker contracted 0.1% in September.
The next upward hurdle for GBP/USD is the October high of 1.2337 (October 11), seconded by the 200-day SMA of 1.2442. Next on the upside emerges the interim 55-day SMA at 1.2502 ahead of the weekly top at 1.2548 (September 11) and the provisional 100-day at 1.2600. Crossing the latter opens the door to weekly highs of 1.2746 (August 30), 1.2818 (August 10), and 1.2995 (July 27), all of which are ahead of the critical 1.3000 barrier. If Cable goes below the October low of 1.2037 (October 3), it may reintroduce a test of the major round milestone of 1.2000 before the 2023 low of 1.1802 (March 8). The daily RSI retreated to the proximity of 40.
Resistance levels: 1.2337 1.2390 1.2421 (4H chart)
Support levels: 1.2180 1.2105 1.2037 (4H chart)
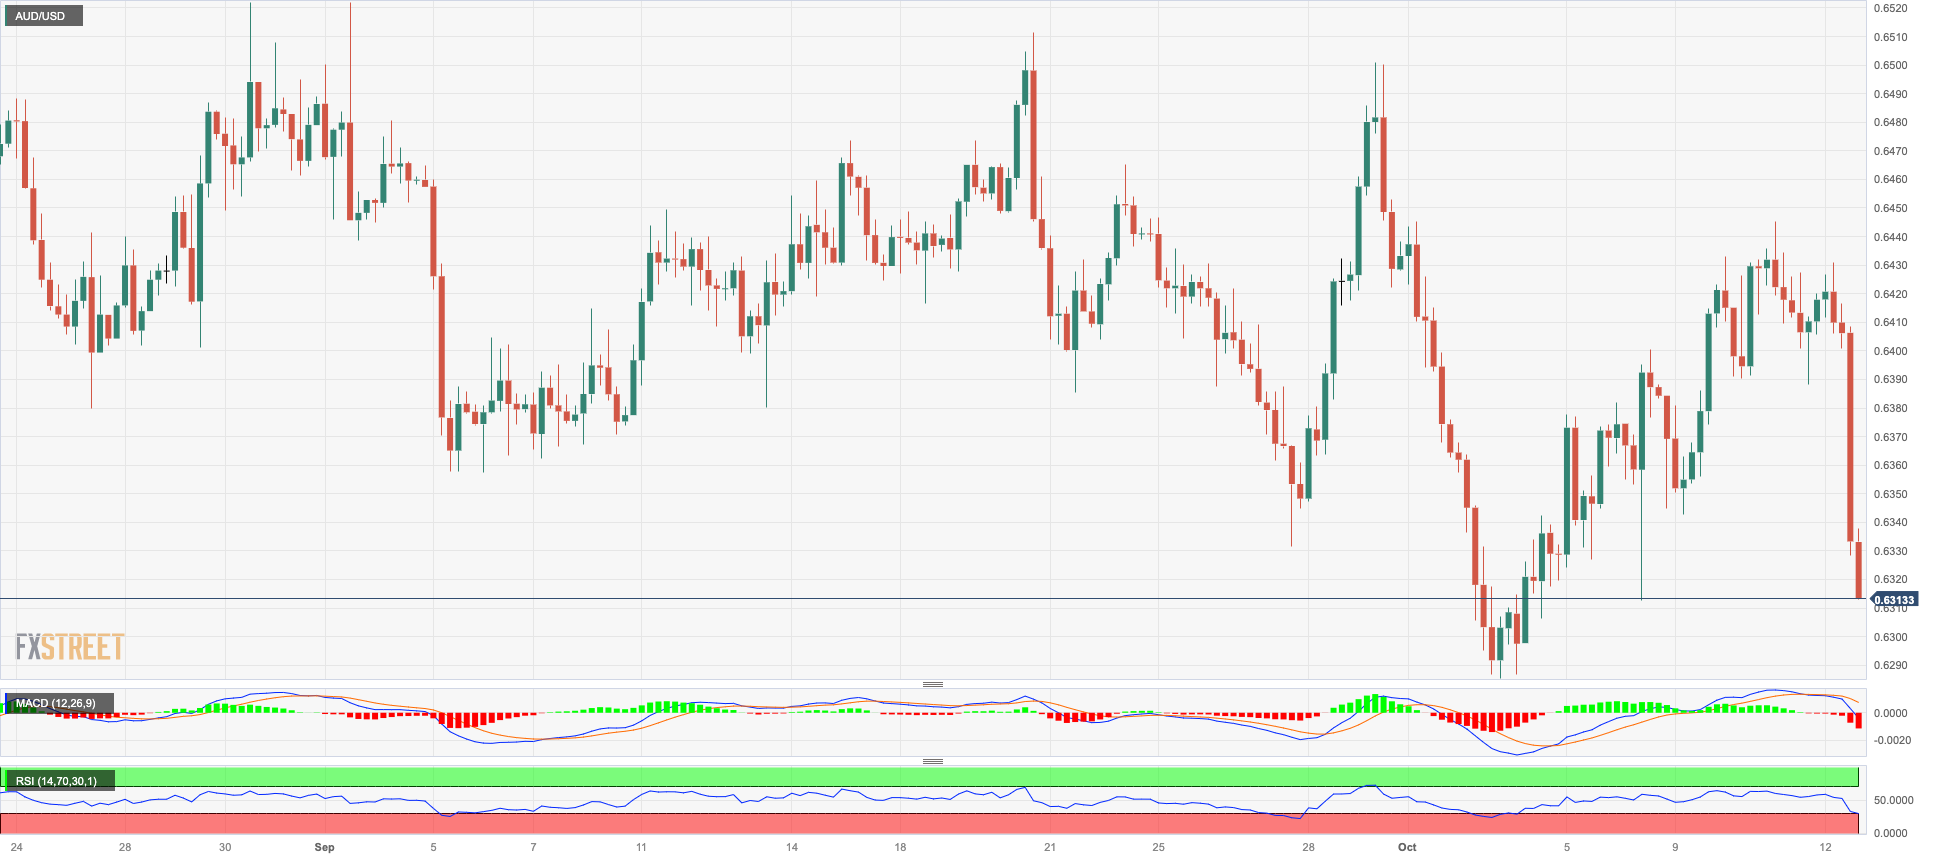
AUDUSD
Further weakness in the risk complex put the Aussie dollar under extra pressure and motivated AUD/USD to add to Wednesday’s decline and revisit the area of four-day lows near 0.6330 on Thursday.
The marked retracement in the pair came on the back of the pronounced bounce in the dollar, particularly in response to higher-than-expected US inflation figures, and was also exacerbated by the broad-based bearish tone in the commodity space despite humble gains in iron ore.
Data-wise Down Under, Consumer Inflation Expectations ticked higher to 4.8% in October.
The weekly high of 0.6522 (August 30) is immediately to the upside for AUD/USD, followed by the provisional 100-day SMA at 0.6564 and another weekly top of 0.6616 (August 10), which comes ahead of the 200-day SMA of 0.6670. A further advance may take the pair to its July peak of 0.6894 (July 14), then to the June high of 0.6899 (June 16), just ahead of the critical 0.7000 level. The breakout from this sector shows the weekly peak at 0.7029 (February 14) before the 2023 top at 0.7157 (February 2). The 2023 bottom at 0.6285 (October 3) is next on the downside, followed by the November 2022 low at 0.6272 (November 7) and the 2022 low at 0.6179 (October 13). The day-to-day RSI broke below the 41 level.
Resistance levels: 0.6445 0.6501 0.6511 (4H chart)
Support levels: 0.6311 0.6285 0.6272 (4H chart)
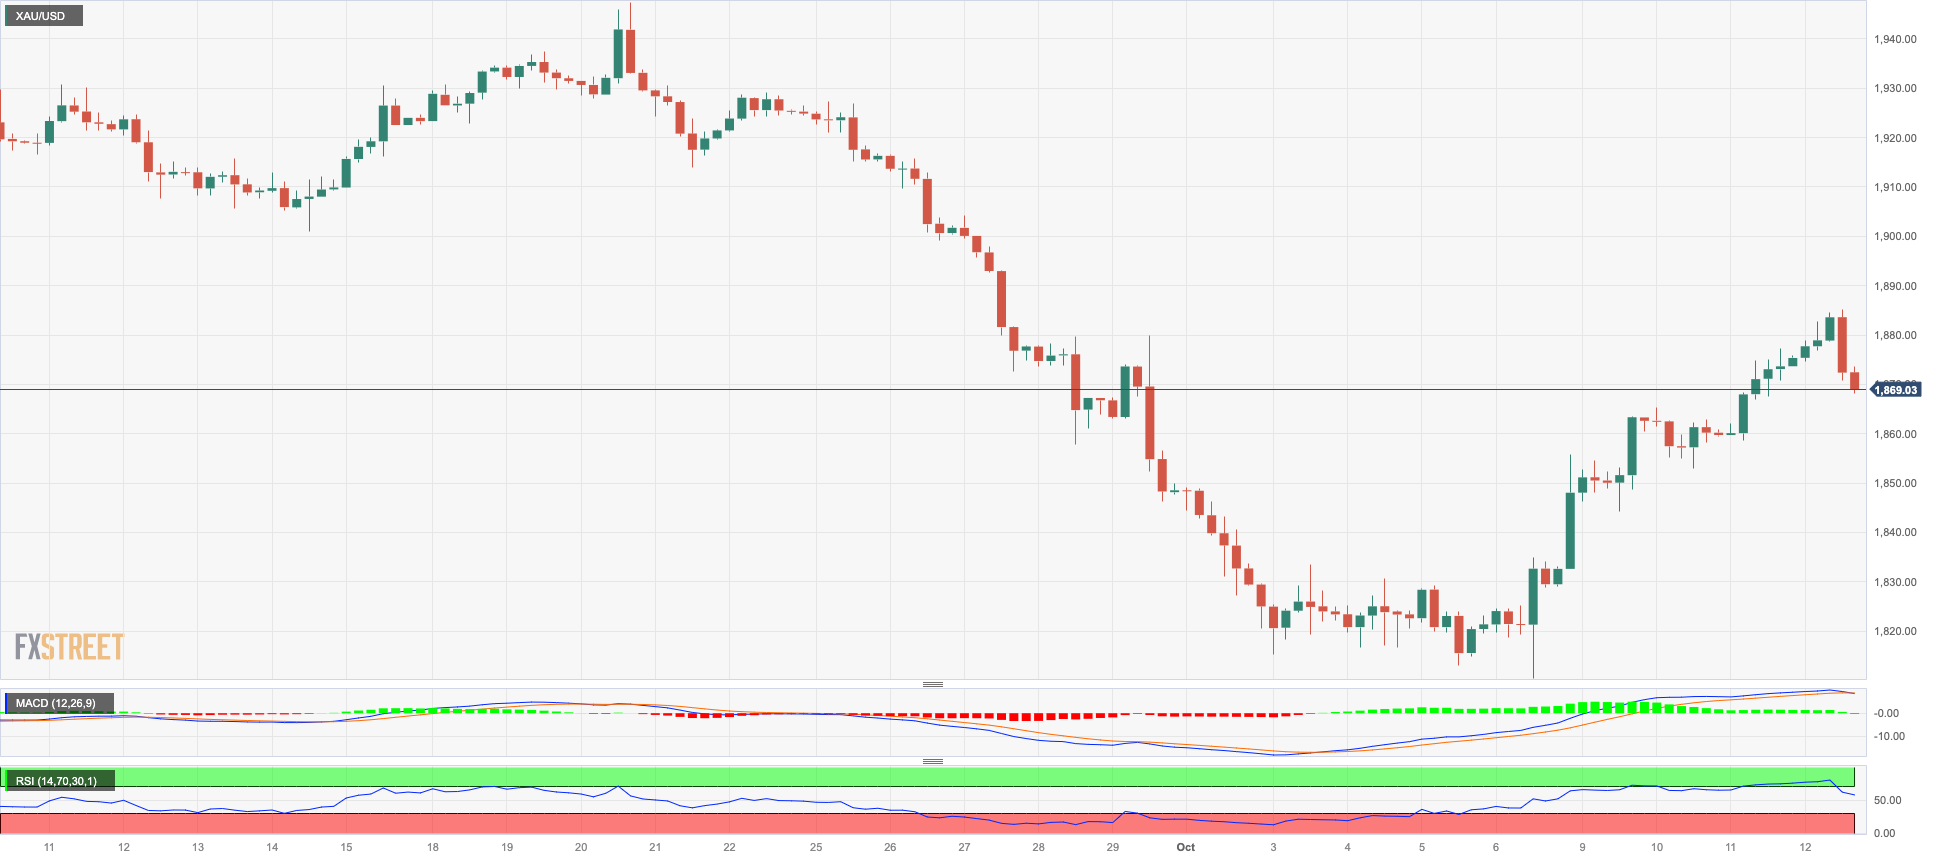
GOLD
Gold prices rose to two-week highs around $1885 per troy ounce before slipping back to negative territory and revisiting the $1870 zone on Thursday.
Indeed, prices of the yellow metal retreated modestly in response to another strong data-led rebound in the greenback, which was also underpinned by a robust increase in US yields across the curve.
In light of the somewhat resilient US inflation figures and the prevailing perception that the Fed might extend its restrictive stance for longer, the recent recovery in bullion is therefore expected to face some headwinds on the short-term horizon.
A further rise in the gold price should now retarget the important 200-day SMA at $1928 before the weekly high at $1947 (September 20) and the September top at $1953 (September 1). If the precious metal breaks above the latter, it could target the July peak of $1987 (July 20), which is just below the critical $2000 yardstick. From here, the 2023 high at $2067 (May 4) can be read, followed by the 2022 top at $2070 (March 8) and the all-time peak at $2075 (August 7, 2020). On the contrary, a break of the October low of $1810 (October 6) reveals the 2023 low of $1804 (February 28), which is closely followed by the critical contention area around $1800.
Resistance levels: $1885 $1899 $1929 (4H chart)
Support levels: $1842 $1810 $1804 (4H chart)
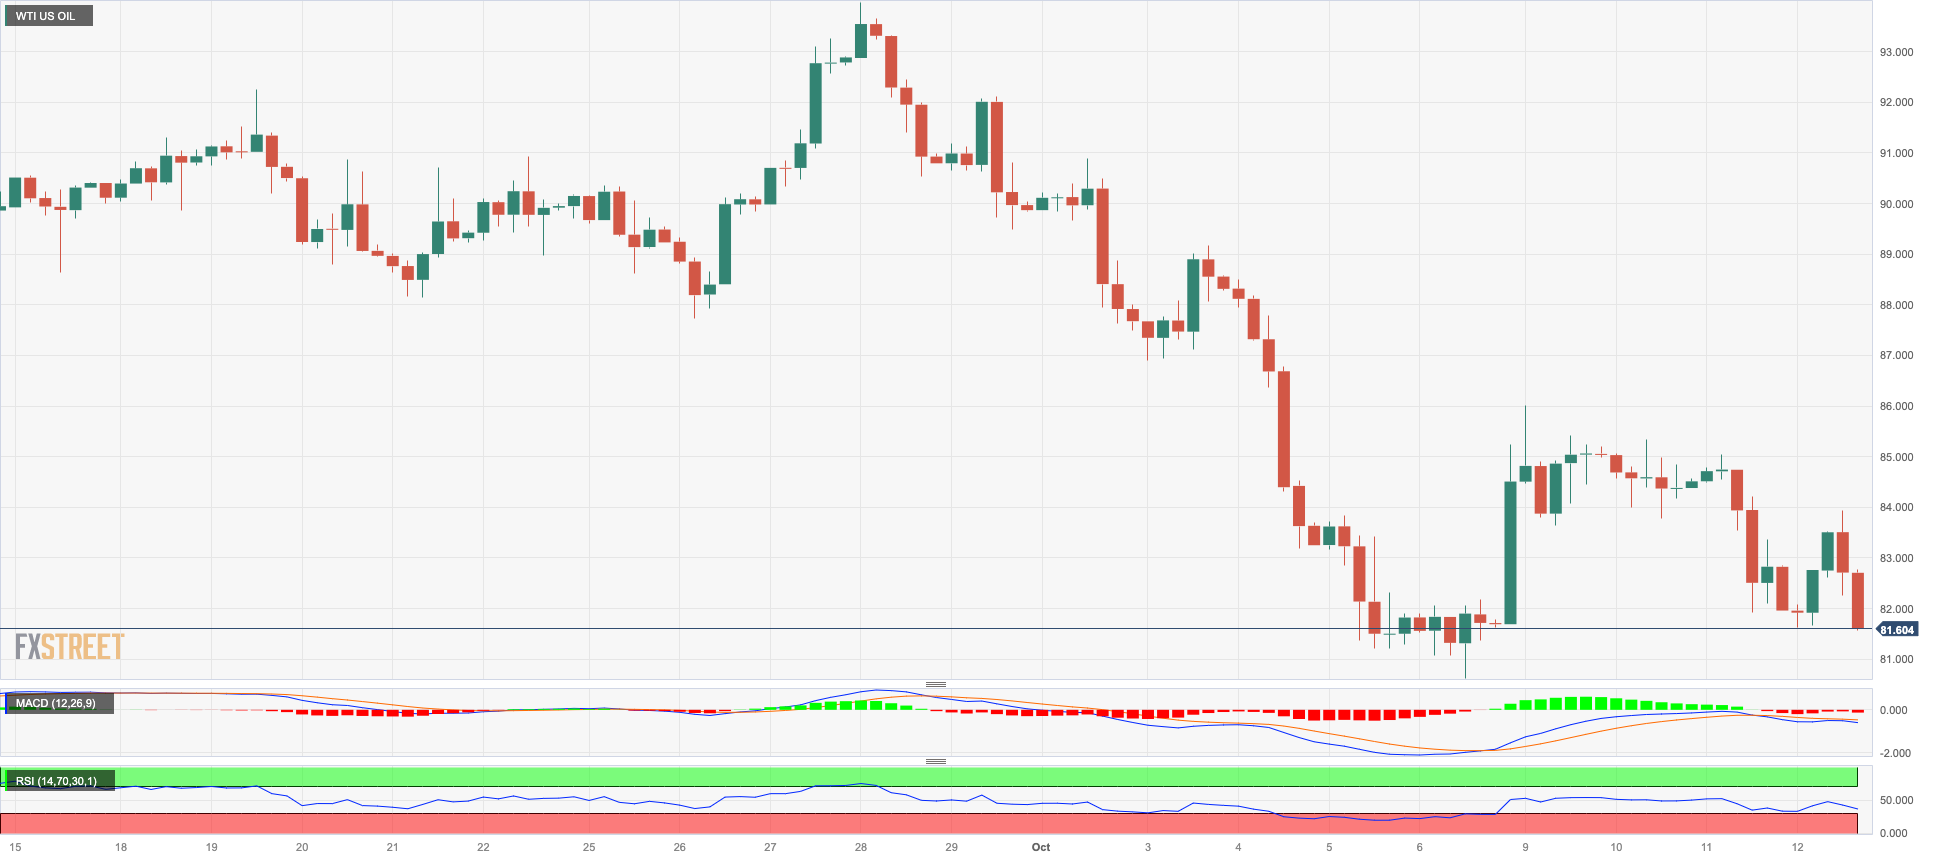
CRUDE WTI
Prices of the American reference for the sweet light crude oil tumbled for the third consecutive session, breaching the $83.00 mark per barrel on Thursday.
The daily pullback in the commodity intensified in response to a larger-than-expected weekly build in US crude oil inventories, which also came in tandem with a record US oil output of 13.2 mbpd in the same period.
In fact, the EIA reported that US crude oil inventories increased by 10.176M barrels in the week to October 6, while supplies at Cushing shrank by 0.319M barrels, Weekly Distillate Stocks went down by 1.837M barrels and gasoline stockpiles dropped by 1.313M barrels.
Also in the calendar, the IEA released its monthly report, revising its oil demand growth forecast for 2024, indicating that more challenging global economic conditions and advancements in energy efficiency will have a dampening effect on consumption. However, the agency has raised its demand forecast for 2023 to 2.3 mbpd from the previous forecast of 2.2 mbpd.
In the meantime, traders continued to digest the recent pledge by Saudi Arabia to keep the crude oil market balanced, which somehow contributed to the re-emergence of the bearish sentiment around the commodity.
Continued selling pressure could see WTI prices retest the October low of $81.56 (October 6) before reaching the critical $80.00 threshold and the August low of $77.64 (August 24), which appears to be supported by the 200-day SMA at $77.60. If the latter is breached, WTI could fall to the weekly low of $73.89 (July 17), then the June low of $66.85 (June 12) and the 2023 low of $63.61 (May 4), all ahead of the crucial $60.00 mark per barrel. On the upside, a breakout of the 2023 high of $94.99 (September 28) might reintroduce a challenge of the weekly top of $97.65 (August 30, 2022) prior to the psychological $100.00 threshold per barrel.
Resistance levels: $87.20 $90.23 $93.06 (4H chart)
Support levels: $82.75 $81.47 $79.31 (4H chart)
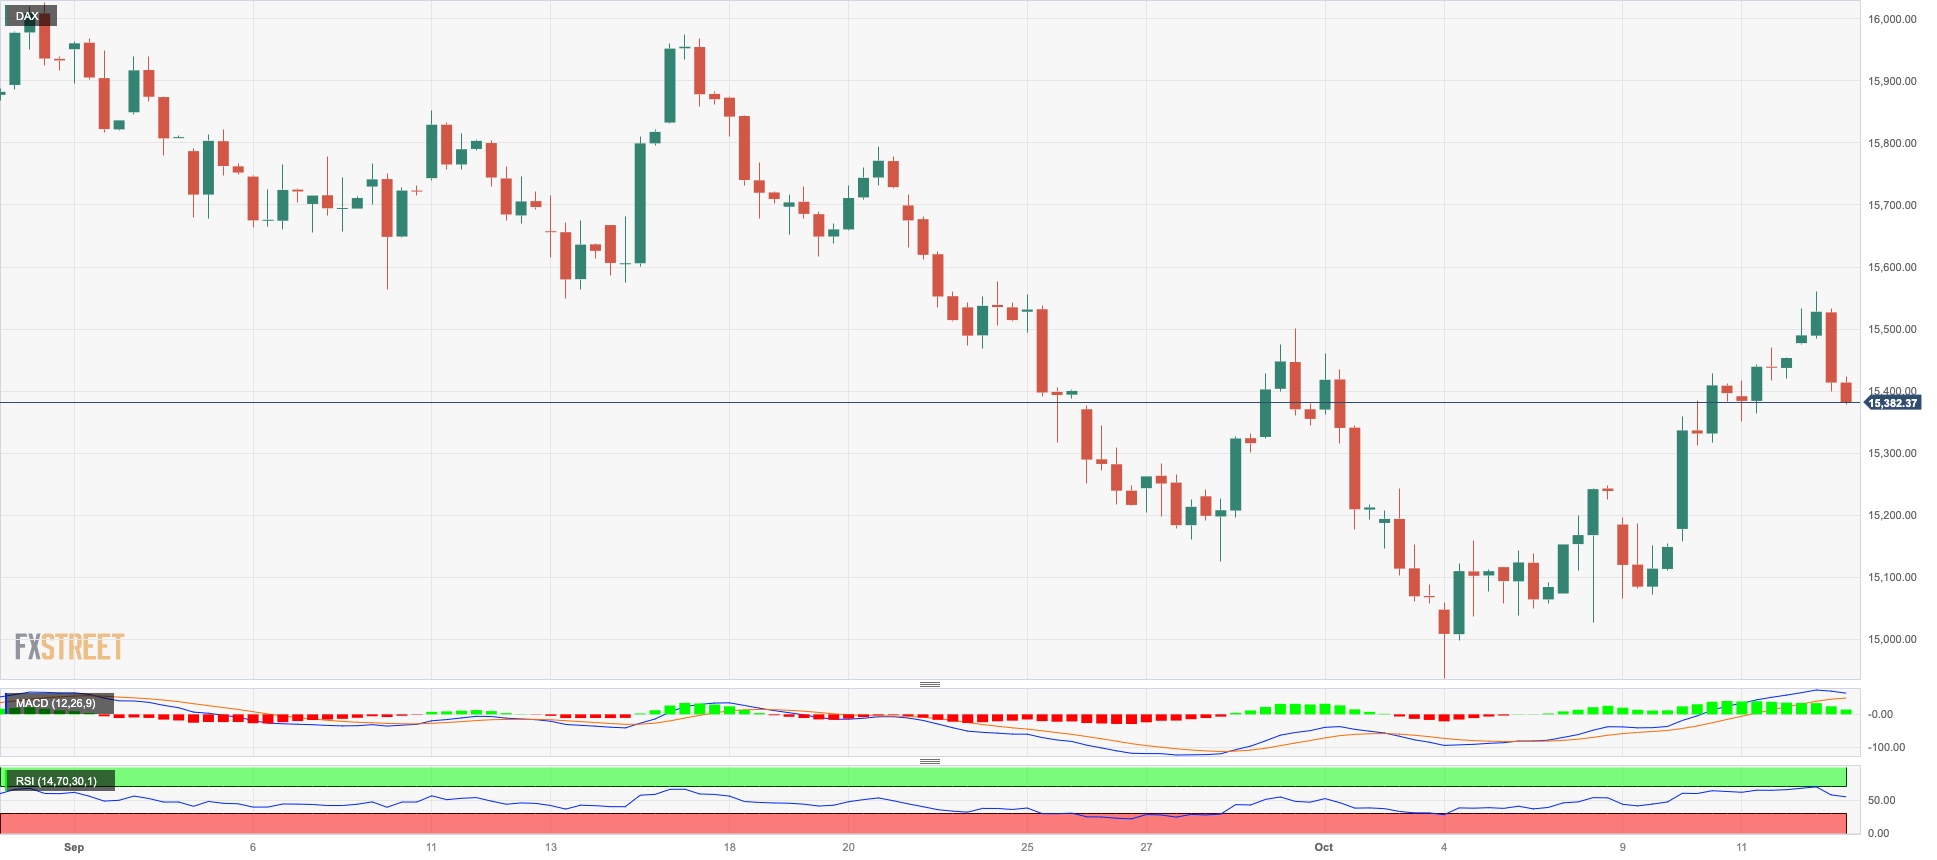
GER40
Germany’s benchmark DAX40 could not sustain the early move to new three-week highs near 15600 and sparked a modest corrective decline to end Thursday’s session around the 15400 region.
Indeed, German equities traded on the defensive on the back of persistent concerns over the economic growth in the region in a context where inflation keeps running hot and well above the ECB’s target.
On the latter, further dovish narrative from the ECB’s policymakers reinforced the view that the central bank might have ended its tightening campaign for the time being.
On the geopolitical front, concerns around an escalation of the Middle East conflict remained on the rise, emerging as a potential source of risk aversion in the near term.
The 200-day SMA at 15635 appears on the upside for the DAX40 just ahead of the September high of 15989 (September 15), followed by the weekly highs of 16042 (August 31) and 16060 (August 10). A break above this level could lead to a retest of the all-time top of 16528 (July 31). If sellers regain control, the index could retarget the October low of 14948 (October 4) before moving towards the March low of 14458 (March 20) and the December 2022 low of 13791 (December 20), which precedes to the 2022 low of 11862 (September 28). The daily RSI eased to the 49 zone.
Best Performers: Rheinmetall AG, Infineon, Hannover Rueck SE
Worst Performers: RWE AG ST, E.ON SE, Zalando SE
Resistance levels: 15575 15768 15989 (4H chart)
Support levels: 15363 14948 14809 (4H chart)
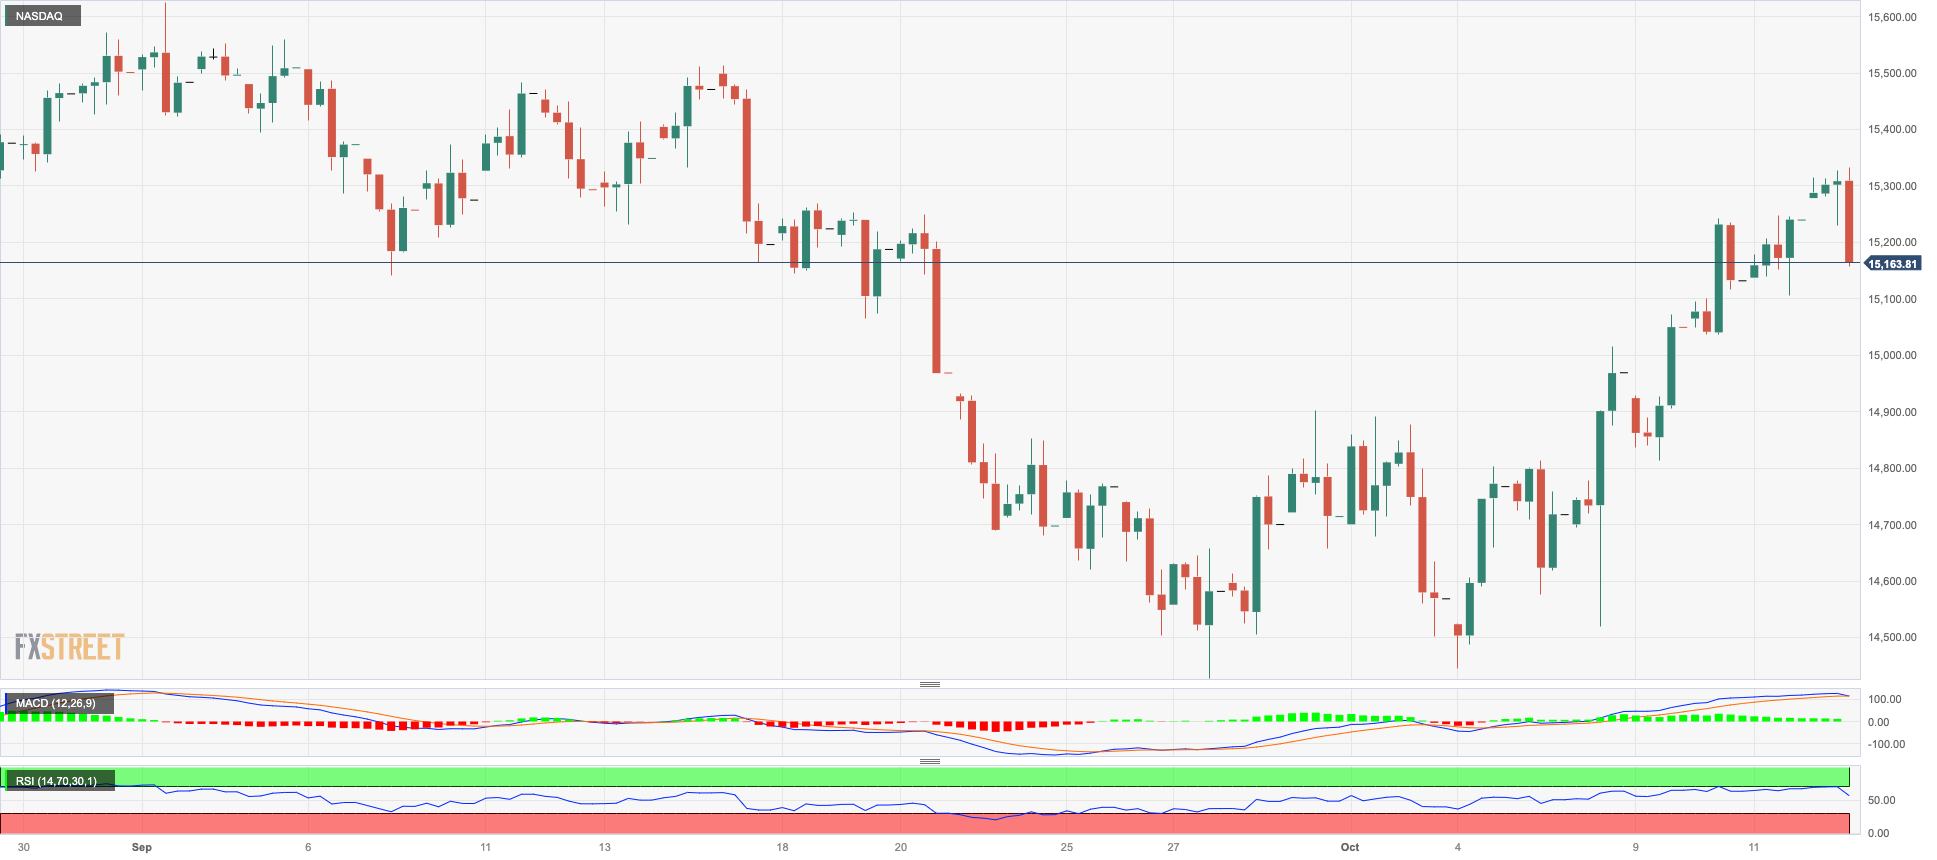
NASDAQ
The US tech sector gave away part of the recent four-session positive streak and prompted the key Nasdaq 100 to drop to the 15200 region on Thursday.
The corrective pullback in the tech index came in response to the sharp reversal in the greenback coupled with the equally strong move higher in US yields across different maturities.
Collaborating with the downbeat mood, US inflation figures came in higher than estimated in September, bolstering further the idea of a tighter-for-longer stance by the Fed.
Further advances might push the Nasdaq 100 to its October high of 15333 (October 12). The breakout from the latter may lead to the September top of 15618 (September 1), which would precede the weekly peak of 15803 (July 31) and the 2023 high of 15932 (July 19), both of which would be ahead of the round 16000 level. A decline below the September low of 14432 (September 27) might reintroduce the weekly low of 14283 (June 7), ahead of the 200-day SMA at 13722 and the April low of 12724 (April 25). After breaking through this zone, the index may aim for the March low of 11695 (March 13) before the 2023 low of 10696 (January 6). The daily RSI receded to the proximity of 56.
Top Gainers: Fastenal, Walgreen Boots, KLA Corp
Top Losers: JD.com Inc Adr, Atlassian Corp Plc, Warner Bros Discovery
Resistance levels: 15333 15512 15618 (4H chart)
Support levels: 14432 14283 13520 (4H chart)
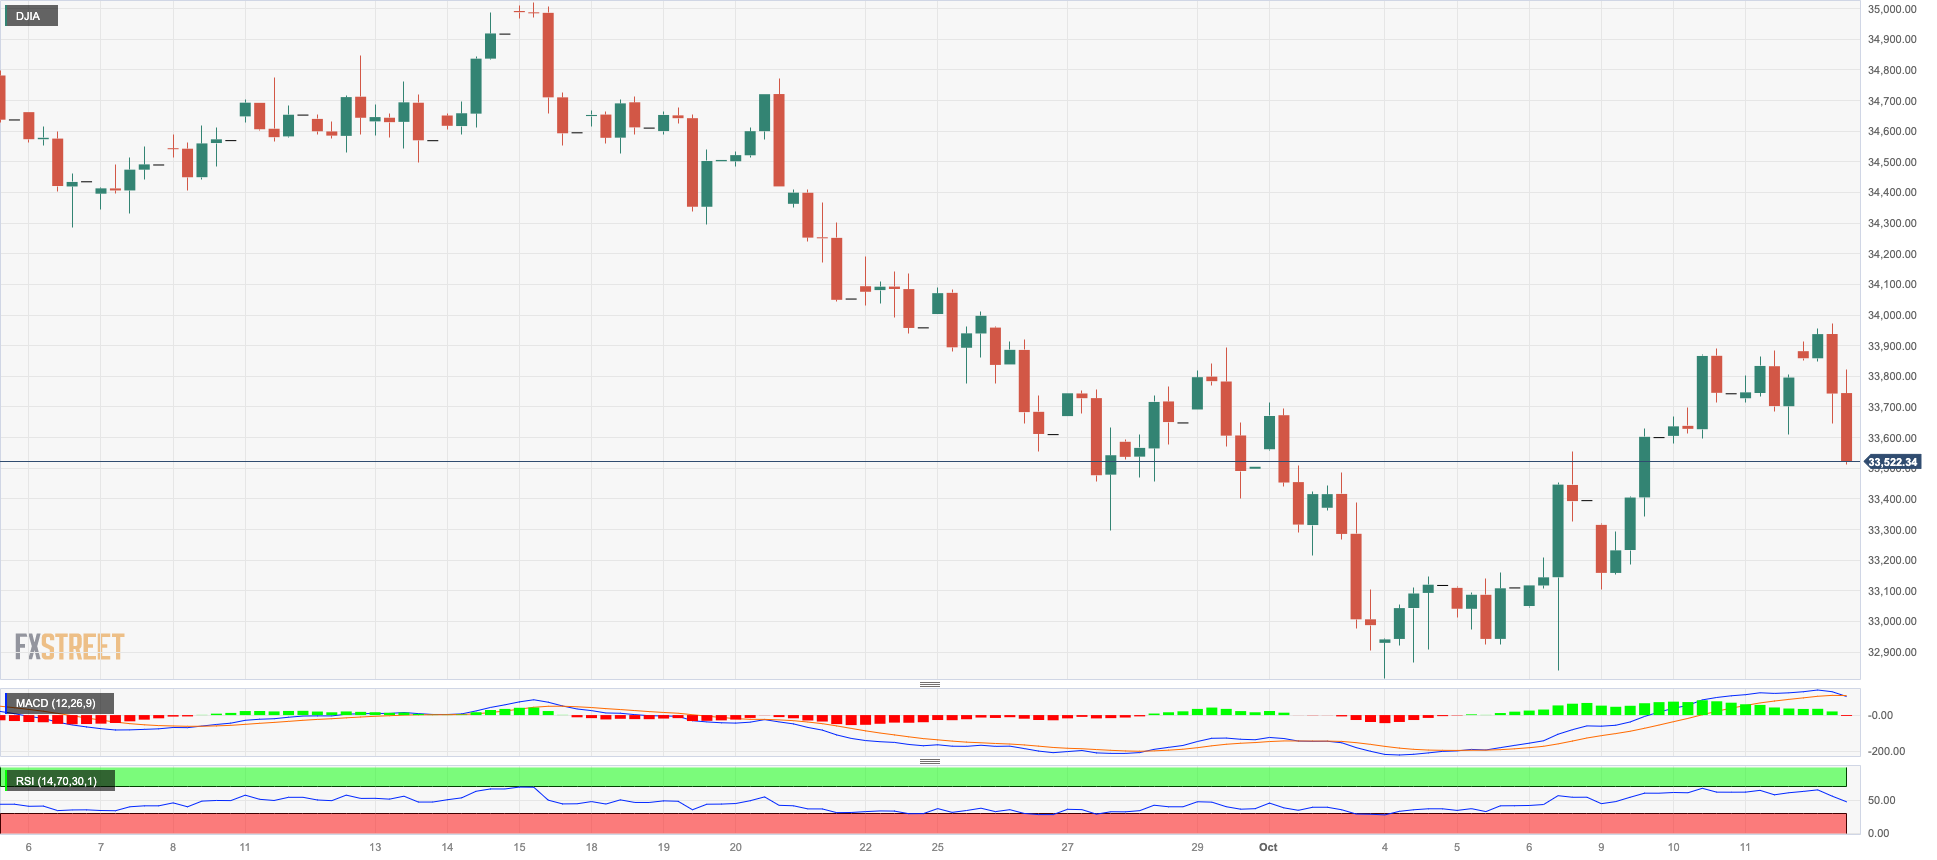
DOW JONES
US stocks measured by the Dow Jones reversed four consecutive daily advances, coming under selling pressure after poking with the key 200-day SMA near 33800 and eventually flirting with three-day lows around the 33600 region on Thursday.
In fact, higher-than-estimated US inflation figures tracked by the CPI during September reinforced the case of a tighter-for-longer Fed and underpinned the perception of those Fed’s rate setters who favour extra rate hikes to tame inflationary pressures, all eventually weighing on investors’ sentiment and sponsoring the daily retracement in the index.
On the whole, the Dow Jones retreated 0.57% to 33613, the S&P500 dropped 0.57% to 4351, and the tech-focused Nasdaq Composite deflated 0.50% to 13592.
If the Dow Jones maintains its upward momentum, it may challenge the interim 100-day and 55-day SMAs at 34280 and 34469, respectively, before hitting the September high of 34977 (September 14). North of here is the weekly top of 35070 (August 31) and the 2023 peak of 35679 (August 1). If the latter is exceeded, the 2022 high of 35824 (February 9) may be achieved before the all-time high of 36952 (January 5, 2022). If the index goes below the October low of 32873 (October 4), it will almost likely reach the May low of 32586 (May 25) before sliding to the 2023 low of 31429 (March 15). For the day, the RSI dropped to the proximity of 43.
Top Performers: Walgreen Boots, Apple, Nike
Worst Performers: Verizon, Boeing, Coca-Cola
Resistance levels: 33898 34282 34977 (4H chart)
Support levels: 32846 32586 31805 (4H chart)
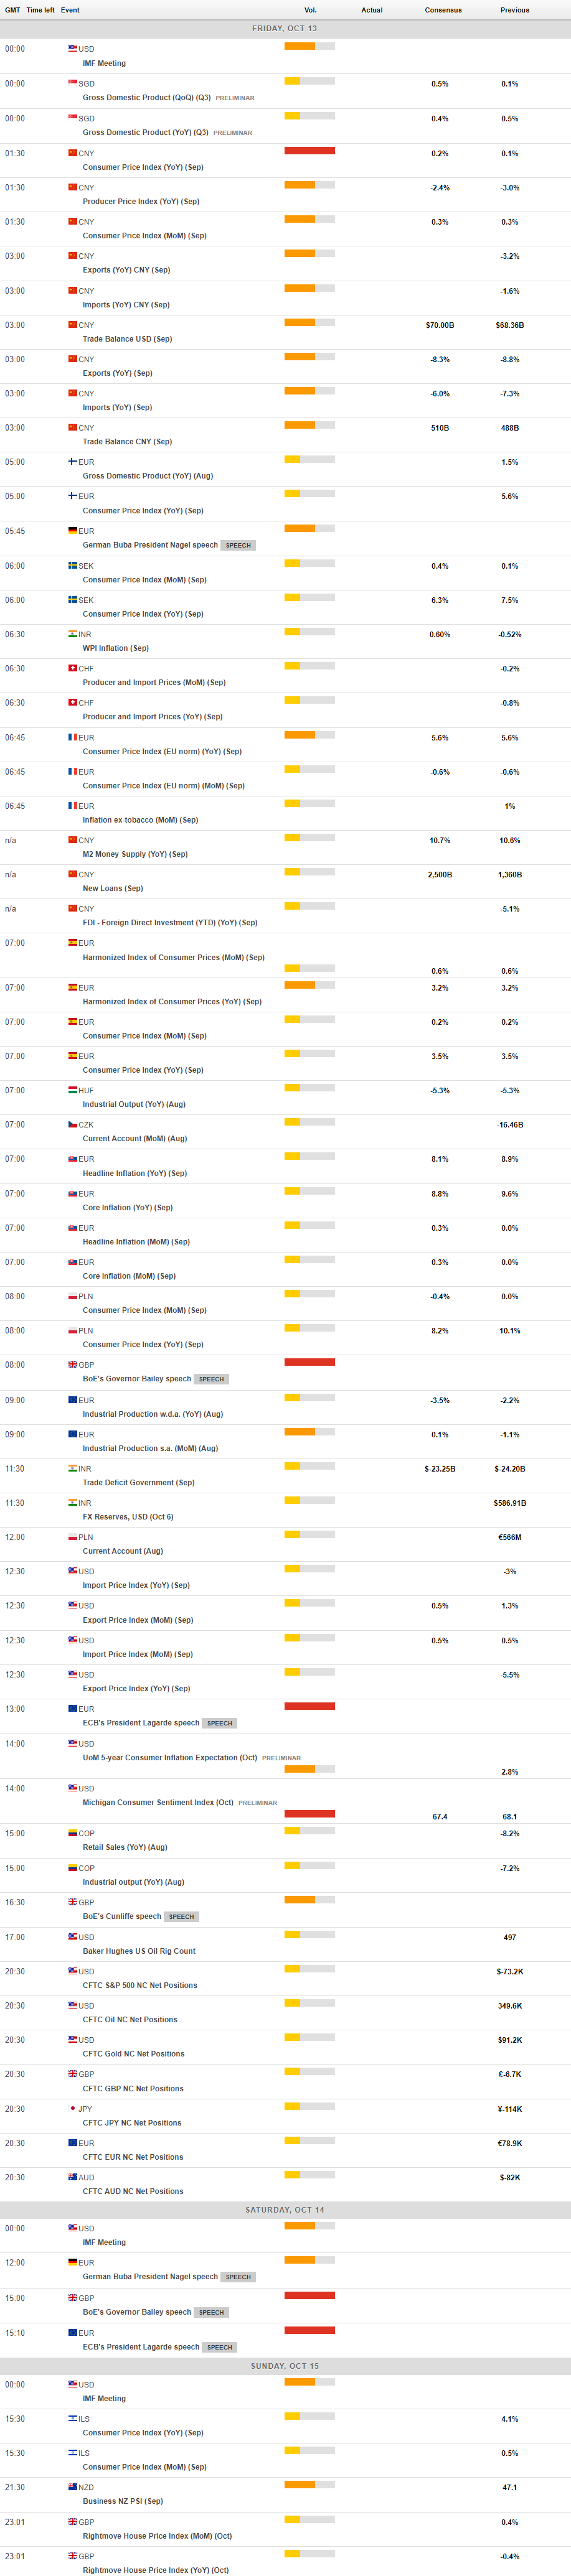
MACROECONOMIC EVENTS
All Information & Updates provided by:

All information relating to the financial markets available on this page has been prepared and issued by FXStreet (Forexstreet SL, Spain, Reg: B62498233) on the basis of publicly available information and all information believed to be reliable and does not conflict with Kuwaiti local laws, and all necessary care has been taken to before the company to ensure that the facts mentioned are correct from the source.
NCM Investment nor any of its directors or employees shall in any way be held responsible for the contents of this news, and the information contained on this page is intended only to provide clients with publicly available information and should not be construed as investment advice, report or analysis and/or constitute an offer or invitation to buy or sell financial instruments of any kind.
RISK WARNING: Forex and CFDs are highly risky leveraged products, as losses can exceed deposits. Please ensure you understand all the risks and take independent advice if necessary. NCM will segregate the clients based on the criteria of the regulator and its bylaws. NCM does not provide any advisory service; the material published does not constitute advice or a recommendation for a transaction in any financial instrument. NCM accepts no responsibility for any use of the content presented and any consequences of that use. Anyone acting on the information provided does so at their own risk.