Daily Market Updates
16 Oct 2023
USDJPY
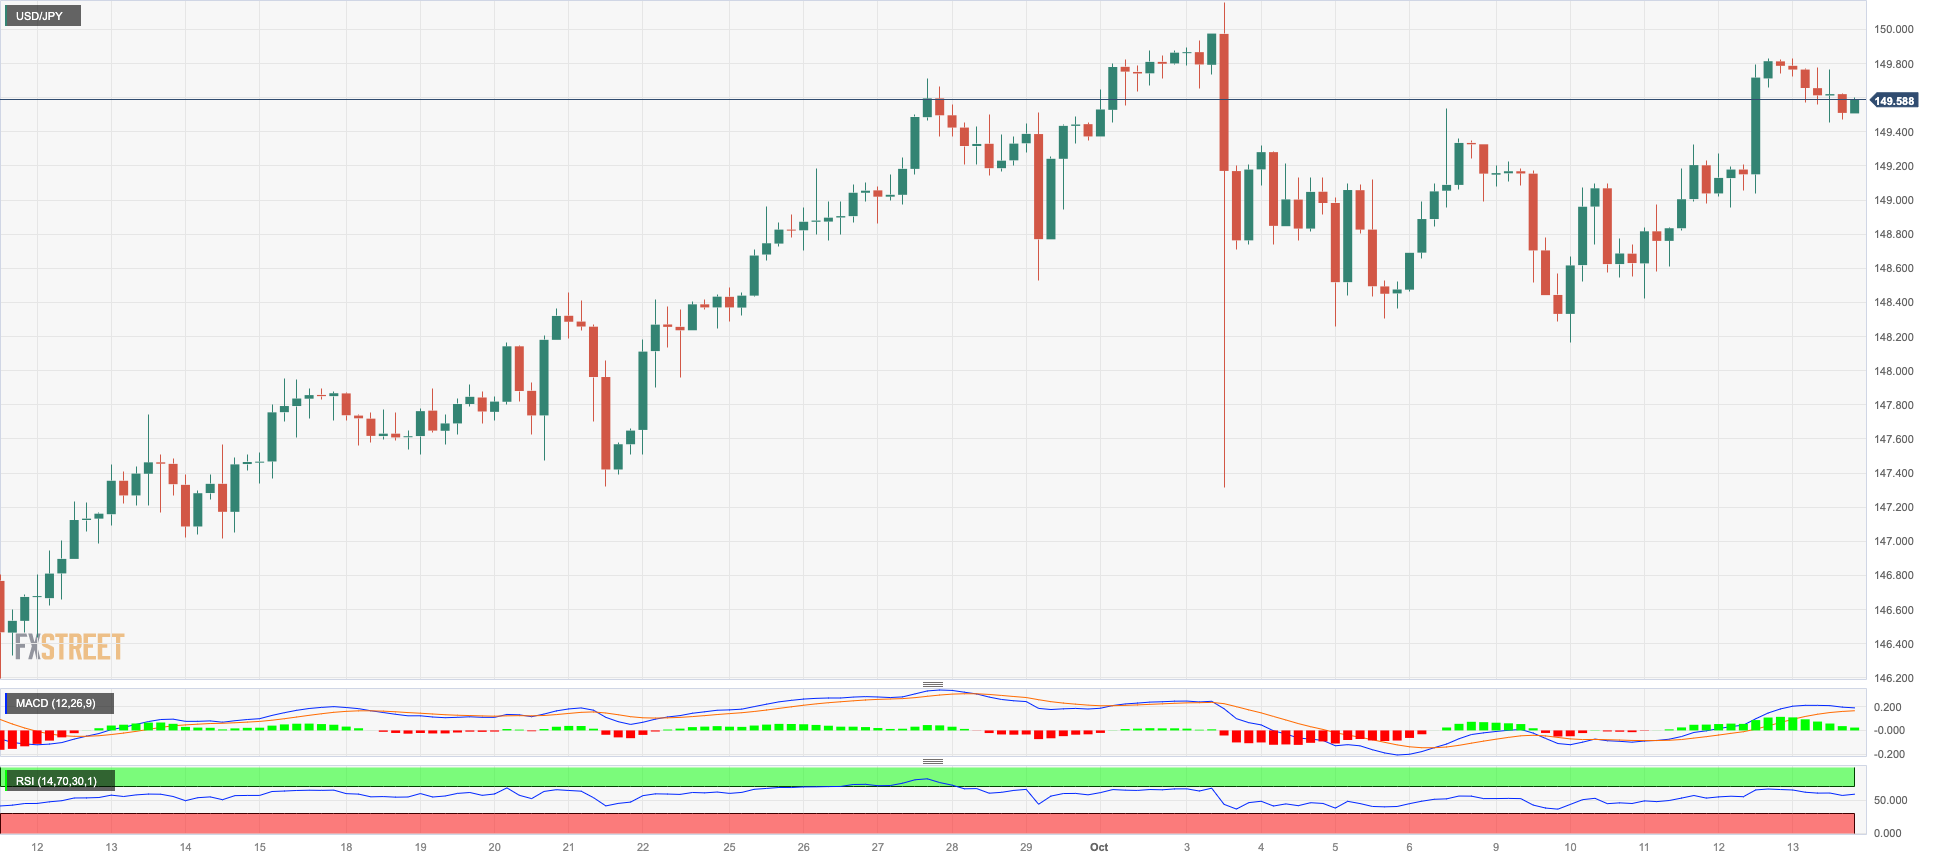
The recovery in the Japanese safe haven weighed on USD/JPY and sparked the first decline after three consecutive daily gains on Friday.
Declining US yields across different maturities and persevering risk aversion on the back of increasing geopolitical risks maintained the yen well bid and underpinned the bearish move in spot.
In the Japanese bond market, however, the JGB 10-year yields rose to the 0.78% area after four daily drops in a row.
In the docket, Foreign Bond Investment increased to ¥183.4B in the week to October 7.
If USD/JPY goes over the 2023 high of 150.16 (October 3), it might then attempt to challenge the 2022 top of 151.94 (the October 21). On the flip side, the 55-day SMA at 146.74 should give temporary support before the weekly low at 145.89 (September 11). The loss of the latter allows for a further retracement to the September low of 144.43 (September 1), which is ahead of the intermediate 100-day SMA at 144.21 and the August low of 141.50 (August 7). The 200-day SMA is at 138.85, above the July low of 137.23 (July 14). The daily RSI receded marginally to the vicinity of 59.
Resistance levels: 149.82 150.16 151.94 (4H chart)
Support levels: 148.16 147.27 145.89 (4H chart)
GBPUSD
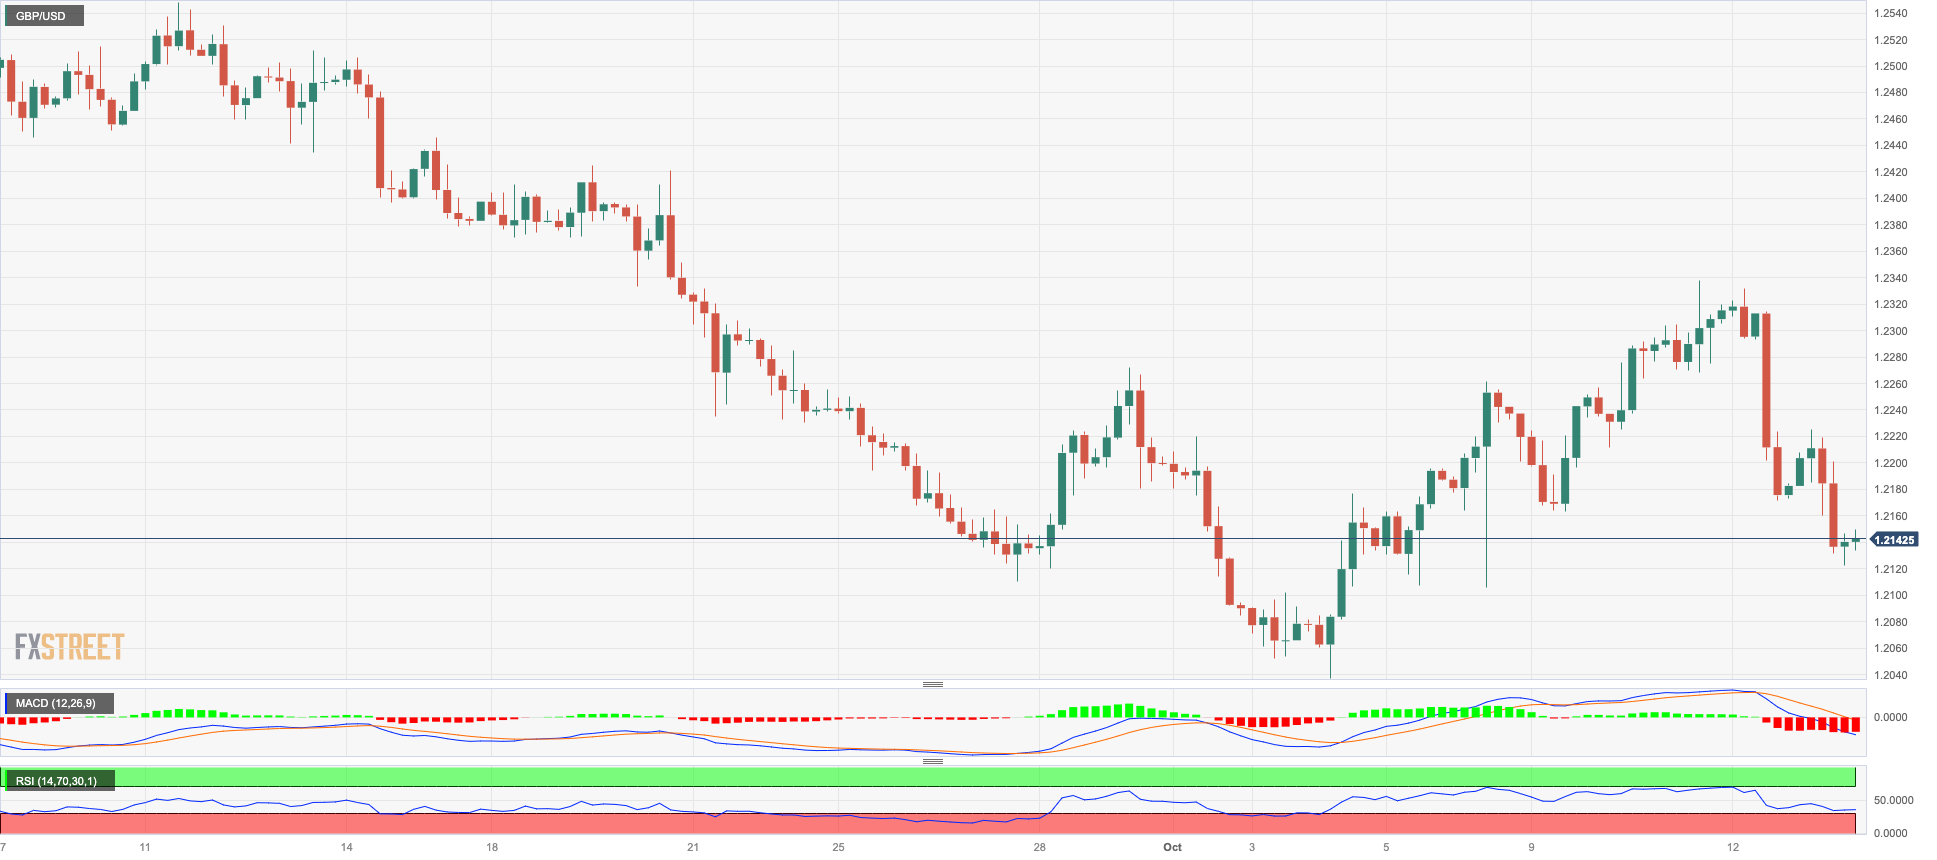
Another positive session in the greenback sponsored the second consecutive daily pullback in the British pound on Friday.
In fact, extra weakness in the quid forced GBP/USD to retreat to weekly lows in the 1.2120 region amidst persistent risk aversion in response to geopolitical risks, which in turn favoured the demand for UK bonds and the daily retracement in UK 10-year gilts.
From the BoE, Governor A. Bailey argued that the country’s potential growth has declined, at the time when he reiterated the restrictive stance of the economy.
There were no data releases scheduled in the UK calendar at the end of the week.
Extra losses in GBP/USD could now revisit the October low of 1.2037 (3 October), ahead of the key round level of 1.2000 and the 2023 low of 1.1802 (March 8). On the upside, the next hurdle for Cable is the October high of 1.2337 (October 11), followed by the 200-day SMA at 1.2442 and the interim 55-day SMA at 1.2489. Further up aligns the weekly high at 1.2548 (September 11) seconded by the transitory 100-day SMA at 1.2598 and weekly tops at 1.2746 (August 30), 1.2818 (August 10) and 1.2995 (July 27), all preceding the critical 1.3000 threshold. The day-to-day RSI dropped to the 37 area.
Resistance levels: 1.2337 1.2355 1.2421 (4H chart)
Support levels: 1.2122 1.2105 1.2037 (4H chart)
AUDUSD
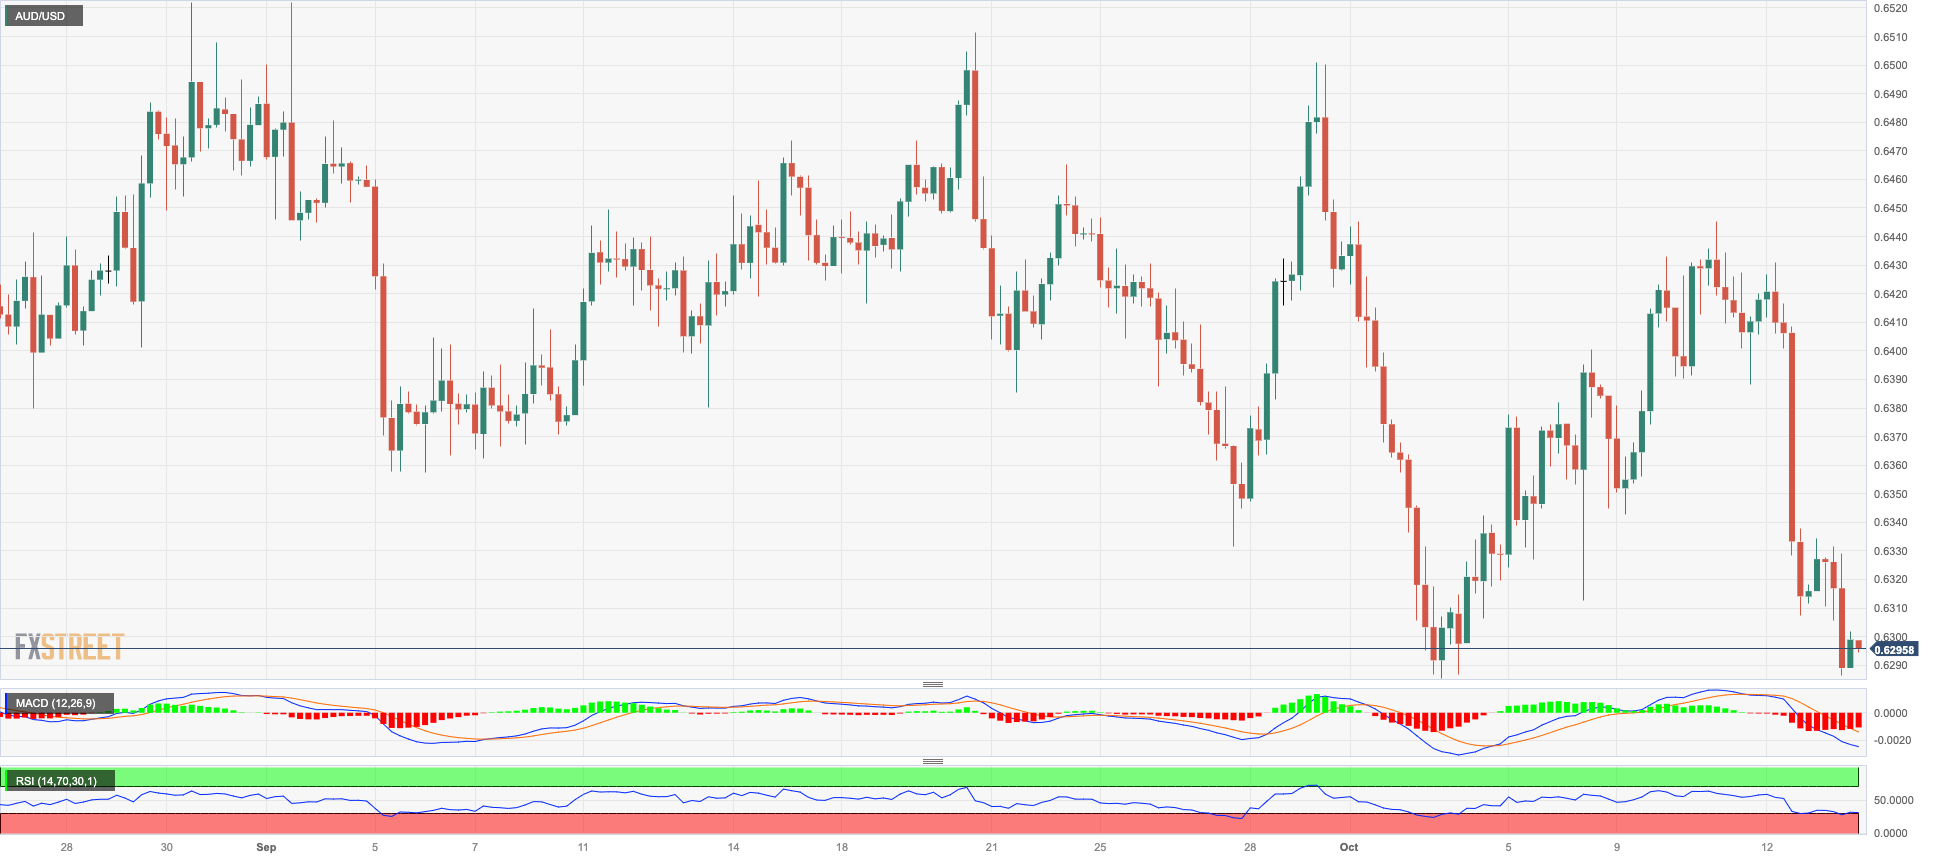
AUD/USD traded on the defensive for the third straight day and flirted once again with the area of YTD lows near 0.6280 on Friday.
Small gains in the greenback appear to have been enough to drag the pair lower in combination with further weakness in the commodity universe, while lower than expected Chinese inflation figures added to the sour mood around the Aussie dollar.
The Australian docket was empty at the end of the week.
Next on the downside for AUD/USD is the 2023 bottom at 0.6285 (October 3), followed by the November 2022 low at 0.6272 (November 7) and the 2022 low at 0.6179. (October 13). By contrast, the weekly high of 0.6522 (August 30) is immediately on the upside for the pair, followed by the temporary 100-day SMA at 0.6562 and another weekly top of 0.6616 (August 10), ahead of the 200-day SMA at 0.6667. A further rise could take the pair to its July peak of 0.6894 (July 14) and then to the June high of 0.6899 (June 16), just ahead of the critical 0.7000 level. The breakout from this sector shows the weekly high at 0.7029 (February 14) prior to the 2023 top at 0.7157 (February 2). The RSI dropped below the 38 mark.
Resistance levels: 0.6409 0.6445 0.6501 (4H chart)
Support levels: 0.6285 0.6272 0.6210 (4H chart)
GOLD
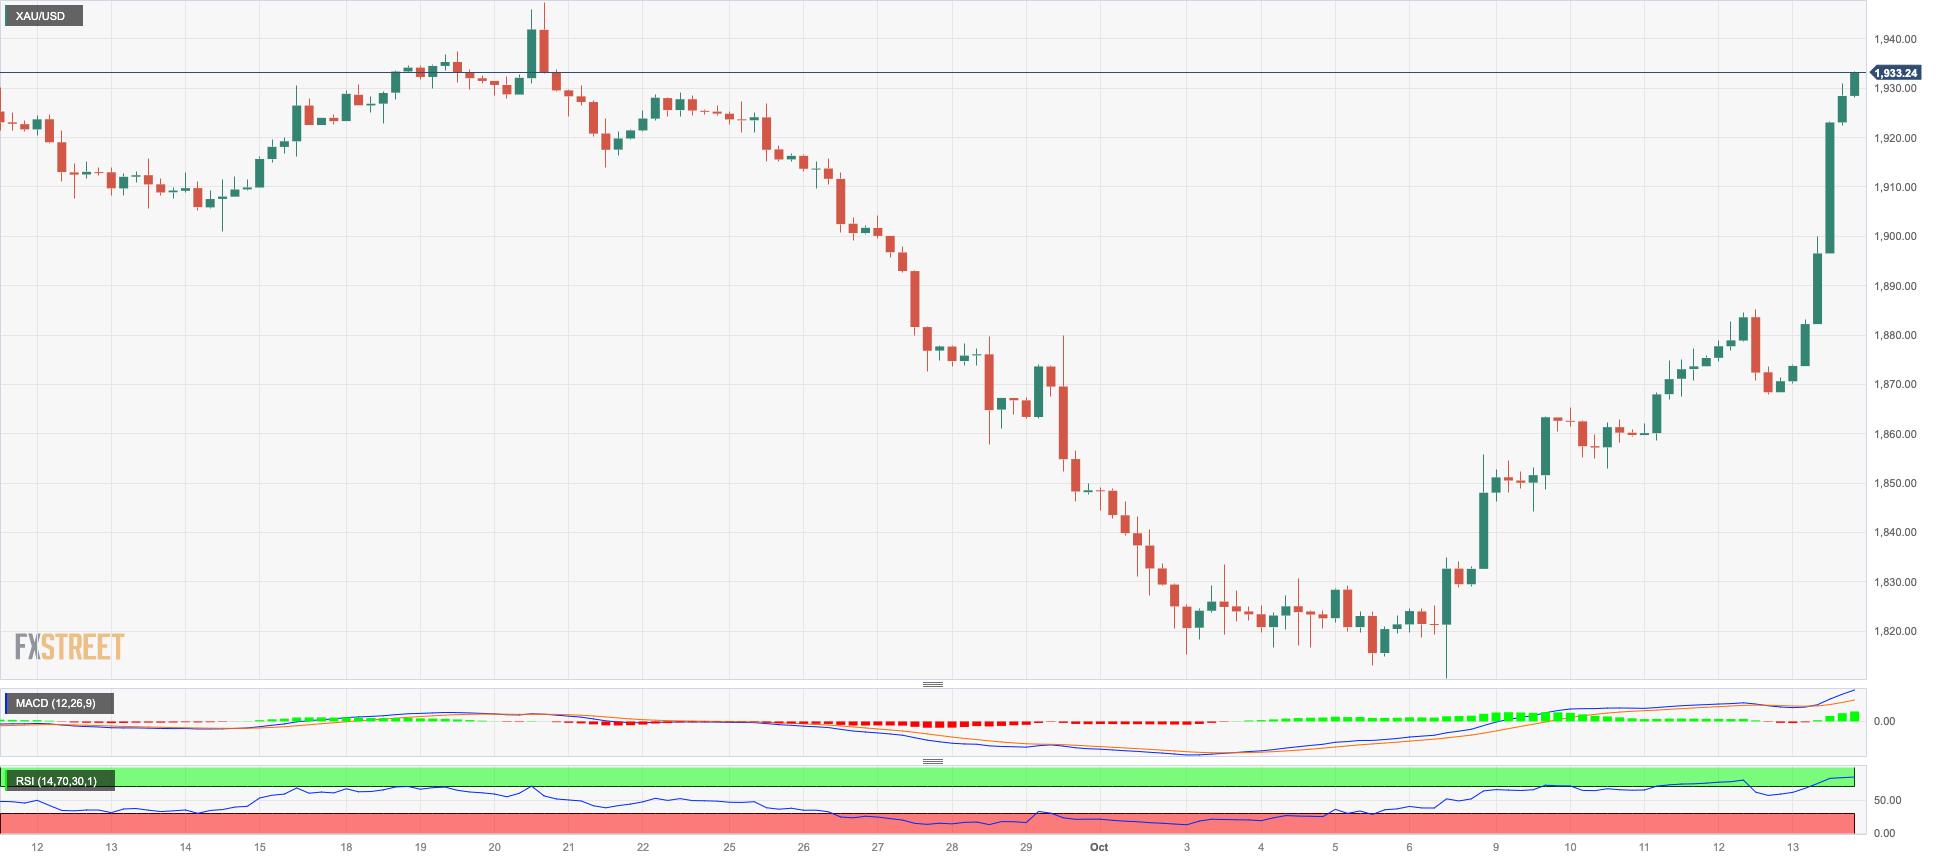
Prices of gold rose sharply and revisited the $1930 region, or three-week highs, at the end of the week. Furthermore, the daily gains in the precious metal were the second most significant since mid-March.
In fact, the yellow metal saw its buying interest strongly reinvigorated following escalating effervescence in the Middle East, as the Israel-Hamas conflict is expected to keep deteriorating in the next few days.
Surprisingly, the sharp advance in bullion came in contrast with another positive session in the greenback, while declining US yields have also bolstered the upside bias in the metal.
A further climb in the gold price should now retarget the weekly high at $1947 (September 20) seconded by the September top at $1953 (September 1). If gold breaks above the latter, it might aim for the July peak of $1987 (July 20), which is just below the important $2000 threshold. The 2023 high of $2067 (May 4) may be read from here, followed by the 2022 top of $2070 (March 8) and the all-time peak of $2075 (August 7, 2020). Bears, in the meantime, should retarget the October low of $1810 (October 6) ahead of the 2023 bottom of $1804 (February 28) and the important contention area of $1800.
Resistance levels: $1930 $1947 $1972 (4H chart)
Support levels: $1898 $1867 $1853 (4H chart)
CRUDE WTI
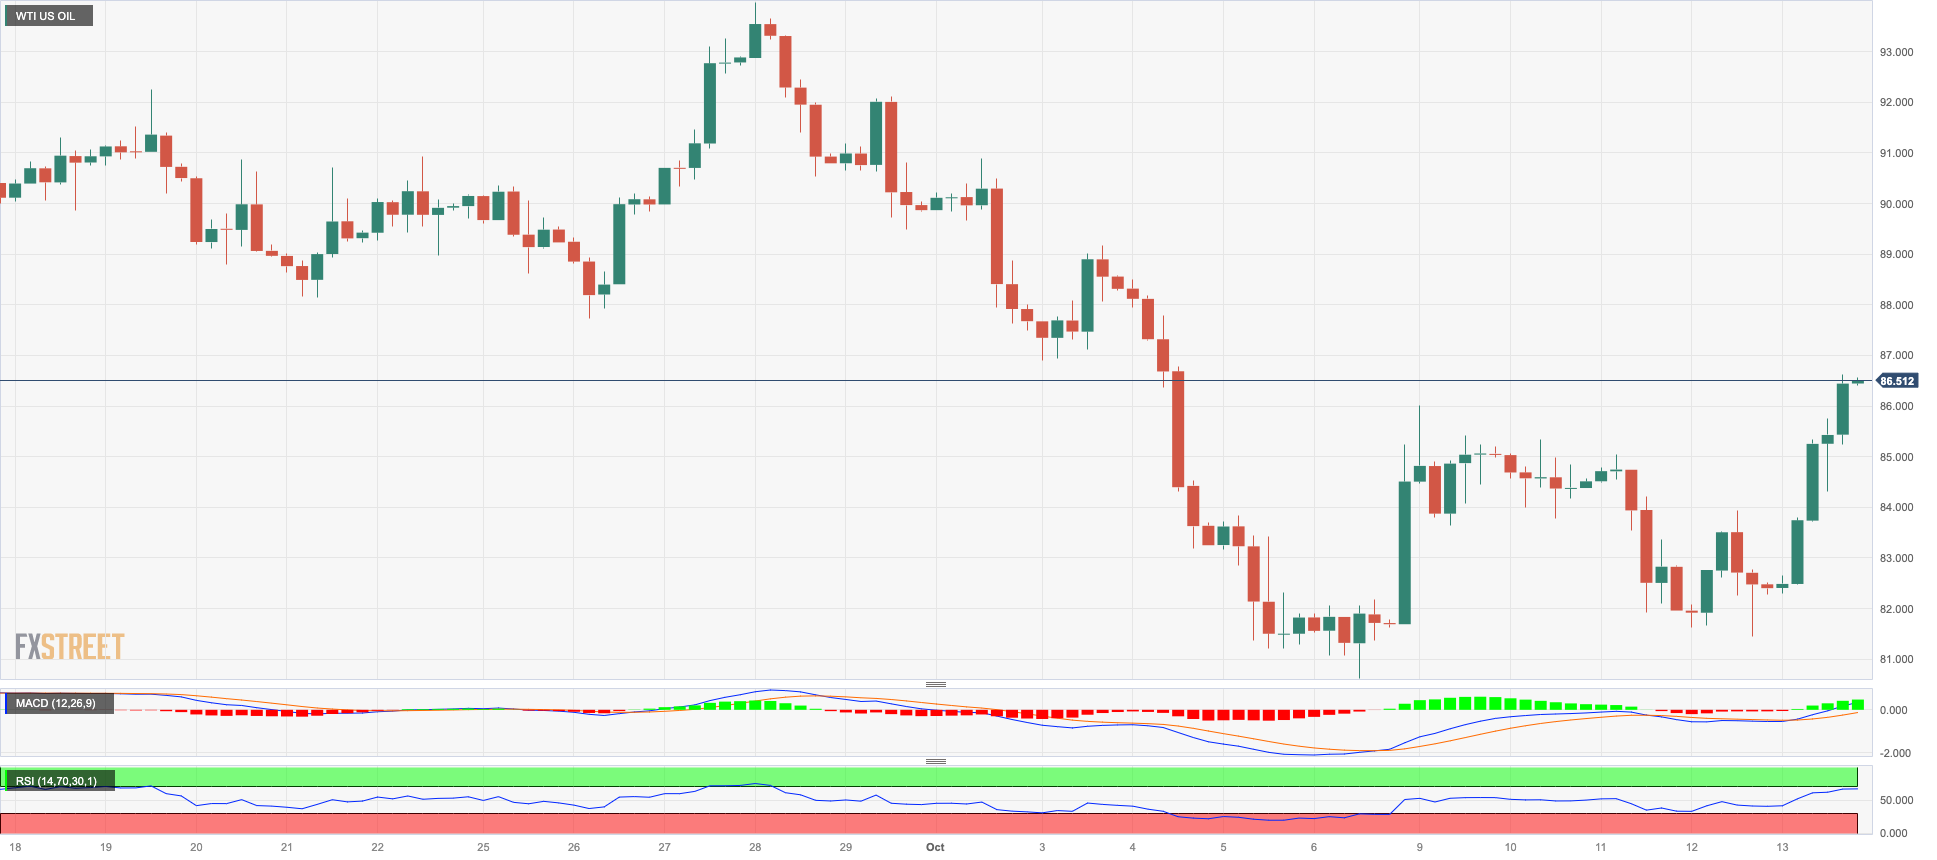
WTI prices advanced to multi-day highs beyond the $87.00 mark per barrel at the end of the week, up more than 5% for the day.
Increasing concerns over the probability that the Israel-Hamas conflict could extend further in the region and affect crude oil supply were behind Friday’s strong advance.
Another driver of the intense uptick in crude oil prices was the likelihood that the US could intensify its sanctions on Iranian oil and Russian exports, which should eventually prop up the tight supply narrative and hence higher prices.
In the calendar, driller Baker Hughes reported an increase of 4 oil rig count in the week to October 13, taking the US total oil rig count to 501.
WTI prices may retest the October low of $81.56 (October 6) before reaching the important $80.00 mark and the August low of $77.64 (August 24), which looks to be supported by the 200-day SMA at $77.68. If the latter is breached, WTI may fall to the weekly low of $73.89 (July 17), the June low of $66.85 (June 12), and the 2023 low of $63.61 (May 4), all of which are ahead of the critical $60.00 per barrel line. On the plus side, a break above the 2023 high of $94.99 (September 28) might revive a challenge to the weekly top of $97.65 (August 30, 2022), just before the psychological $100.00 mark per barrel.
Resistance levels: $87.79 $90.23 $93.06 (4H chart)
Support levels: $82.75 $81.47 $79.31 (4H chart)
GER40
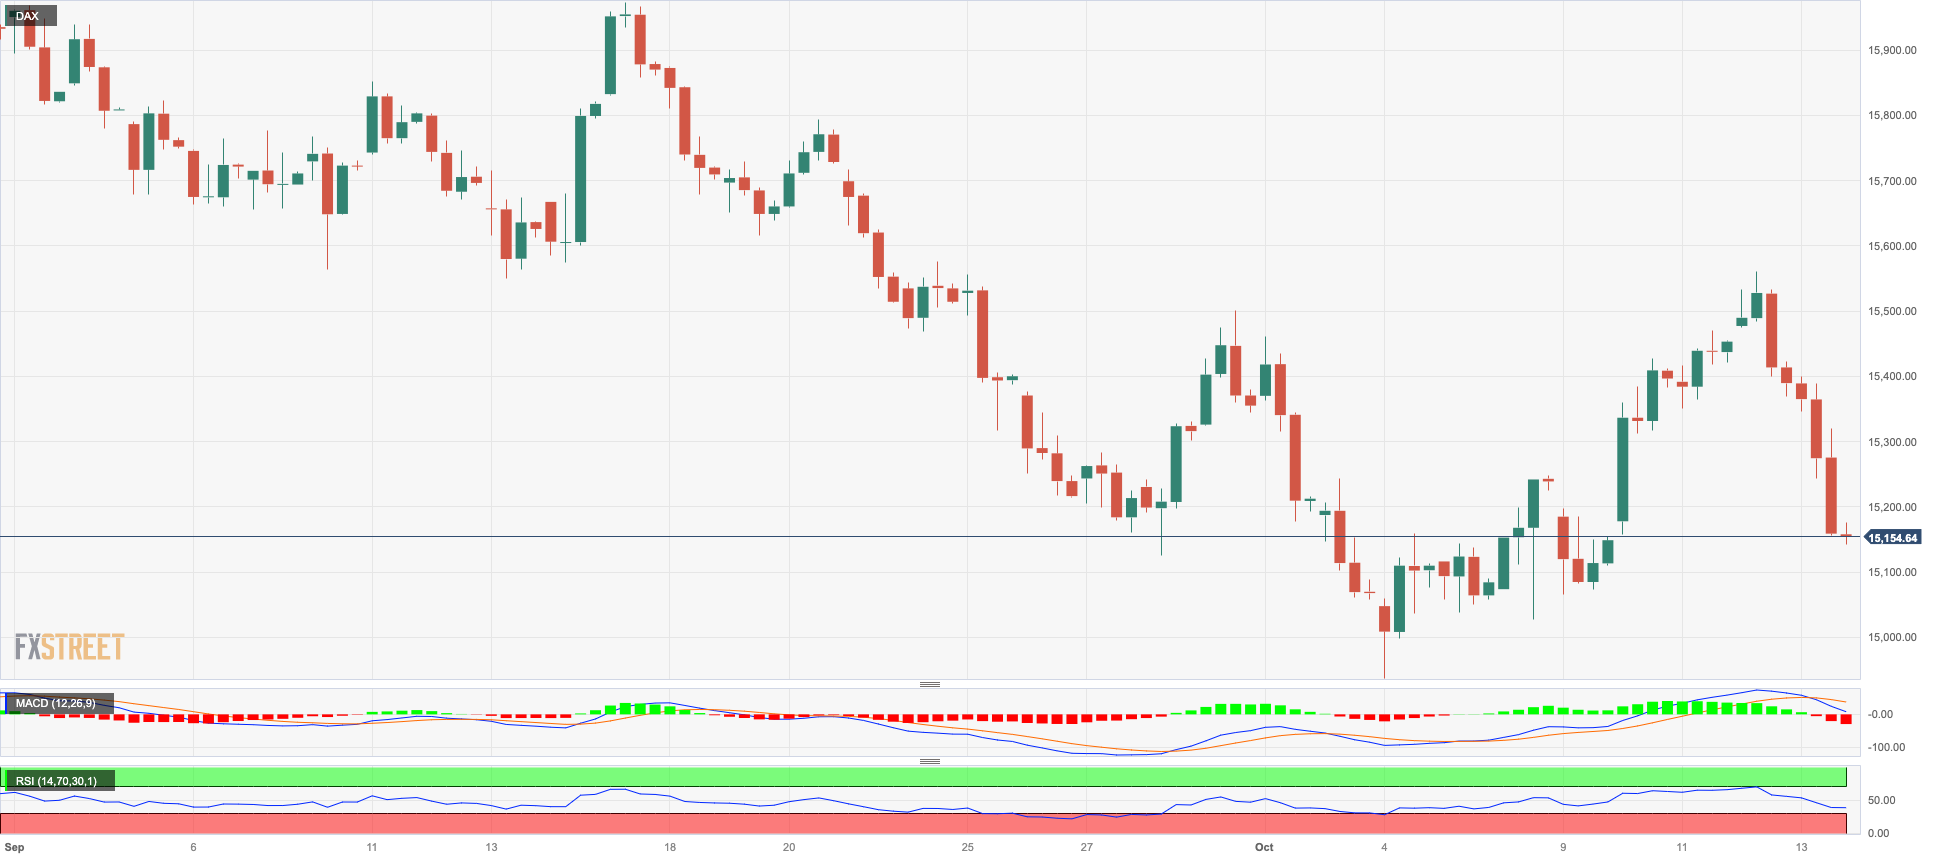
German stocks accelerated their decline in the latter part of the week and forced the benchmark DAX40 to retreat to multi-session lows around the 15200 zone on Friday.
Rising risk aversion favoured the safe haven demand, keeping investors’ sentiment depressed and prices on the back foot as market participants continued to assess the Israel-Hamas conflict as well as the gloomy economic outlook for the old continent.
Back to the monetary policy front, the ECB's policymakers' continued dovish narrative reinforced the idea that the central bank's tightening effort may have come to a halt for the time being despite still elevated inflation and the loss of momentum of economic activity.
Bulls continue to target the key 200-day SMA at 15640, ahead of the September high of 15989 (September 15), and weekly top of 16042 (August 31) and 16060 (August 10). A break above this level may prompt the DAX40 in a retest of the all-time peak of 16528 (July 31). If sellers take control, the index may retarget the October low of 14948 (October 4) before going on to the March low of 14458 (March 20) and the December 2022 low of 13791 (December 20), which precedes the 2022 low of 11862 (September 28). The daily RSI eased to the vicinity of 41.
Best Performers: E.ON SE, Symrise AG, Heidelbergcement
Worst Performers: Sartorius AG VZO, Siemens Energy AG, Merck
Resistance levels: 15575 15768 15989 (4H chart)
Support levels: 15178 14948 14809 (4H chart)
NASDAQ
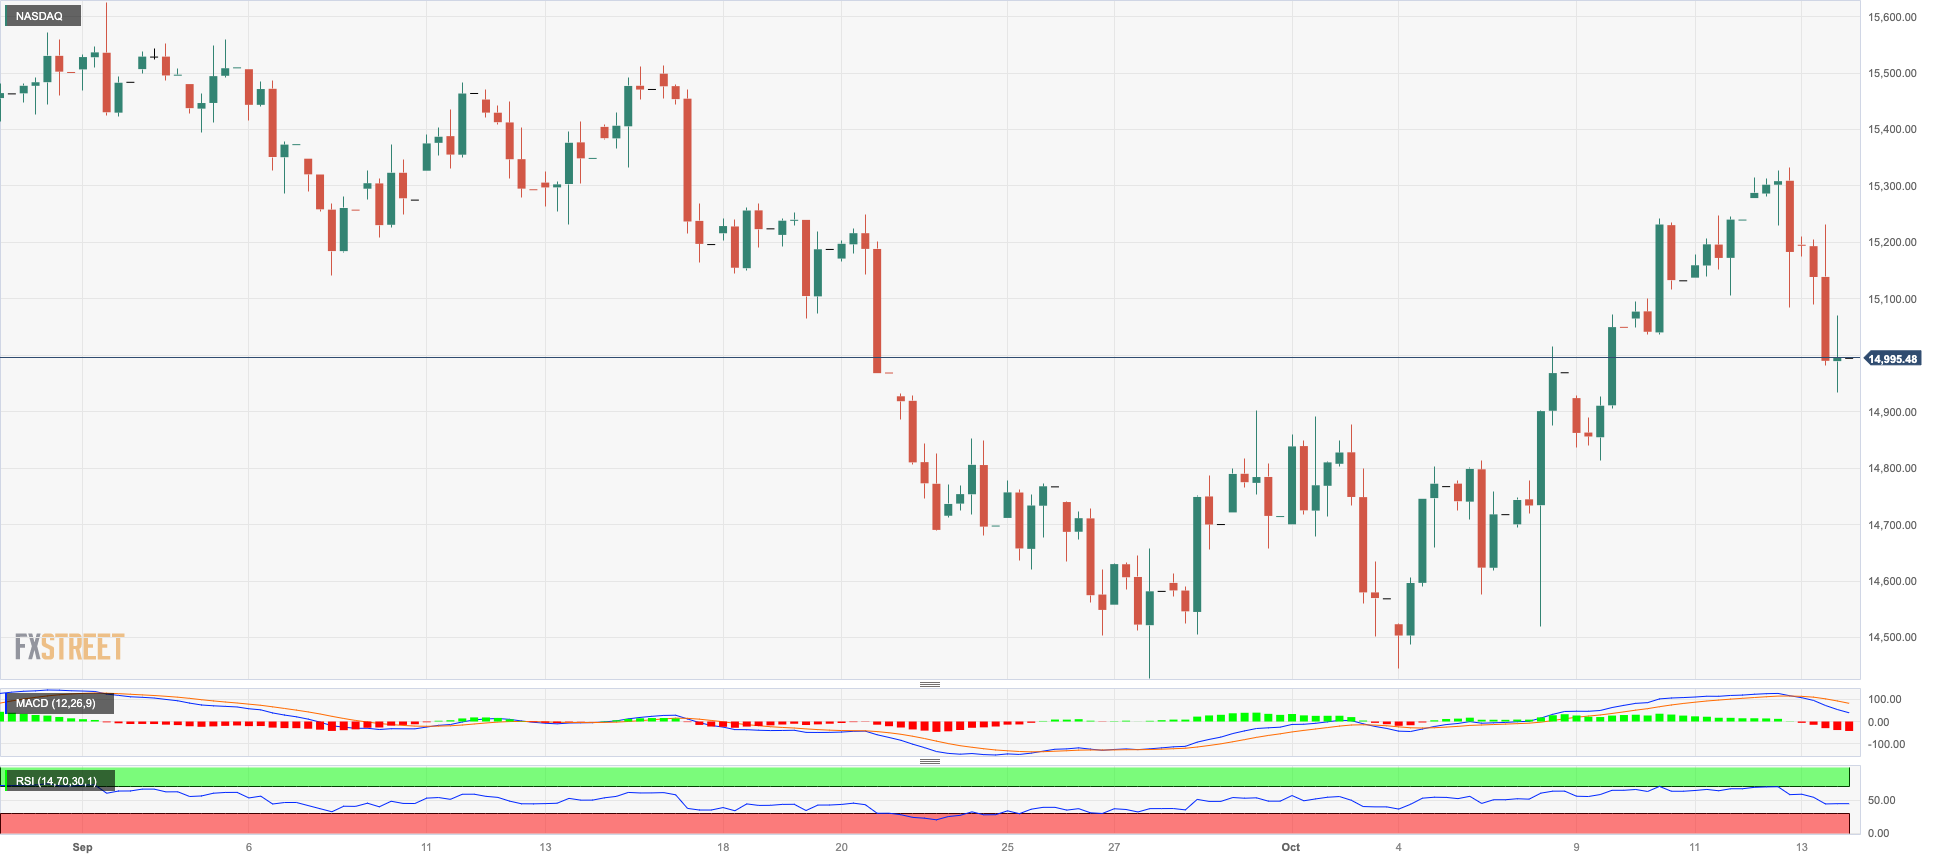
US tech equities measured by the Nasdaq 100 added to Thursday’s losses and dropped to four-day lows near the key 15000 support on Friday.
Indeed, the sharp sell-off in the tech sector, in combination with the stronger dollar and the persevering risk-aversion context, all weighed on the reference index and dragged it lower.
A deeper pullback may prompt the Nasdaq 100 to revisit the September low of 14432 (September 27) ahead of the weekly low of 14283 (June 7), which comes before the 200-day SMA at 13743 and the April low of 12724 (April 25). After breaking through this zone, the index may target the March low of 11695 (March 13) before aiming for the 2023 bottom of 10696 (January 6). Just the opposite, further gains might propel the Nasdaq 100 to its October high of 15333 (October 12). The breakout from the latter might lead to the September top of 15618 (September 1), which would be ahead of the weekly peak of 15803 (July 31) and the 2023 high of 15932 (July 19), all of which would be ahead of the round 16000 mark. The daily RSI slipped back to the 50 threshold.
Top Gainers: Sirius XM, Intuitive Surgical, Diamondback
Top Losers: The Trade Desk, Old Dominion Freight Line, ON Semiconductor
Resistance levels: 15333 15512 15618 (4H chart)
Support levels: 14432 14283 13520 (4H chart)
DOW JONES
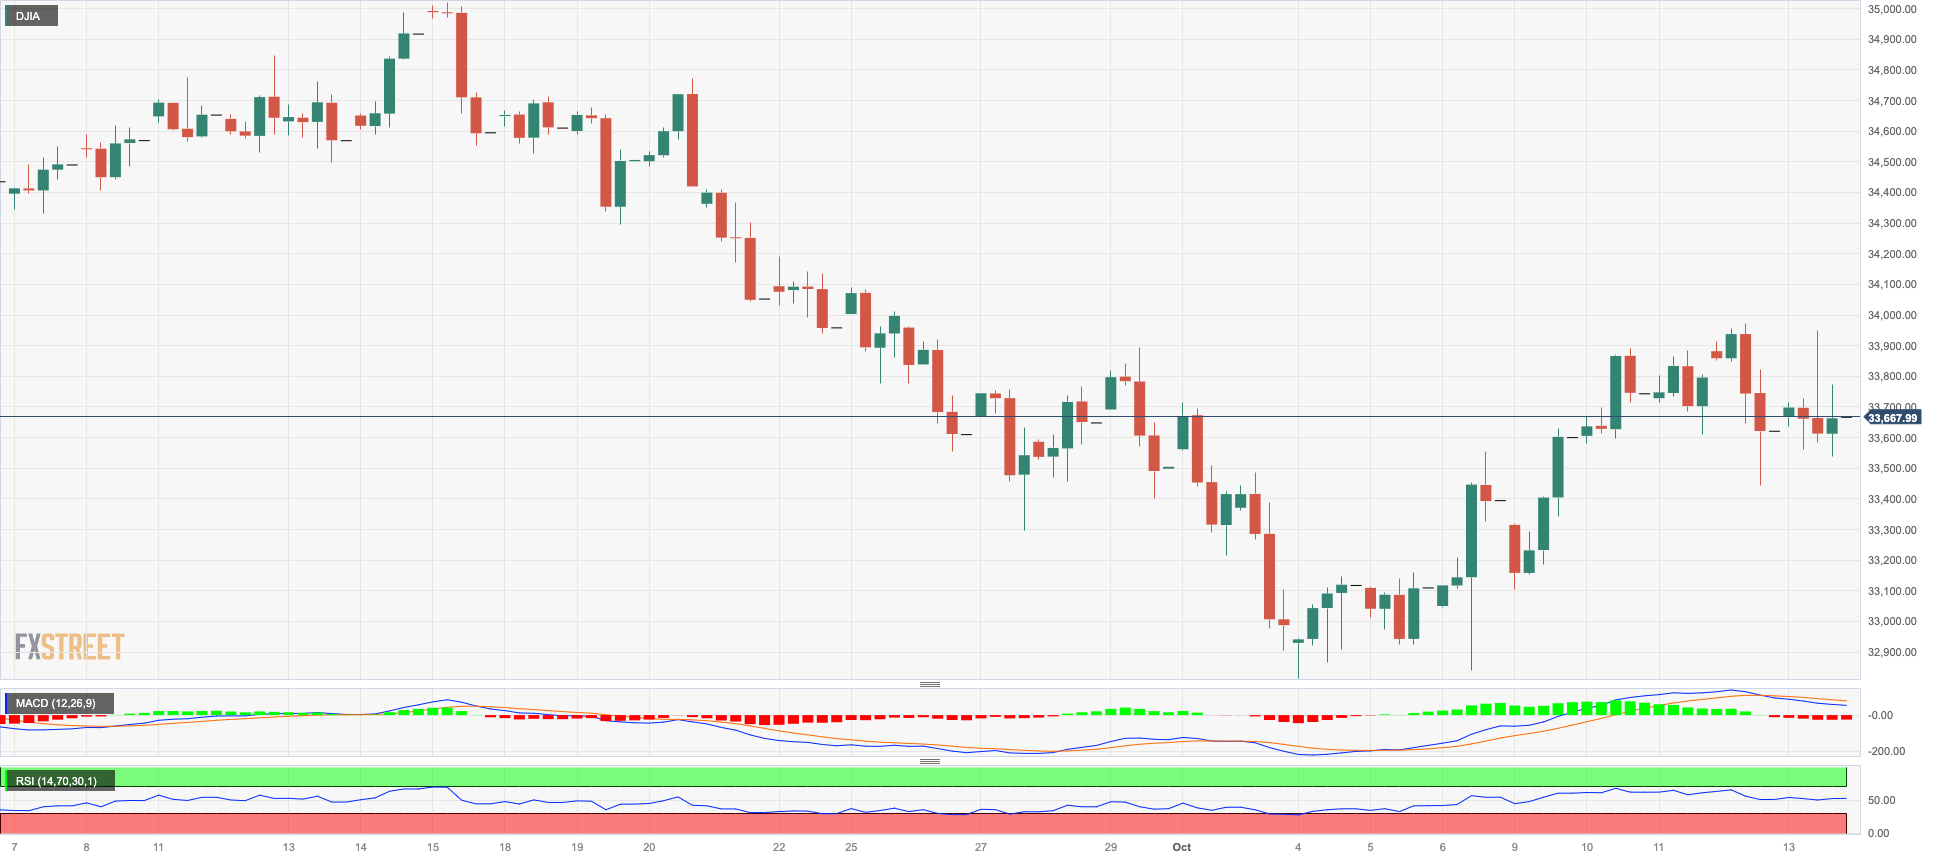
The US blue-chip index Dow Jones ended the week with humble gains near the 33700 region, partially reversing Thursday’s marked pullback.
The uptick in US equities came despite the persistent risk aversion stemming from geopolitical tensions in the Middle East as well as the intense demand for bonds amidst investors’ flight-to-safety.
On the whole, the Dow Jones gained 0.12% to 33670, the S&P500 retreated 0.50% to 4327, and the tech-benchmark Nasdaq Composite dropped 1.23% to 13407.
If the Dow Jones maintains its upward momentum, it could attack the 100-day and 55-day SMAs at 34283 and 34439, respectively, before the September high of 34977 (September 14). North of that is the weekly top at 35070 (August 31) and the 2023 peak at 35679 (August 1). If the latter is exceeded, the 2022 high of 35824 (February 9) could be reached before the all-time top of 36952 (January 5, 2022). If the index falls below the October low of 32873 (October 4), it could slip back to the May low of 32586 (May 25) before sliding to the 2023 low of 31429 (March 15). The day-to-day RSI looked stable around 45.
Top Performers: UnitedHealth, Travelers, Chevron
Worst Performers: Walgreen Boots, Boeing, Intel
Resistance levels: 33957 34285 34977 (4H chart)
Support levels: 32846 32586 31805 (4H chart)
MACROECONOMIC EVENTS


