
- Contact Us:
-

-

-

-


Daily Market Updates
17 Oct 2023
USDJPY
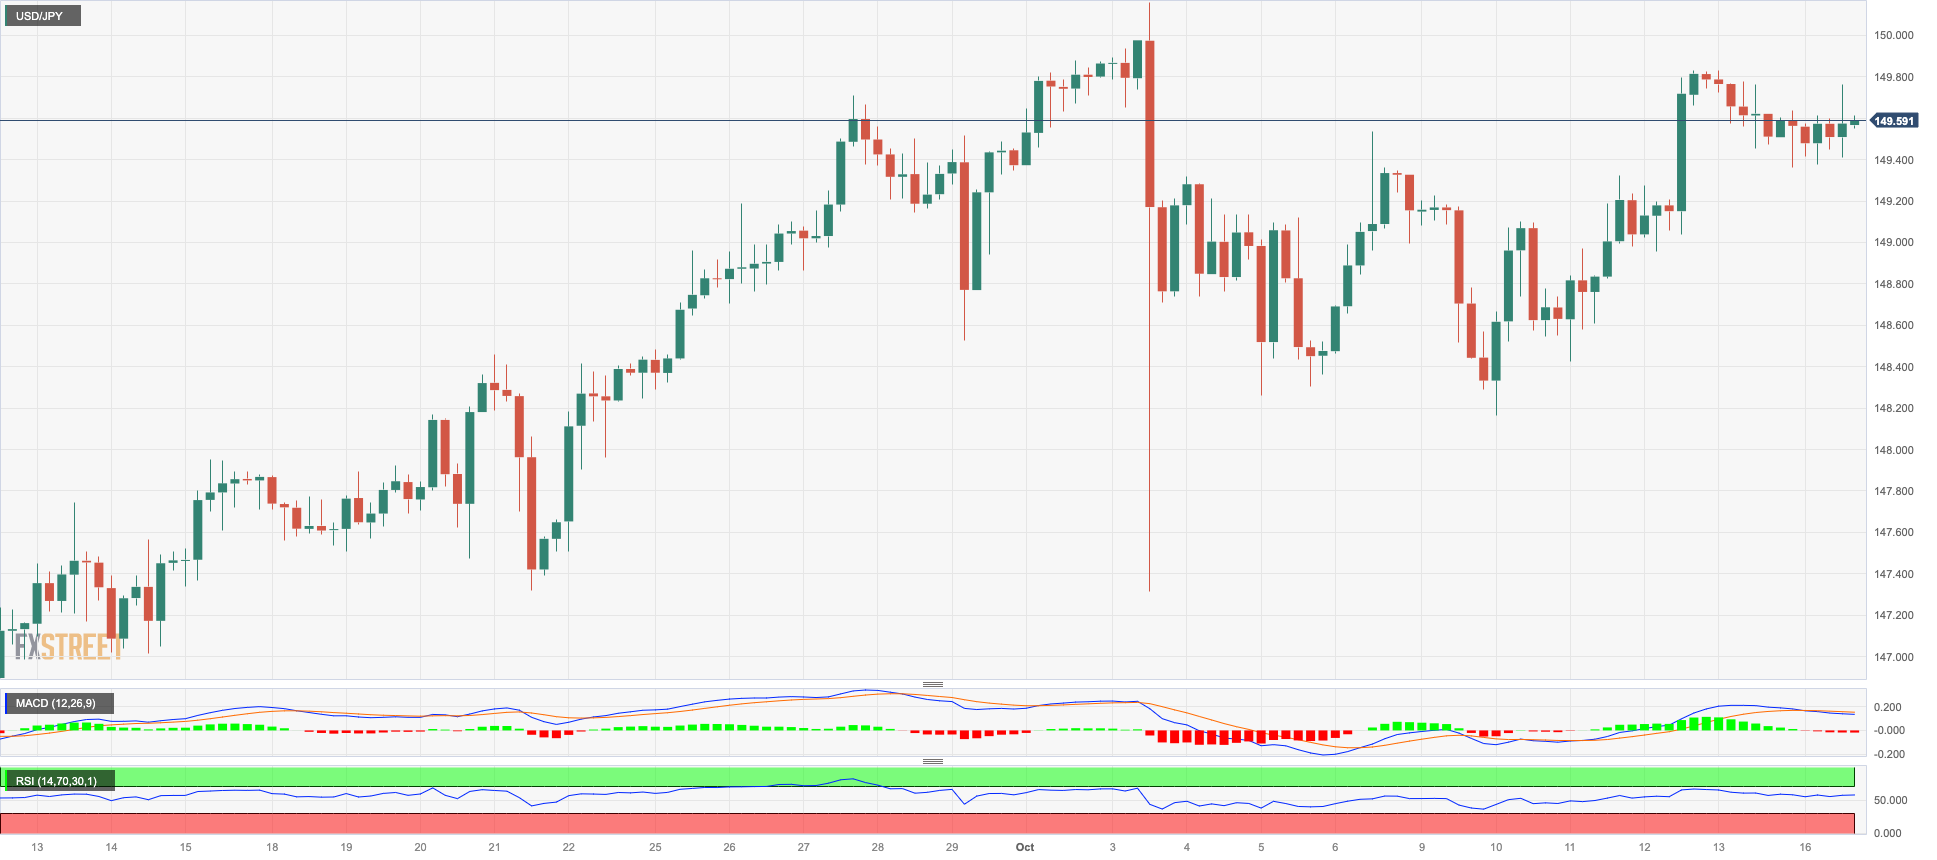
A vacillating price action left USD/JPY pretty much unchanged in the mid-149.00s at the beginning of the week.
Indeed, the pair’s performance came amidst the knee-jerk in the greenback, the resumption of the upside momentum in US and Japanese bond yields, and rising geopolitical concerns stemming from the Middle East.
Somehow limiting the occasional downside in the yen appeared comments from Top Currency Diplomat Kanda, who expressed concerns about the potential adverse effects of rate hikes to combat inflation. He mentioned that appropriate action will be taken in the forex market when necessary. Kanda also stated that intervention is one option that can be considered when excessive FX movements are observed. Additionally, he mentioned that rate hikes are another option that can be considered in response to excessive forex movements.
In Japan, final readings saw Industrial Production contract 4.4% in the year to August and Capacity Utilization expand 0.5% vs. the previous month.
If USD/JPY breaks over the 2023 high of 150.16 (October 3), it may attempt to test the 2022 top of 151.94 (October 21). On the contrary, the 55-day SMA at 146.74 should provide brief support before the weekly bottom at 145.89 (September 11). The loss of the latter permits a further regression to the September low of 144.43 (September 1), which is above the intermediate 100-day SMA at 144.30 and the August low of 141.50 (August 7). The 200-day SMA is at 138.93 and comes prior to the July low of 137.23 (July 14). The daily RSI looked stable around 59.
Resistance levels: 149.82 150.16 151.94 (4H chart)
Support levels: 149.30 148.16 147.27 (4H chart)
GBPUSD
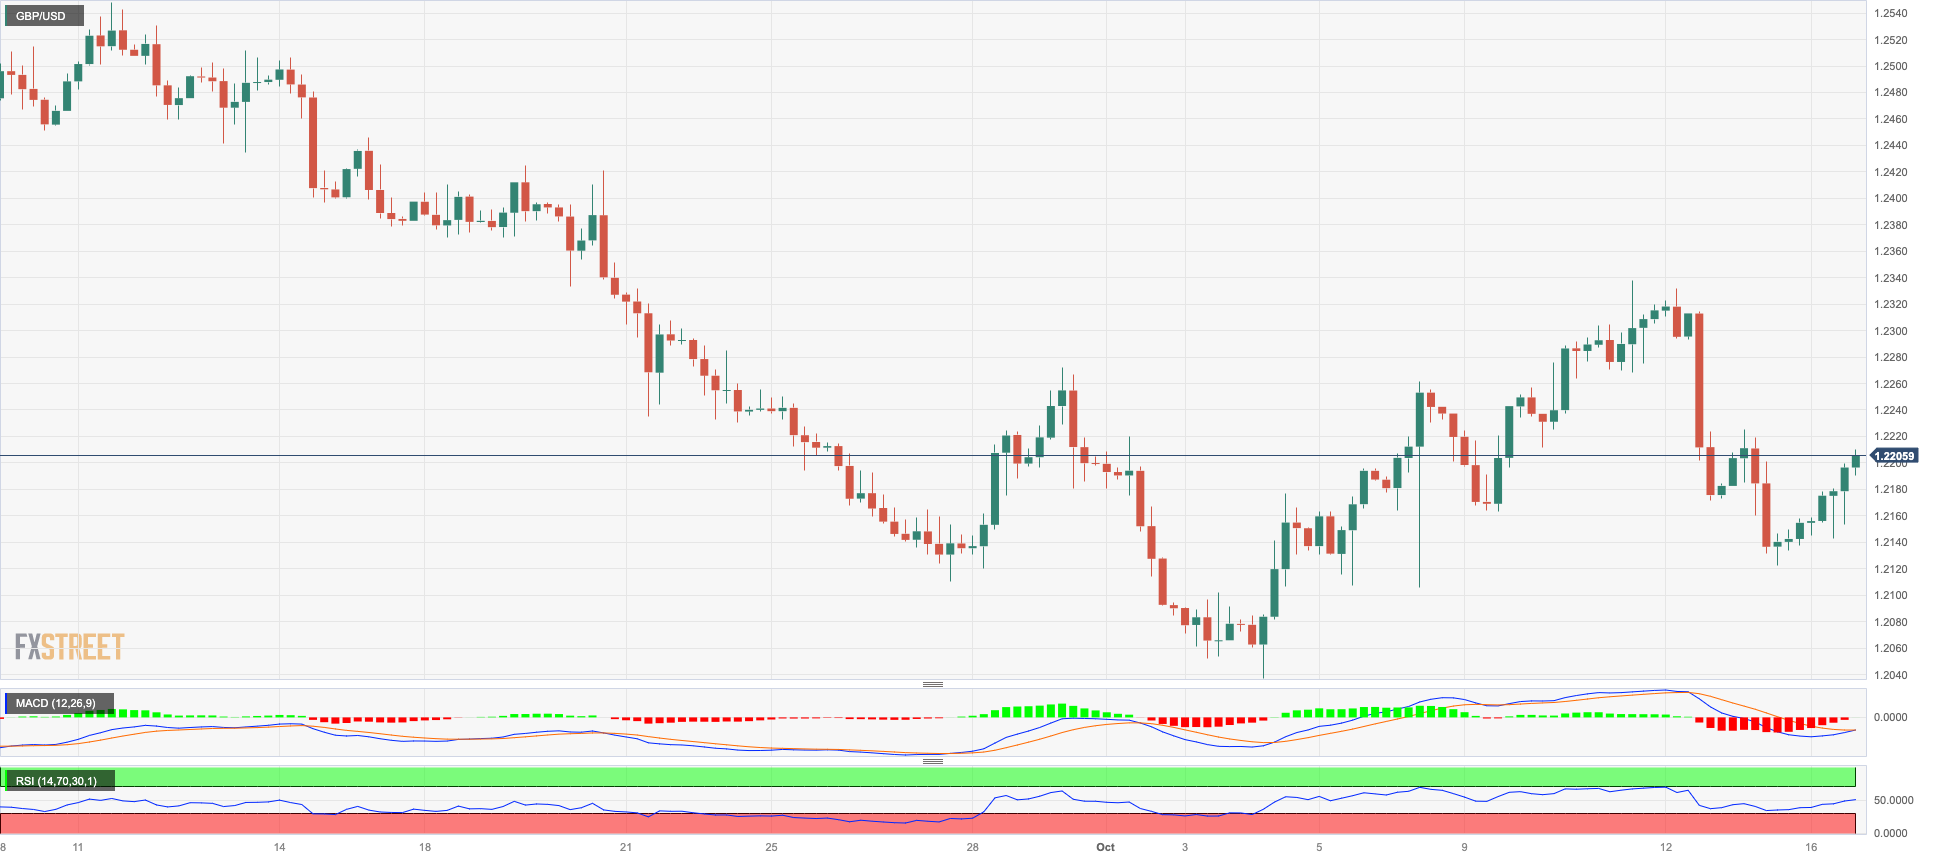
In line with its risk-related peers, the British pound managed to regain the smile, set aside two daily declines in a row, and push GBP/USD to the proximity of 1.2280, where the pair met some initial resistance at the beginning of the week.
The daily advance in Cable came in response to renewed weakness in the greenback amidst some improvement in the risk complex, despite the fact that the geopolitical front threatened to deteriorate further.
From the BoE, MPC member H. Pill stated that falling inflation is insufficient to assert that the job is complete, and he added that the BoE has made significant progress on interest rates.
There were no data releases scheduled across the Channel on Monday.
Extra losses in the GBP/USD may potentially take the pair down to the October low of 1.2037 (October 3), ahead of the crucial round milestone of 1.2000 and the 2023 bottom of 1.1802 (March 8). On the upside, Cable faces the October high of 1.2337 (October 11), the 200-day SMA at 1.2442, and the intermediate 55-day SMA at 1.2477. The weekly top at 1.2548 (September 11) is followed by the transitory 100-day SMA at 1.2596, and weekly peaks at 1.2746 (August 30), 1.2818 (August 10), and 1.2995 (July 27), all of which precede the crucial 1.3000 threshold. The day-to-day RSI rose above 39.
Resistance levels: 1.2225 1.2337 1.2421 (4H chart)
Support levels: 1.2122 1.2105 1.2037 (4H chart)
AUDUSD
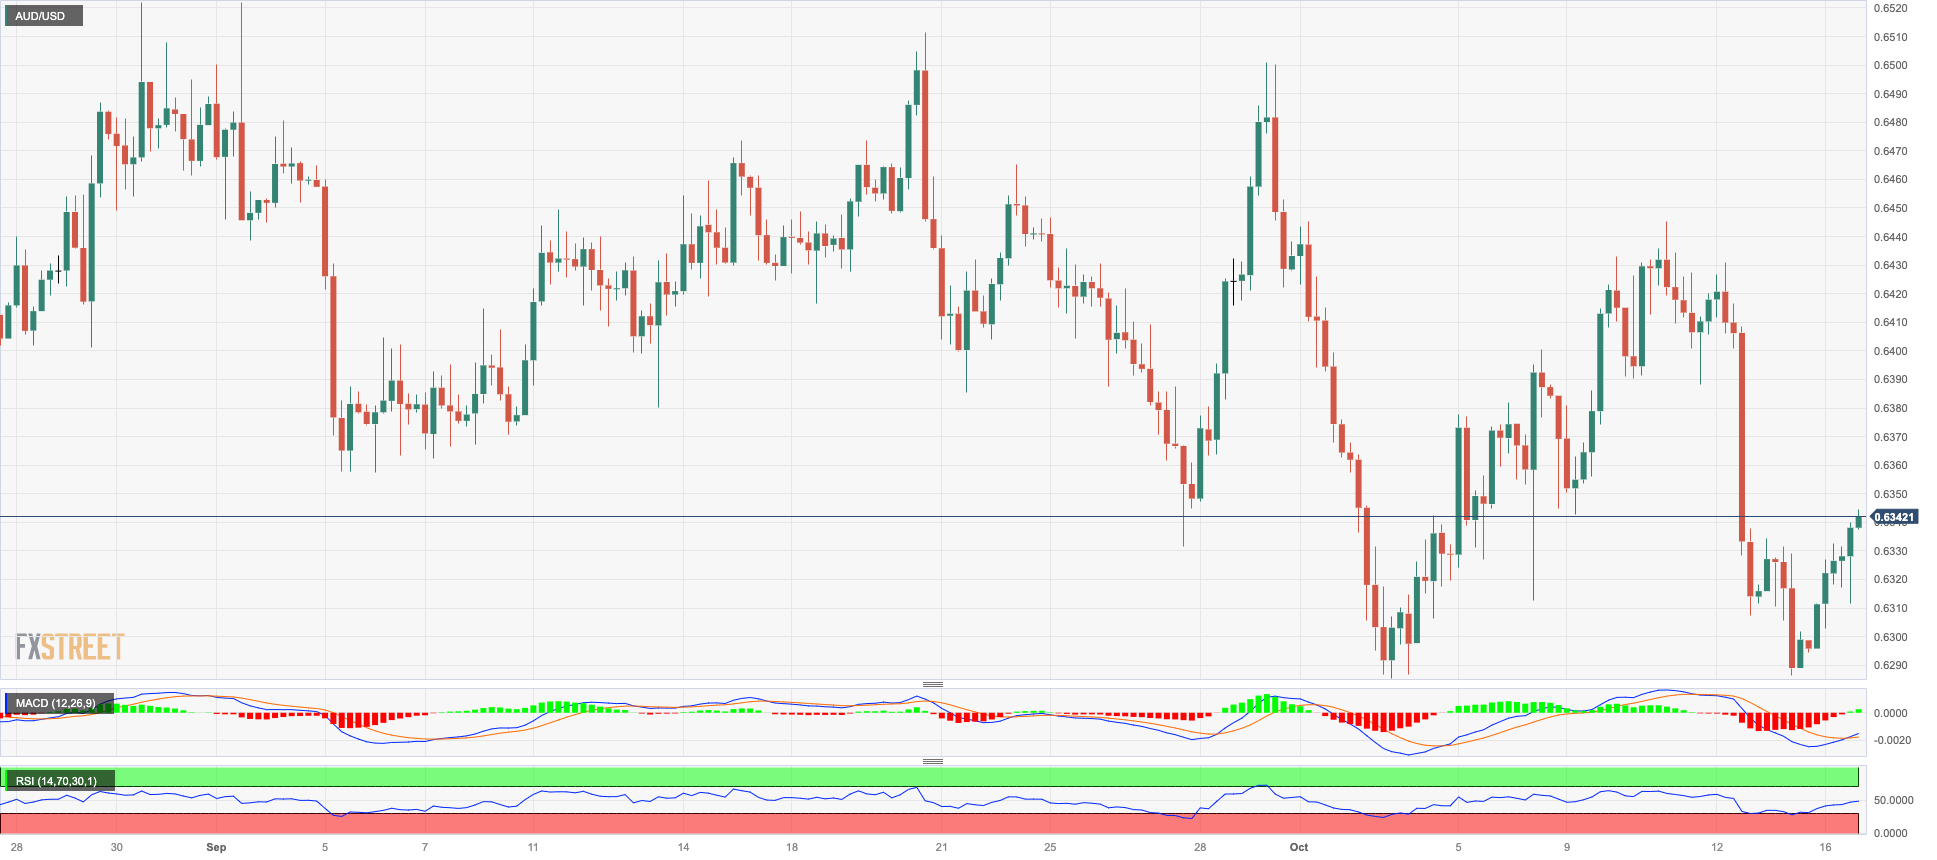
The return of appetite for risky assets brought some relief to the Aussie dollar and prompted AUD/USD to regain some optimism following three consecutive sessions of losses on Monday.
Indeed, fresh selling pressure in the greenback helped the high-beta currencies and the risk-linked galaxy in general, sponsoring a decent bounce in the pair off the area of yearly lows around 0.6280 seen in past sessions.
There were no data releases scheduled in Oz, while investors are expected to closely watch Tuesday’s publication of the RBA Minutes.
The 2023 bottom at 0.6285 (October 3) is next on the downside for AUD/USD, followed by the November 2022 low at 0.6272 (November 7) and the 2022 low at 0.6179 (October 13). In contrast, the pair's weekly high of 0.6522 (August 30) is immediately on the upside, followed by the pair's temporary 100-day SMA at 0.6560 and another weekly top of 0.6616 (August 10), ahead of the 200-day SMA at 0.6664. A further gain might take the pair to its July peak of 0.6894 (July 14), followed by the June high of 0.6899 (June 16), and the key 0.7000 mark. Up from here aligns the weekly top of 0.7029 (February 14), prior to the 2023 peak of 0.7157 (February 15). The everyday RSI ticked higher past the 41 level.
Resistance levels: 0.6406 0.6445 0.6501 (4H chart)
Support levels: 0.6285 0.6272 0.6210 (4H chart)
GOLD
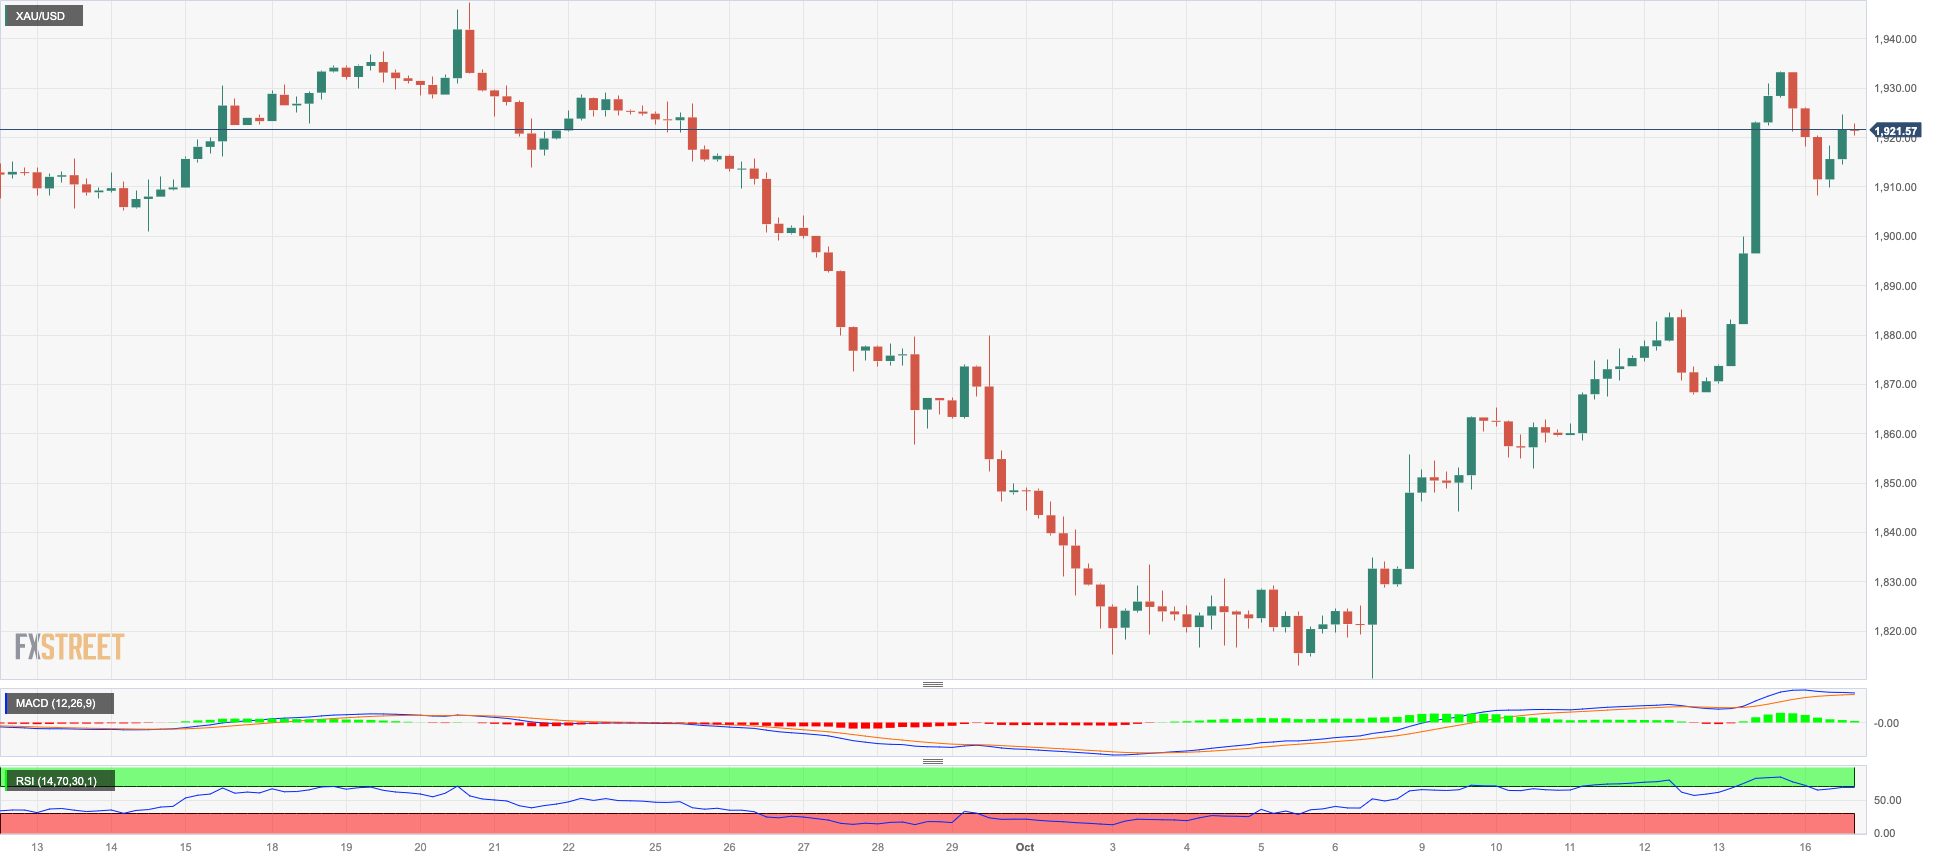
Gold prices corrected slightly lower from recent peaks in the $1930 zone per troy ounce at the beginning of the week, an area also coincident with the key 200-day SMA.
That said, the precious metal saw Friday’s strong uptick modestly trimmed amidst higher US yields across different maturities, rising cautiousness in light of the Israel-Hamas conflict, and despite the correction in the greenback.
A further rise in the gold price should now aim for the weekly high of $1947 (September 20), followed by the September top of $1953 (September 1). If gold clears the latter, it might aim for the July peak of $1987 (July 20), which is just below the crucial $2000 mark. From here, the 2023 high of $2067 (May 4) may be read, followed by the 2022 top of $2070 (March 8) and the all-time peak of $2075 (August 7, 2020). Just the opposite, there is an immediate contention at the October low of $1810 (October 6) prior to the 2023 bottom of $1804 (February 28) and just before the key contention region of $1800.
Resistance levels: $1932 $1947 $1972 (4H chart)
Support levels: $1897 $1867 $1853 (4H chart)
CRUDE WTI
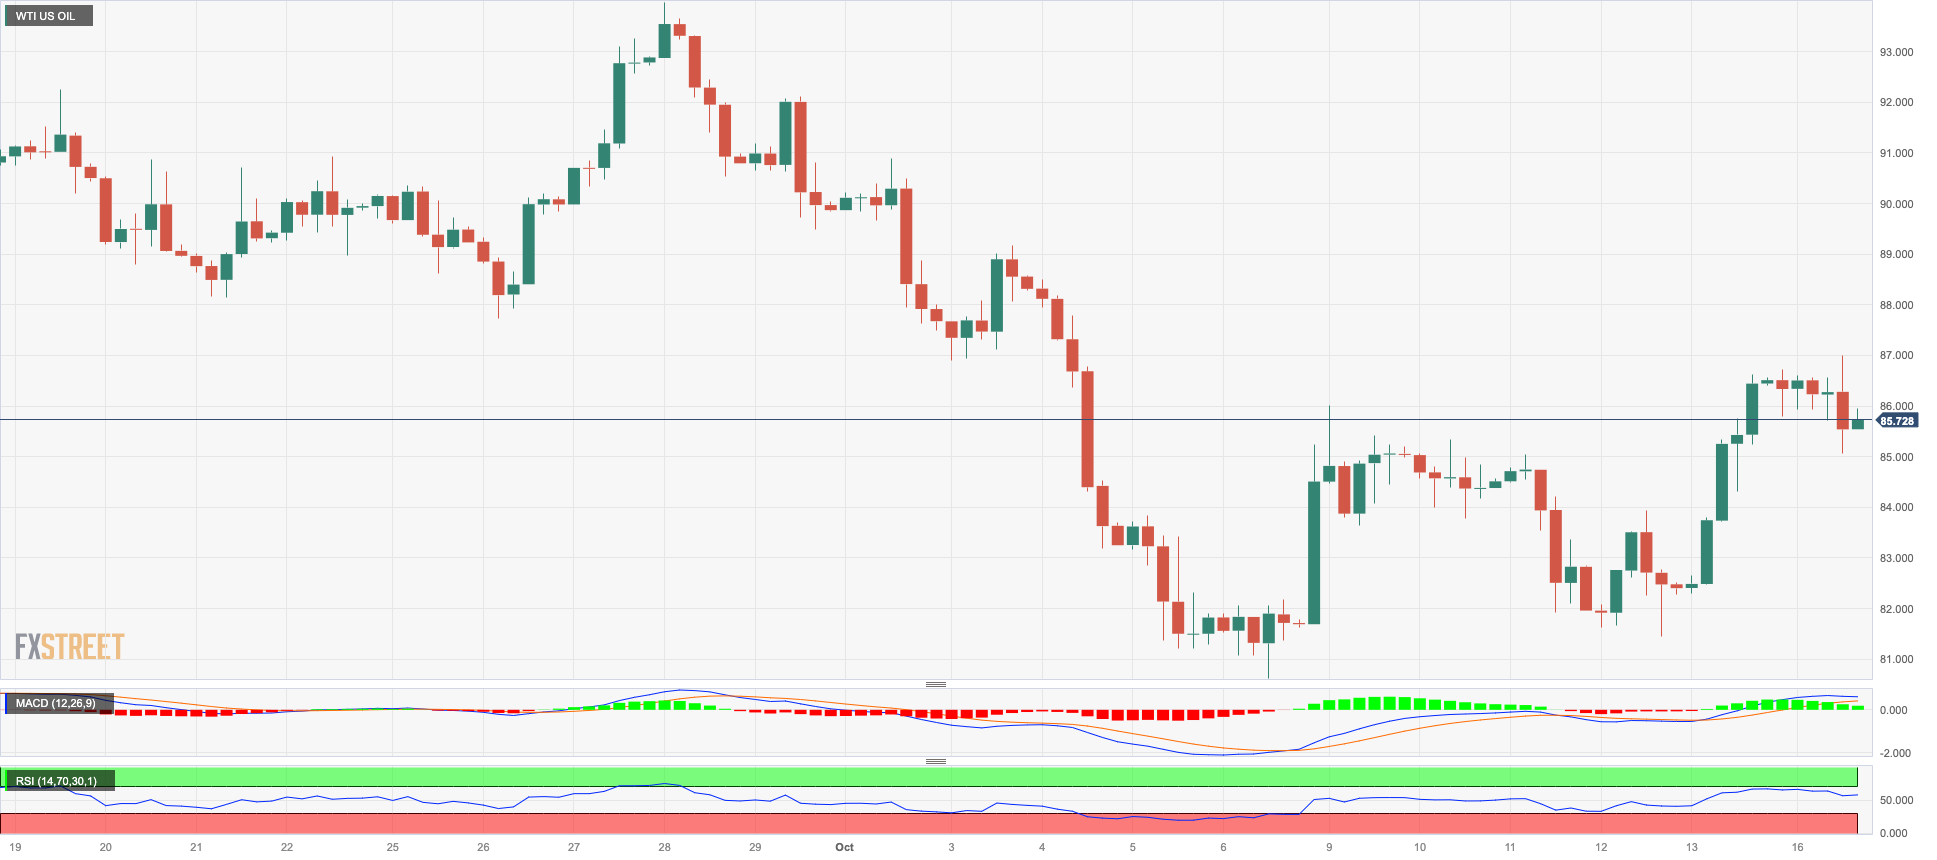
Prices of WTI came under pressure soon after hitting new multi-day highs past the $88.00 mark per barrel on Monday.
Indeed, traders seem to have cashed out part of the strong gains recorded in the latter part of last week while closely monitoring developments in the Middle East, as rising risks of an extension of the conflict could shift attention to the impact on crude oil supply.
On the calendar, the API and the EIA will report on US crude oil inventories in the week to October 13, while Chinese GDP figures will also grab traders’ attention later in the week.
Immediately to the upside for WTI aligns the weekly high of $88.29 (October 16) prior to the 2023 top of $94.99 (September 28) and the weekly peak of $97.65 (August 30, 2022), all preceding the psychological $100.00 mark per barrel. On the flip side, further losses may retest the October low of $81.56 (October 6) before hitting the crucial $80.00 level and the August low of $77.64 (August 24), which appears to be supported by the 200-day SMA at $77.74. If the latter is breached, WTI may fall to the weekly low of $73.89 (July 17), the June low of $66.85 (June 12), and the 2023 low of $63.61 (May 4), all of which are ahead of the key $60.00 mark per barrel.
Resistance levels: $88.29 $90.23 $93.06 (4H chart)
Support levels: $82.75 $81.47 $79.31 (4H chart)
GER40
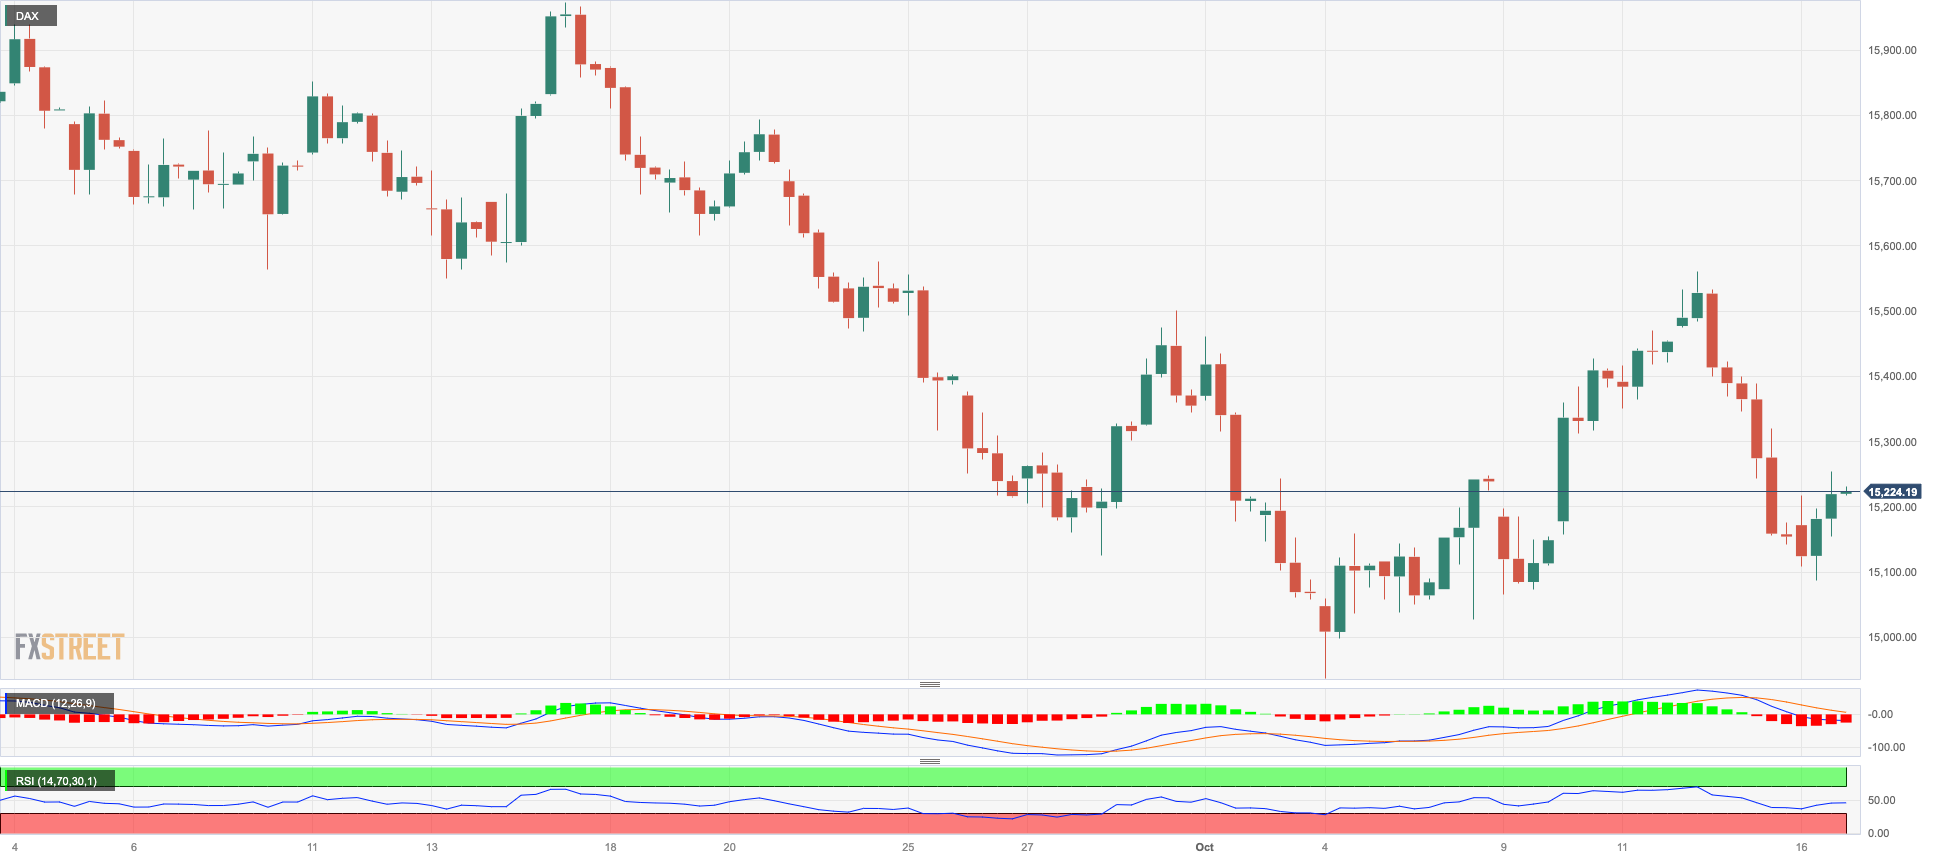
Germany's reference DAX40 index showed signs of recovery as it rebounded from two consecutive daily pullbacks. The index closed Monday's session with modest gains, reaching around the 15200 region.
In the wider European markets, the new trading week started cautiously higher, with market participants also keeping a close eye on geopolitical developments arising from the Israel-Hamas conflict.
The renewed interest in riskier assets was further supported by hopes of a positive corporate earnings season, while the decline in the US dollar contributed to the upward trend in the markets.
Shifting focus to monetary policy, the continued dovish stance of the ECB policymakers reinforced the perception that the central bank's tightening measures may have paused for the time being. This is despite the presence of elevated inflation levels and a slowdown in economic activity.
Bulls are still aiming for the 200-day SMA at 15643, ahead of the September high of 15989 (September 15), as well as the weekly tops of 16042 (August 31) and 16060 (August 10). A break above this level might send the DAX40 back to its all-time peak of 16528 (July 31). If sellers regain control, the index may retarget the October low of 14948 (October 4) before moving on to the March low of 14458 (March 20) and the December 2022 low of 13791 (December 20), which comes before the 2022 low of 11862 (September 28). The daily RSI rose marginally above 43.
Best Performers: Commerzbank, Zalando SE, Deutsche Bank AG
Worst Performers: Sartorius AG VZO, Covestro, Fresenius SE
Resistance levels: 15575 15742 15989 (4H chart)
Support levels: 15178 14948 14809 (4H chart)
NASDAQ
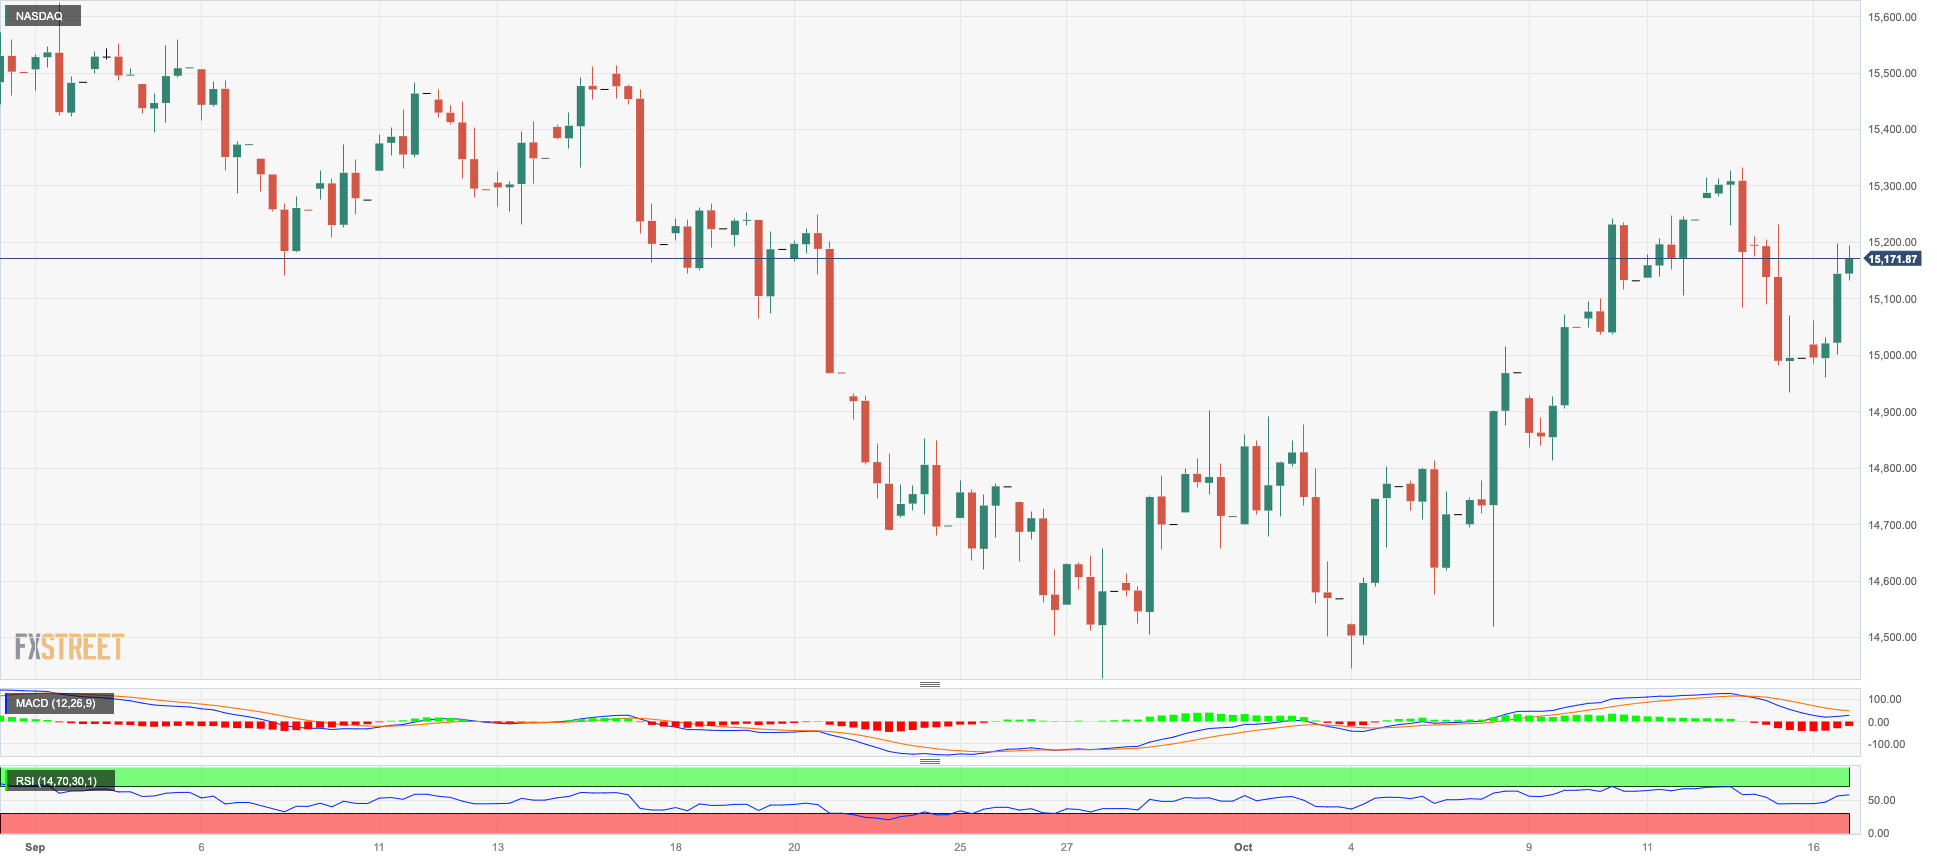
Amidst the widespread positive momentum in the US markets, the tech sector, represented by the key Nasdaq 100, successfully overcame two consecutive daily pullbacks on Monday.
Indeed, the weakened stance of the greenback, combined with an overall improvement in market sentiment and growing optimism surrounding upcoming corporate earnings reports, all contributed to the index finding its footing and facilitating a favourable start to the week.
A deeper drop might cause the Nasdaq 100 to revisit the September low of 14432 (September 27), which is ahead of the weekly low of 14283 (June 7), and the 200-day SMA at 13765. The loss of this region exposes the April low of 12724 (April 25) prior to the March low of 11695 (March 13) and the 2023 bottom of 10696 (January 6). Having said that, more advances might send the Nasdaq 100 above its October high of 15333 (October 12) ahead of the September top of 15618 (September 1), which would come before the weekly peak of 15803 (July 31) and the 2023 high of 15932 (July 19), all of which precedes the round level of 16000. The daily RSI climbed to the vicinity of 55.
Top Gainers: Lululemon Athletica, Atlassian Corp Plc, DexCom
Top Losers: Moderna, Verisk, Walgreen Boots
Resistance levels: 15333 15512 15618 (4H chart)
Support levels: 14432 14283 13520 (4H chart)
DOW JONES
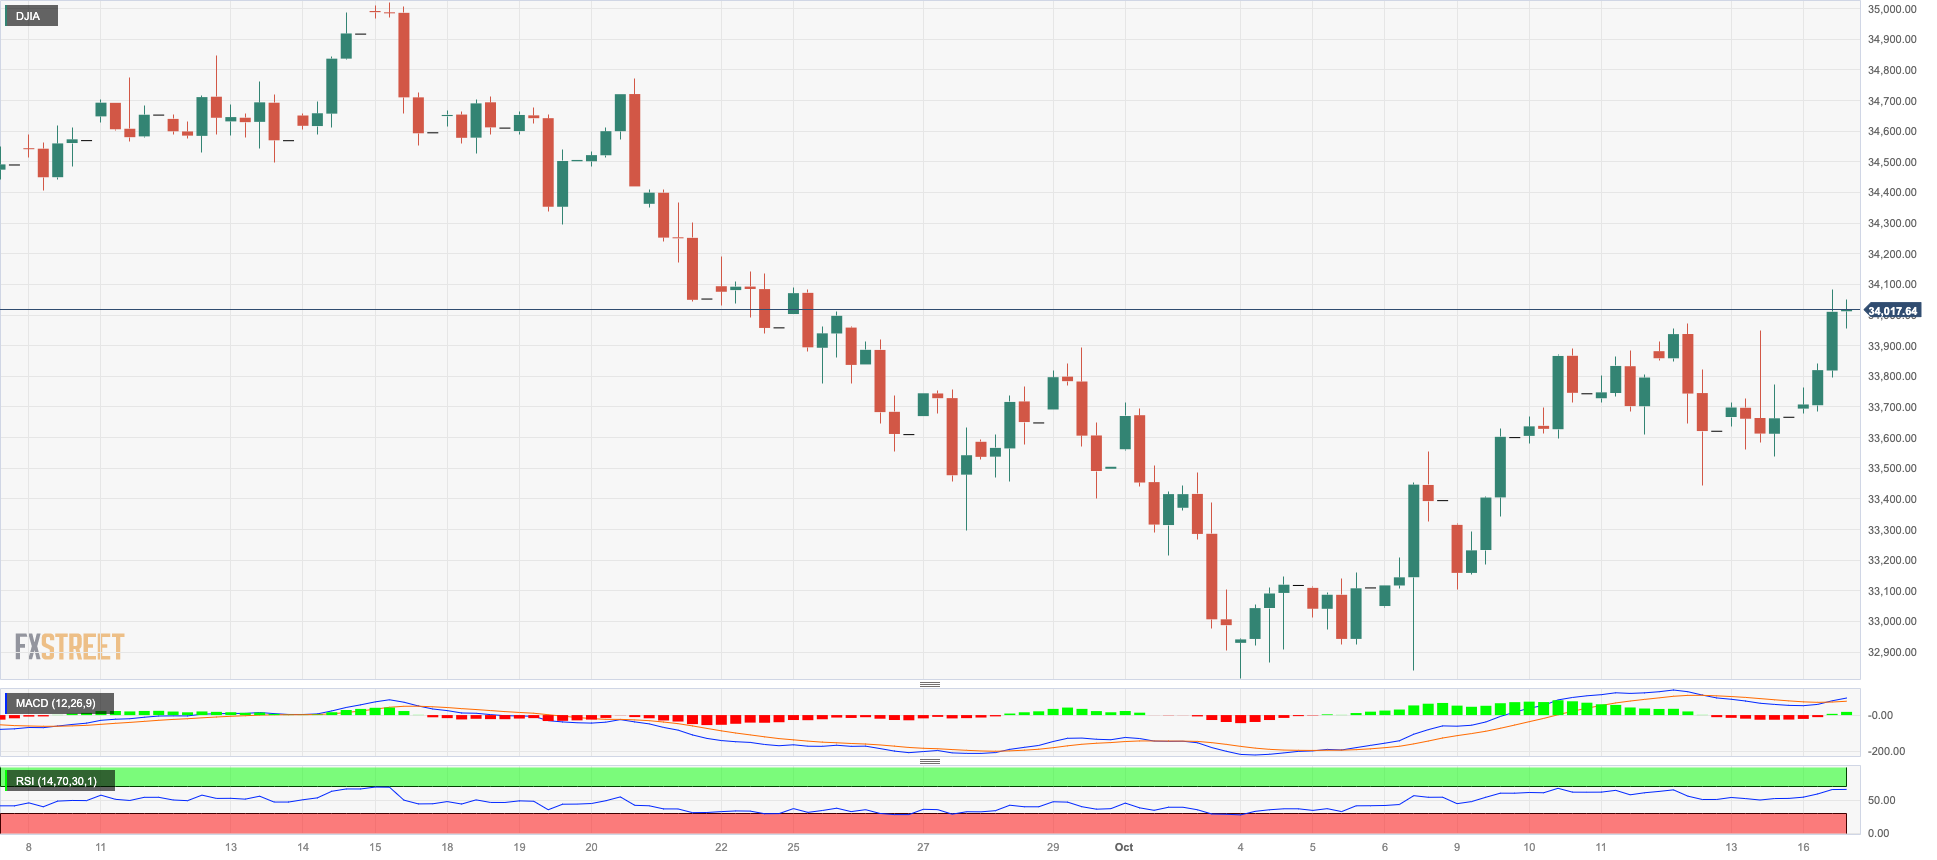
US equities navigated a “sea of green” at the beginning of the week, lifting the benchmark Dow Jones to fresh four-week highs past the key 34000 threshold.
Indeed, the index added to Friday’s gains on the back of increasing optimism ahead of the start of the earnings season, key data releases, and the speech by Chief Powell on the Economic Outlook, all due later in the week.
In addition, the resurgence of appetite for risk-associated assets and the selling pressure in the greenback also contributed to the upbeat mood among investors on Monday.
All in all, the Dow Jones advanced 0.99% to 34003, the S&P500 gained 1.02% to 4372, and the tech-focused Nasdaq Composite rose 1.05% to 13547.
If the Dow Jones maintains its upward trend, it might test the 100-day and 55-day SMAs at 34293 and 34413, respectively, before reaching the September high of 34977 (September 14). North from here comes the weekly top of 35070 (August 31) seconded by the 2023 peak of 35679 (August 1). If the latter is surpassed, the 2022 high of 35824 (February 9) may be attained before the all-time top of 36952 is reached (January 5, 2022). Just the opposite, a drop below the October low of 32873 (October 4), may put a probable test of the May low of 32586 (May 25) back on the radar ahead of the 2023 low of 31429 (March 15). The daily RSI leapt past the 51 mark.
Top Performers: Nike, Intel, Salesforce Inc
Worst Performers: Apple, Walgreen Boots, JPMorgan
Resistance levels: 34088 34288 34977 (4H chart)
Support levels: 32846 32586 31805 (4H chart)
MACROECONOMIC EVENTS
All Information & Updates provided by:

All information relating to the financial markets available on this page has been prepared and issued by FXStreet (Forexstreet SL, Spain, Reg: B62498233) on the basis of publicly available information and all information believed to be reliable and does not conflict with Kuwaiti local laws, and all necessary care has been taken to before the company to ensure that the facts mentioned are correct from the source.
NCM Investment nor any of its directors or employees shall in any way be held responsible for the contents of this news, and the information contained on this page is intended only to provide clients with publicly available information and should not be construed as investment advice, report or analysis and/or constitute an offer or invitation to buy or sell financial instruments of any kind.
RISK WARNING: Forex and CFDs are highly risky leveraged products, as losses can exceed deposits. Please ensure you understand all the risks and take independent advice if necessary. NCM will segregate the clients based on the criteria of the regulator and its bylaws. NCM does not provide any advisory service; the material published does not constitute advice or a recommendation for a transaction in any financial instrument. NCM accepts no responsibility for any use of the content presented and any consequences of that use. Anyone acting on the information provided does so at their own risk.