
- Contact Us:
-

-

-

-


Daily Market Updates
18 Oct 2023
USDJPY
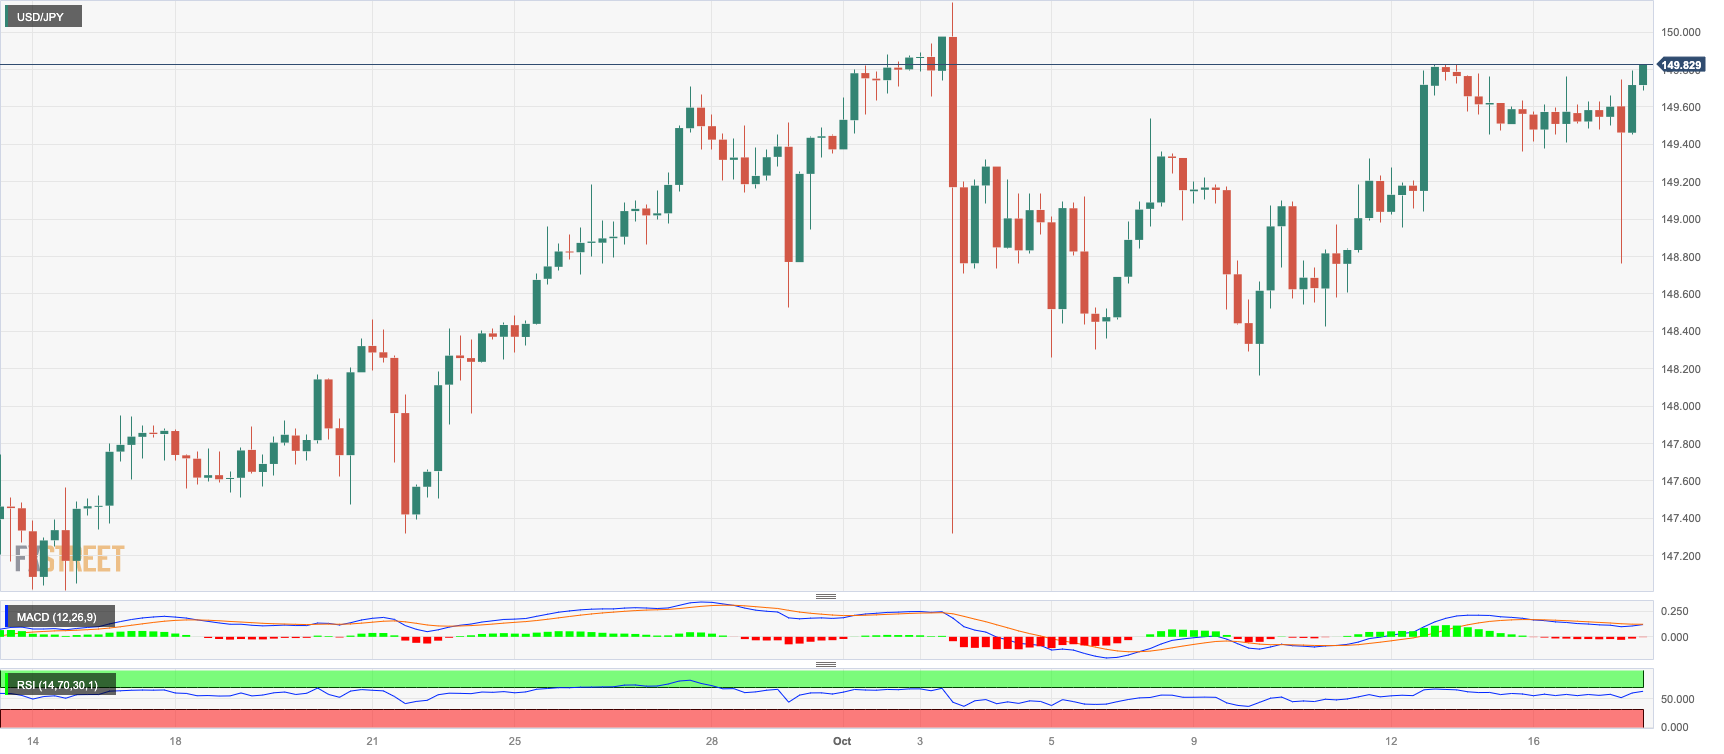
USD/JPY managed to stage a meaningful comeback following an early drop to the 148.70 on BoJ news, eventually posting decent gains well north of the 149.00 frontier.
It was quite a volatile session for the pair, as the Japanese yen could not sustain earlier gains in the 148.70 region in response to news that the BoJ might be mulling the idea of raising the inflation target to around 3.0% for FY2023.
In the meantime, the greenback traded on the defensive despite US yields rose once again across the curve and the JGB 10-year yields advanced to multi-day highs past 0.80%.
In Japan, the Tertiary Industry Index contracted at a monthly 0.1% during August.
If USD/JPY surpasses the 2023 high of 150.16 (October 3), it might challenge the 2022 top of 151.94 (October 21). On the contrary, the 55-day SMA at 146.99 should give temporary support before the weekly bottom at 145.89 (September 11). The breakdown of the latter allows for a further decline to the September low of 144.43 (September 1), which appears propped up by the intermediate 100-day SMA at 144.39. South from here emerges the August low of 141.50 (August 7) before the 200-day SMA is at 139.02, and the July low of 137.23 (July 14). The daily RSI trespassed the 60 barrier.
Resistance levels: 149.82 150.16 151.94 (4H chart)
Support levels: 148.75 148.16 147.27 (4H chart)
GBPUSD
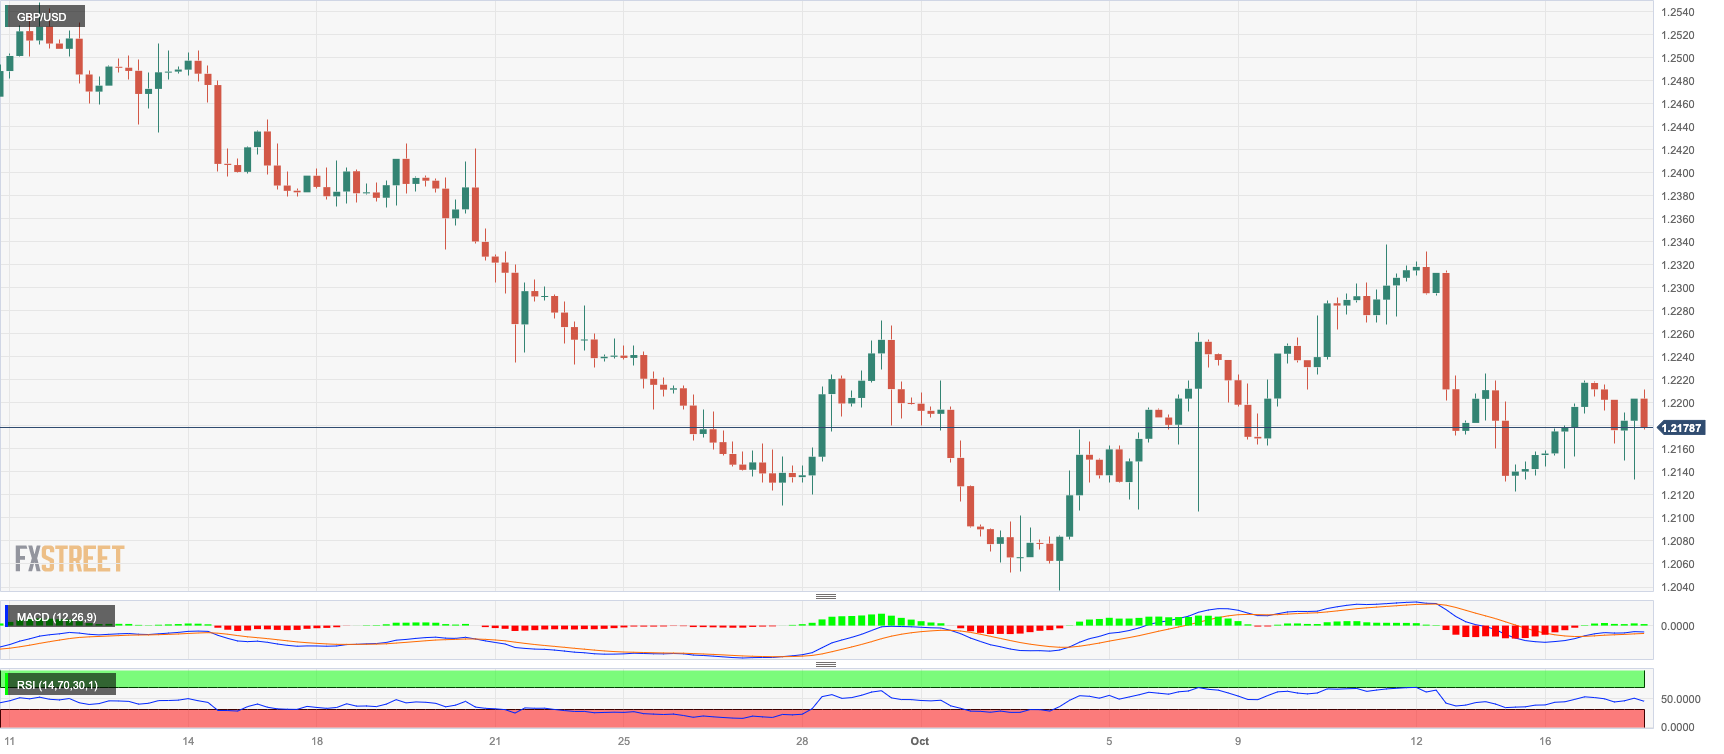
GBP/USD gave away part of Monday’s marked advance and retested the 1.2130 region on Tuesday, where it met some decent contention.
In fact, Cable could not capitalize on the poor session of the greenback and the broad-based optimism in the risk complex, ending Tuesday’s session with marginal losses near the 1.2200 zone.
In the UK, lower-than-expected wage inflation figures did not help the quid either after Average Earnings inc. Bonus rose 8.1% in the year to August, according to the partial jobs report, which in turn seems to remove pressure to hike rates further by the BoE.
From the BoE, MPC member S. Dhingra (dove) said she anticipates a relenting of domestic inflation. She expressed his expectation for some letting-up of wage growth, explaining that the labour market was genuinely loosening and that she did not foresee any further wage growth momentum. Additionally, she noted that quantitative easing (QE) had inflated asset prices more than was desired.
Further downside in the GBP/USD may push the pair down to the October low of 1.2037 (October 3), just ahead of the critical round milestone of 1.2000 and the 2023 low of 1.1802 (March 8). On the flip side, Cable faces the immediate resistance at the October high of 1.2337 (October 11), followed by the 200-day SMA at 1.2442, and the intermediate 55-day SMA at 1.2466. Up from here aligns the weekly top of 1.2548 (September 11) prior to the transitory 100-day SMA of 1.2594, as well as weekly highs of 1.2746 (August 30), 1.2818 (August 10), and 1.2995 (July 27), all of which precede the critical 1.3000 threshold. The RSI for the day dropped to the boundaries of 43.
Resistance levels: 1.2216 1.2330 1.2421 (4H chart)
Support levels: 1.2122 1.2105 1.2037 (4H chart)
AUDUSD
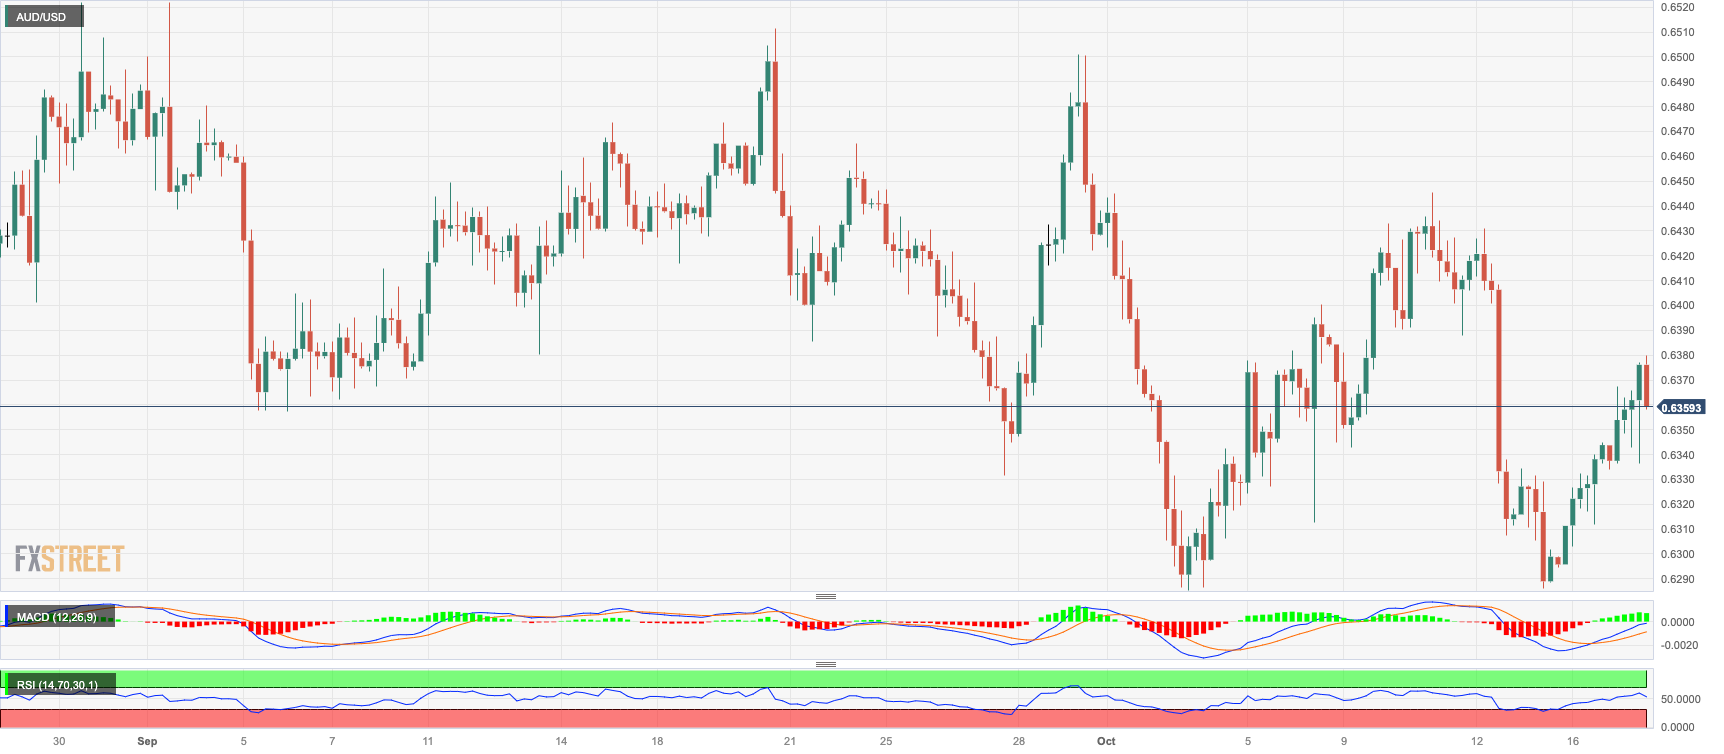
The late U-turn in the greenback prompted the USD Index (DXY) to reverse course and add to the bearishness seen at the beginning of the week, encouraging AUD/USD to advance for the second session in a row on Tuesday.
The daily uptick in the Aussie dollar came despite the mixed tone in the commodity universe, while it was also underpinned by the somewhat hawkish tilt from the RBA Minutes published during early trade.
On the latter, the RBA disclosed that it had contemplated raising rates by 25 basis points but decided against it, citing "insufficient new information." Additionally, the central bank cautioned that it had a "limited tolerance" for inflation failing to return to its target range of 2-3% by late 2025. The Minutes also reiterated that further decisions on interest rates remain data-dependent.
The 2023 bottom at 0.6285 (October 3) is the next low for the AUD/USD, followed by the November 2022 low at 0.6272 (November 7) and the 2022 low at 0.6179 (October 13). In contrast, the pair's initial resistance emerges at the weekly high of 0.6445 (October 11) seconded by another weekly top of 0.6522 (August 30). The surpass of the latter exposes the temporary 100-day SMA at 0.6558 and another weekly peak of 0.6616 (August 10), all of which are ahead of the 200-day SMA at 0.6661. A further rise may take the pair to its July high of 0.6894 (July 14), closely followed by the June top of 0.6899 (June 16), and the crucial 0.7000 level. The weekly peak of 0.7029 (February 14) is aligned with the 2023 high of 0.7157 (February 15). The RSI on a daily basis increased to the proximity of 48.
Resistance levels: 0.6367 0.6402 0.6445 (4H chart)
Support levels: 0.6285 0.6272 0.6210 (4H chart)
GOLD
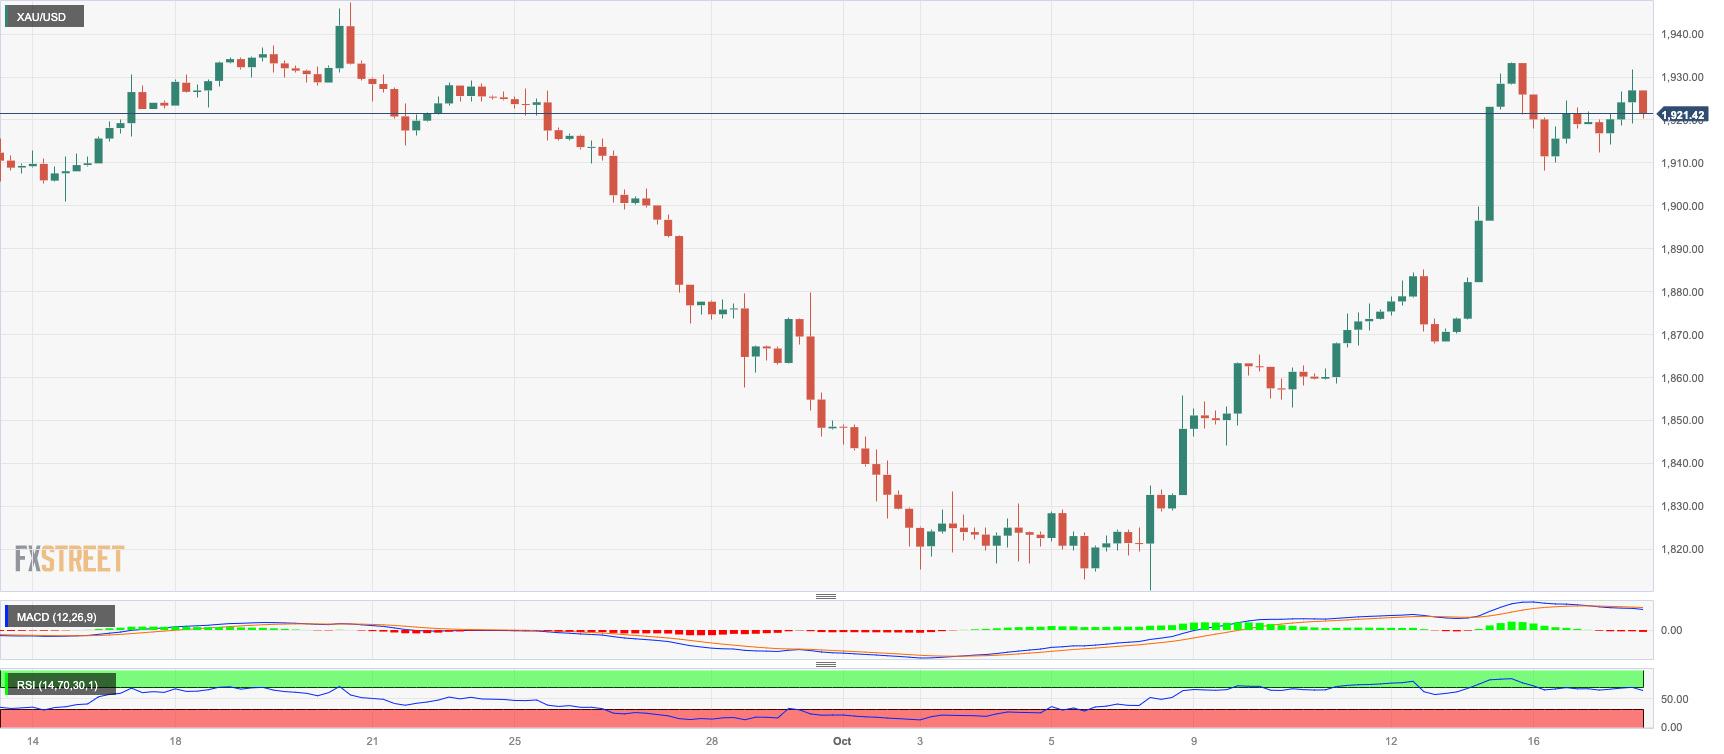
Prices of the troy ounce of the precious metal resumed the uptrend and revisited the key $1930 region on Tuesday.
The resumption of the upward bias in the precious metal came on the back of the late loss of momentum in the dollar, despite the marked move higher in US yields across different time frames.
The yellow metal seems to have derived extra buying interest in the escalation of the Israel-Hamas crisis, along with rising fears that the conflict could hit neighbouring regions.
Gold prices should now aim for the weekly high of $1947 (September 20), followed by the September top of $1953 (September 1). If gold breaks through the latter, it may aim for the July peak of $1987 (July 20), which is just below the critical $2000 level. The 2023 high of $2067 (May 4) may be challenged from here, seconded by the 2022 top of $2070 (March 8) and the all-time peak of $2075 (August 7, 2020). On the contrary, an immediate dispute exists at the October low of $1810 (October 6) prior to the 2023 bottom of $1804 (February 28) and right before the critical contention zone of $1800.
Resistance levels: $1932 $1947 $1972 (4H chart)
Support levels: $1897 $1867 $1853 (4H chart)
CRUDE WTI
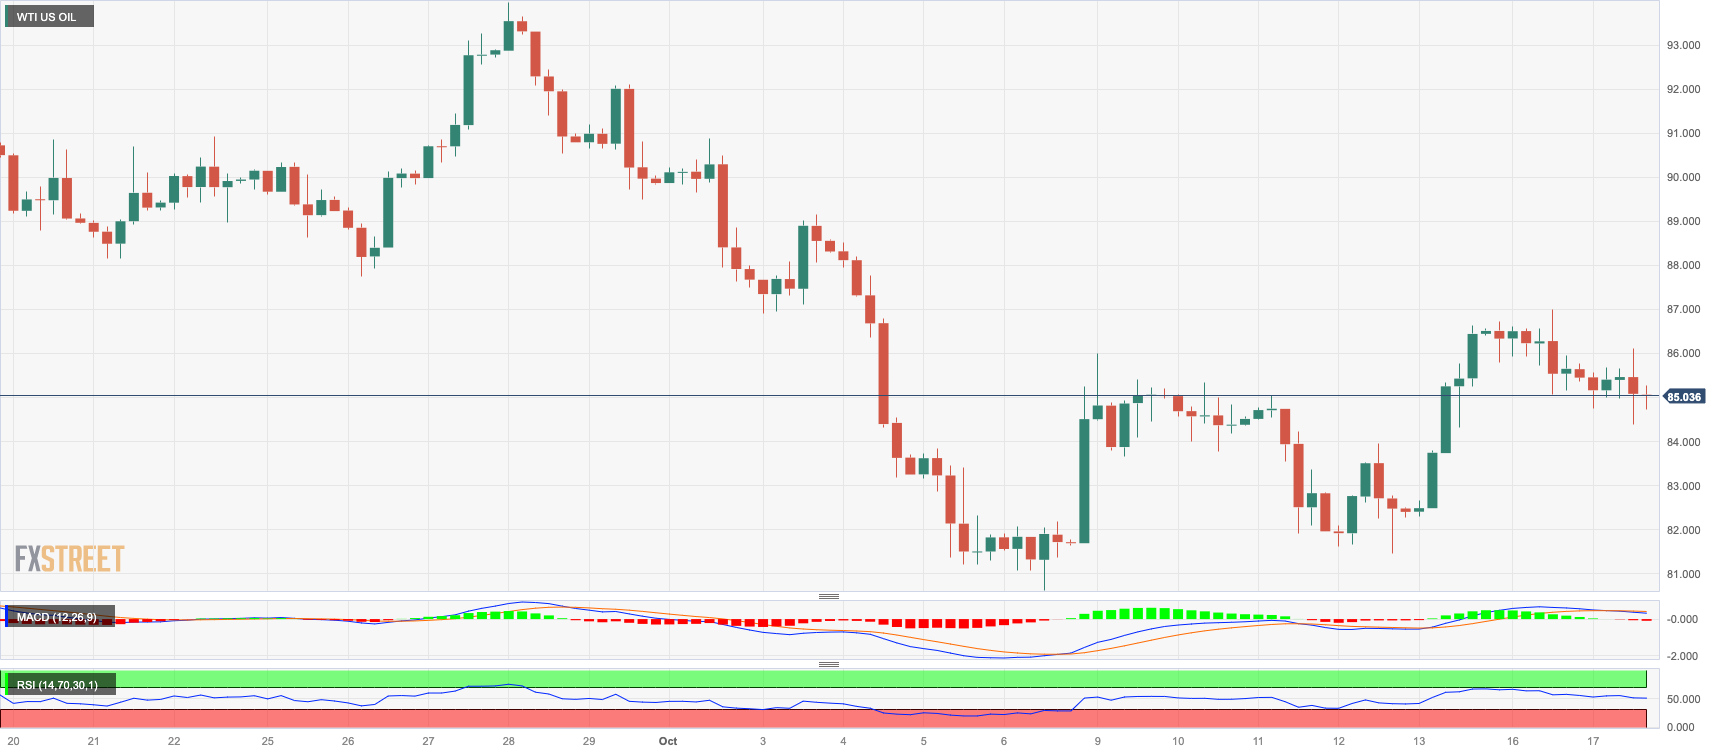
The cautious tone prevailed among traders on Tuesday, forcing prices of WTI to add to the bearish tone seen at the beginning of the week and deflate to two-day lows near the $85.60 zone.
In the meantime, events in the Middle East remained at the centre of the debate, as any deterioration of the crisis could have a direct impact on the supply of crude oil.
On another note, the commodity failed to grab fresh oxygen from the better-than-expected results from US Retail Sales and Industrial Production, which continued to show a marked resilience of the US economy.
Later in the NA session, the API will report on US crude oil supplies in the week to October 13, while extra attention will also be on the release of Chinese GDP figures and other key fundamentals early on Wednesday.
WTI's weekly high of $88.29 (October 16) precedes the 2023 top of $94.99 (September 28) and the weekly peak of $97.65 (August 30, 2022), all of which comes ahead of the psychological $100.00 mark per barrel. Further losses, on the other hand, might retest the October low of $81.56 (October 6) before the critical $80.00 level and the August low of $77.64 (August 24), which looks to be supported by the 200-day SMA at $77.80. If the latter is breached, WTI may fall to the weekly low of $73.89 (July 17), seconded by the June low of $66.85 (June 12), and the 2023 low of $63.61 (May 4), all prior to the key $60.00 line per barrel.
Resistance levels: $88.29 $90.23 $93.06 (4H chart)
Support levels: $85.65 $82.27 $81.47 (4H chart)
GER40
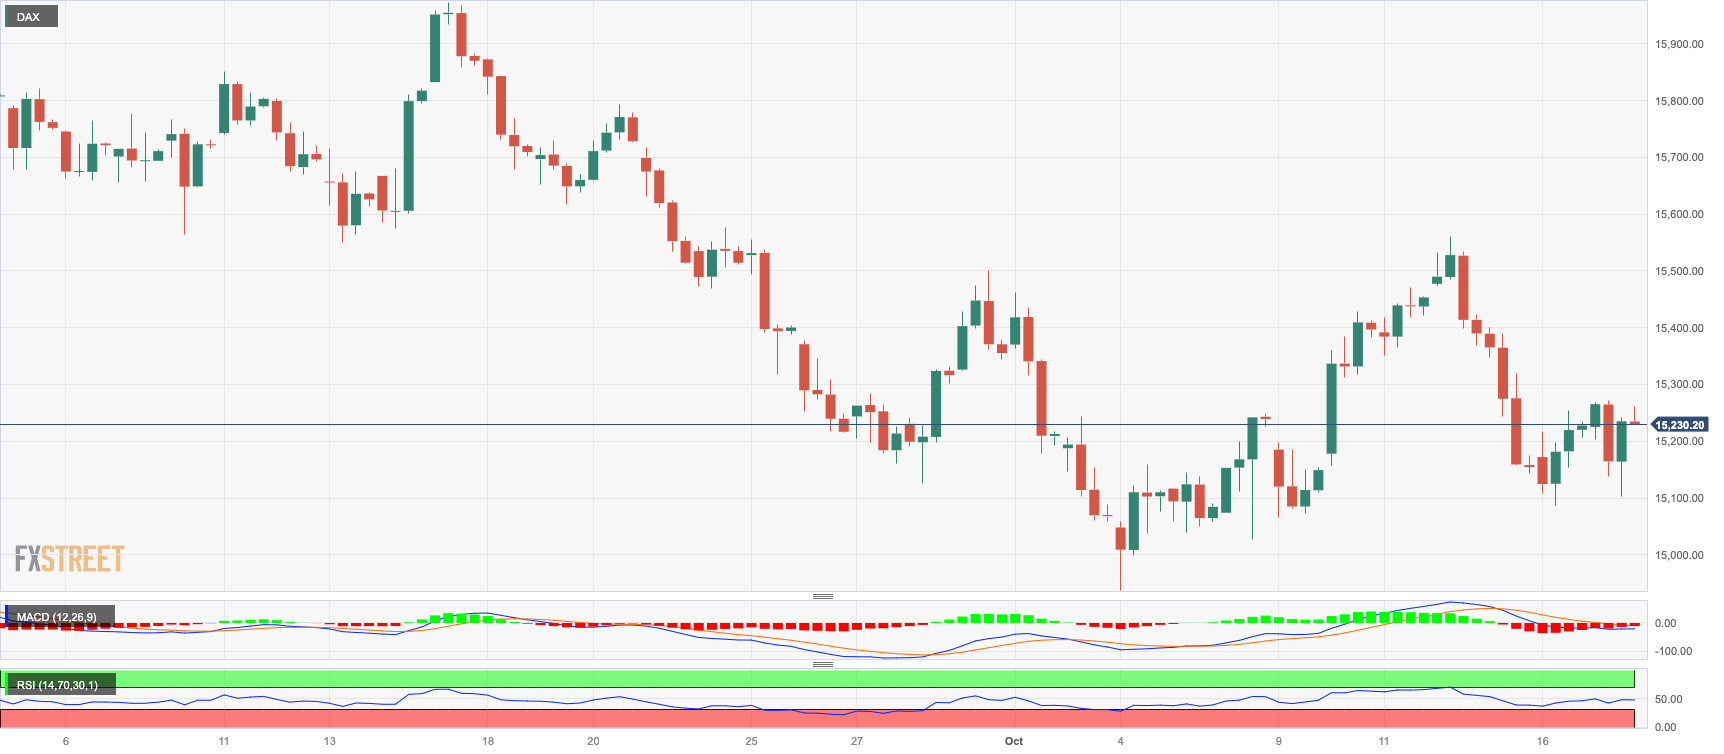
On Tuesday, the German reference DAX40 experienced a consecutive increase, reaching its highest level in two days around the 15200 range.
Although the index saw a slight upward movement, market participants maintained a cautious stance due to the escalating geopolitical tensions in the Middle East.
The upcoming visit of President Biden to Israel on Wednesday is anticipated to contribute to diplomatic efforts aimed at resolving the ongoing conflict between Israel and the Islamic group Hamas.
Bulls are still striving for the 200-day SMA at 15647, as well as the September high of 15989 (September 15), all followed by the weekly tops of 16042 (August 31) and 16060 (August 10). A break above this level might return the DAX40 to its all-time high of 16528 (July 31). If sellers take control, the index may retarget the October bottom of 14948 (October 4) before moving on to the March low of 14458 (March 20) and the December 2022 low of 13791 (December 20), which comes before the 2022 low of 11862 (December 20). The everyday RSI rose a tad to 44.
Best Performers: Airbus Group, Dr Ing hc Porsche Prf, Continental AG
Worst Performers: Brenntag AG, Sartorius AG VZO, Deutsche Boerse
Resistance levels: 15575 15729 15989 (4H chart)
Support levels: 15103 14948 14809 (4H chart)
NASDAQ
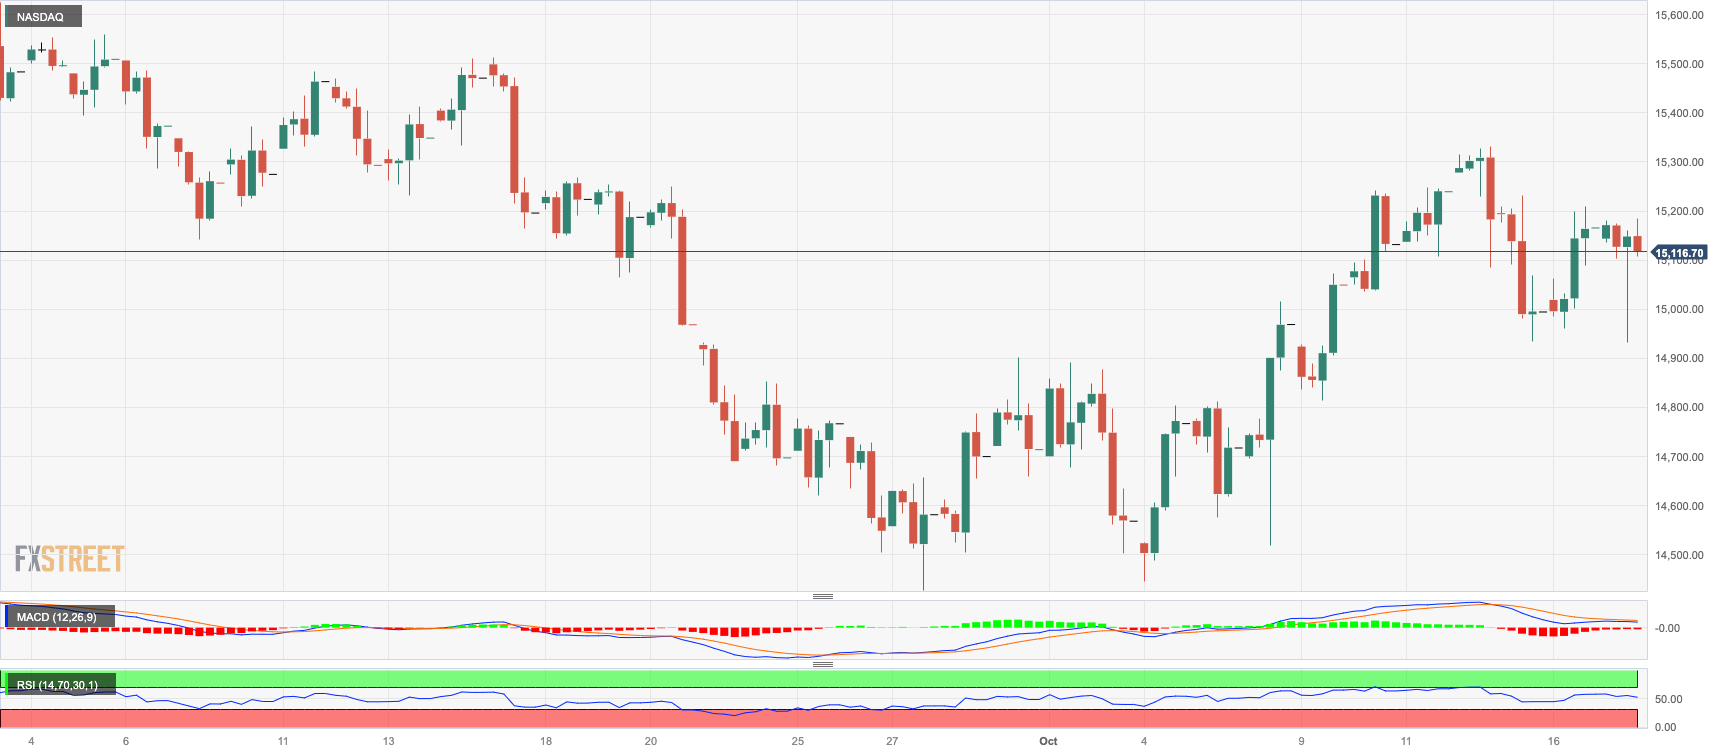
The US tech sector could not sustain Monday’s gains and came under further downside pressure on Tuesday, dragging the reference Nasdaq 100 to the area of three-day lows near 14900.
The key index succumbed to the noticeable march north in US yields across the curve, particularly following auspicious results from the US docket, while cautiousness around the geopolitical scenario remained on the rise prior to President Biden’s visit to Israel on Wednesday.
A deeper dip might send the Nasdaq 100 back to the September low of 14432 (September 27), which comes ahead of the weekly low of 14283 (June 7) and the 200-day SMA at 13786. The disappearance of this region reveals the April low of 12724 (April 25), before the March low of 11695 (March 13) and the 2023 bottom of 10696 (January 6). Having said that, further gains might push the index past its October high of 15333 (October 12), seconded by the September top of 15618 (September 1), which would come before the weekly peak of 15803 (July 31) and the 2023 high of 15932 (July 19), all prior to the round milestone of 16000. The day-to-day RSI deflated below the 55 level.
Top Gainers: Dollar Tree, DexCom, Enphase
Top Losers: Moderna, Lucid Group, NVIDIA
Resistance levels: 15333 15512 15618 (4H chart)
Support levels: 14432 14283 13520 (4H chart)
DOW JONES
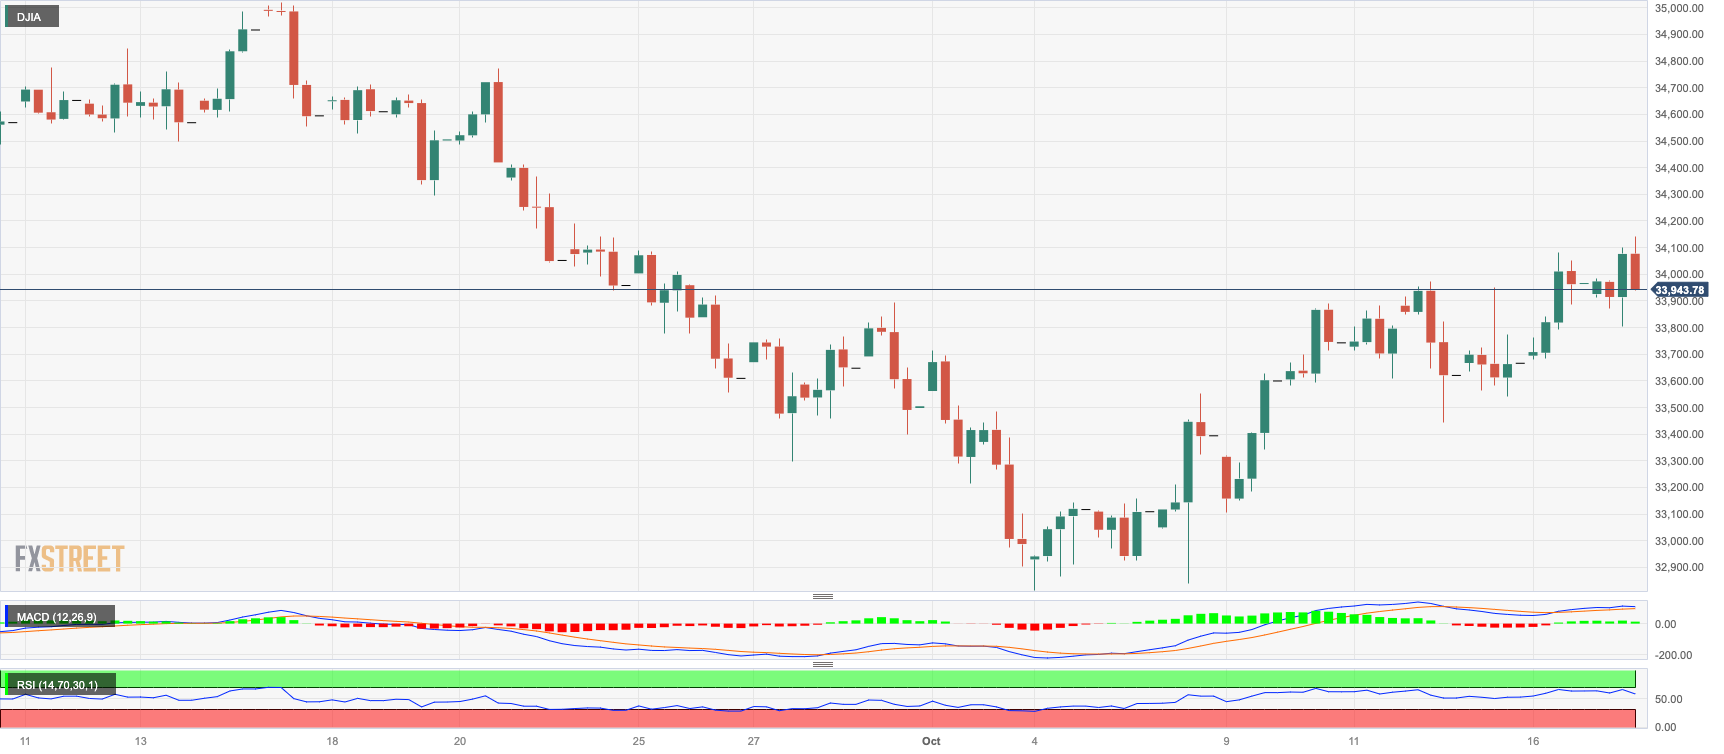
US stocks tracked by the Dow Jones extended the recovery for the third session in a row on Tuesday, this time looking to consolidate the breakout of the key 34000 threshold.
The index advanced further on the back of steady optimism following better-than-expected results from US fundamentals, while hopes of a positive corporate earnings season also underpinned the mood among investors.
Overall, the Dow Jones advanced 0.10% to 34018, the S&P500 rose 0.05% to 4375, and the tech-benchmark Nasdaq Composite retreated 0.08% to 13559.
If the Dow Jones continues to rise, it may challenge the 100-day and 55-day SMAs at 34305 and 34385, respectively, before the September high of 34977 (September 14). North of here, emerges the weekly top of 35070 (August 31) prior to the 2023 peak of 35679 (August 1). If the latter is exceeded, the 2022 high of 35824 (February 9) may be achieved before the all-time top of 36952 (January 5, 2022). On the downside, a drop below the October low of 32873 (October 4) may reintroduce a possible test of the May low of 32586 (May 25) ahead of the 2023 low of 31429 (March 15). The daily RSI advanced marginally to the 53 area.
Top Performers: Salesforce Inc, Chevron, Walgreen Boots
Worst Performers: Goldman Sachs, Cisco, J&J
Resistance levels: 34147 34288 34977 (4H chart)
Support levels: 33455 32846 32586 (4H chart)
MACROECONOMIC EVENTS
All Information & Updates provided by:

All information relating to the financial markets available on this page has been prepared and issued by FXStreet (Forexstreet SL, Spain, Reg: B62498233) on the basis of publicly available information and all information believed to be reliable and does not conflict with Kuwaiti local laws, and all necessary care has been taken to before the company to ensure that the facts mentioned are correct from the source.
NCM Investment nor any of its directors or employees shall in any way be held responsible for the contents of this news, and the information contained on this page is intended only to provide clients with publicly available information and should not be construed as investment advice, report or analysis and/or constitute an offer or invitation to buy or sell financial instruments of any kind.
RISK WARNING: Forex and CFDs are highly risky leveraged products, as losses can exceed deposits. Please ensure you understand all the risks and take independent advice if necessary. NCM will segregate the clients based on the criteria of the regulator and its bylaws. NCM does not provide any advisory service; the material published does not constitute advice or a recommendation for a transaction in any financial instrument. NCM accepts no responsibility for any use of the content presented and any consequences of that use. Anyone acting on the information provided does so at their own risk.