
- Contact Us:
-

-

-

-


Daily Market Updates
19 Oct 2023
USDJPY
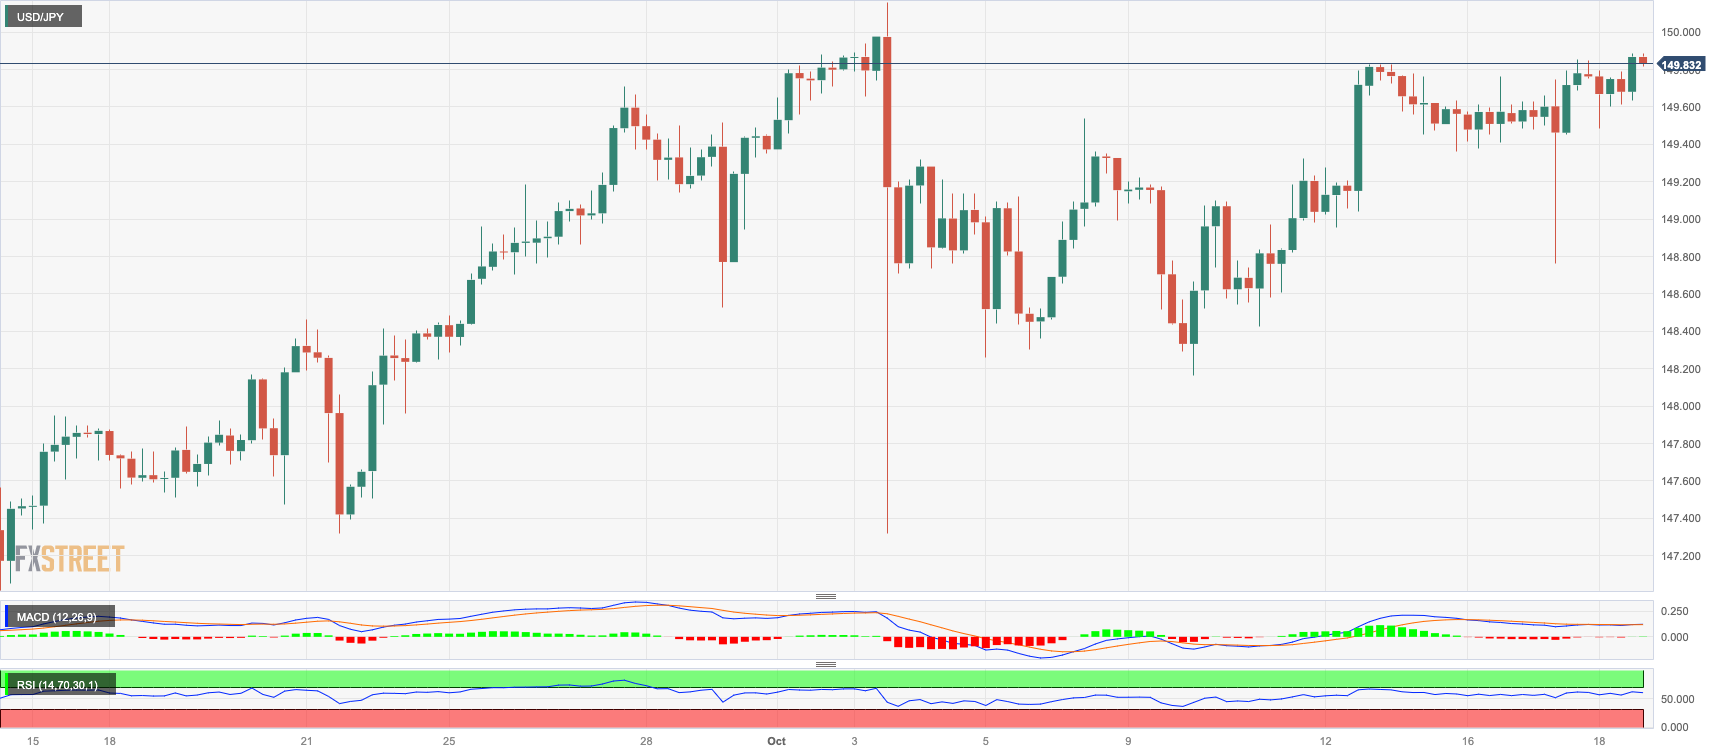
USD/JPY traded in an inconclusive fashion in the area of weekly tops just below the key 150.00 hurdle on Wednesday.
The pair’s irresolute price action came amidst rising geopolitical concerns, which underpinned the demand for safe haven space, and the marked rebound in the greenback, while US and Japanese bond yields also added to Tuesday’s advance.
The Japanese docket was empty on Wednesday, leaving all attention to the release of the Balance of Trade figures and weekly Foreign Bond Investment readings on Thursday.
If the USD/JPY exceeds the 2023 high of 150.16 (October 3), it may later confront the 2022 high of 151.94 (October 21). The temporary 55-day SMA at 147.11, on the other hand, should provide brief support before the weekly bottom at 145.89 (September 11). The latter's breakdown allows for a further drop to the September low of 144.43 (September 1), which looks to be supported by the intermediate 100-day SMA at 144.50. The August low of 141.50 (August 7) appears south of here, before the 200-day SMA at 139.11, and the July low of 137.23 (July 14). The daily RSI looked stable around the 61 zone.
Resistance levels: 149.88 150.16 151.94 (4H chart)
Support levels: 148.73 148.16 147.27 (4H chart)
GBPUSD
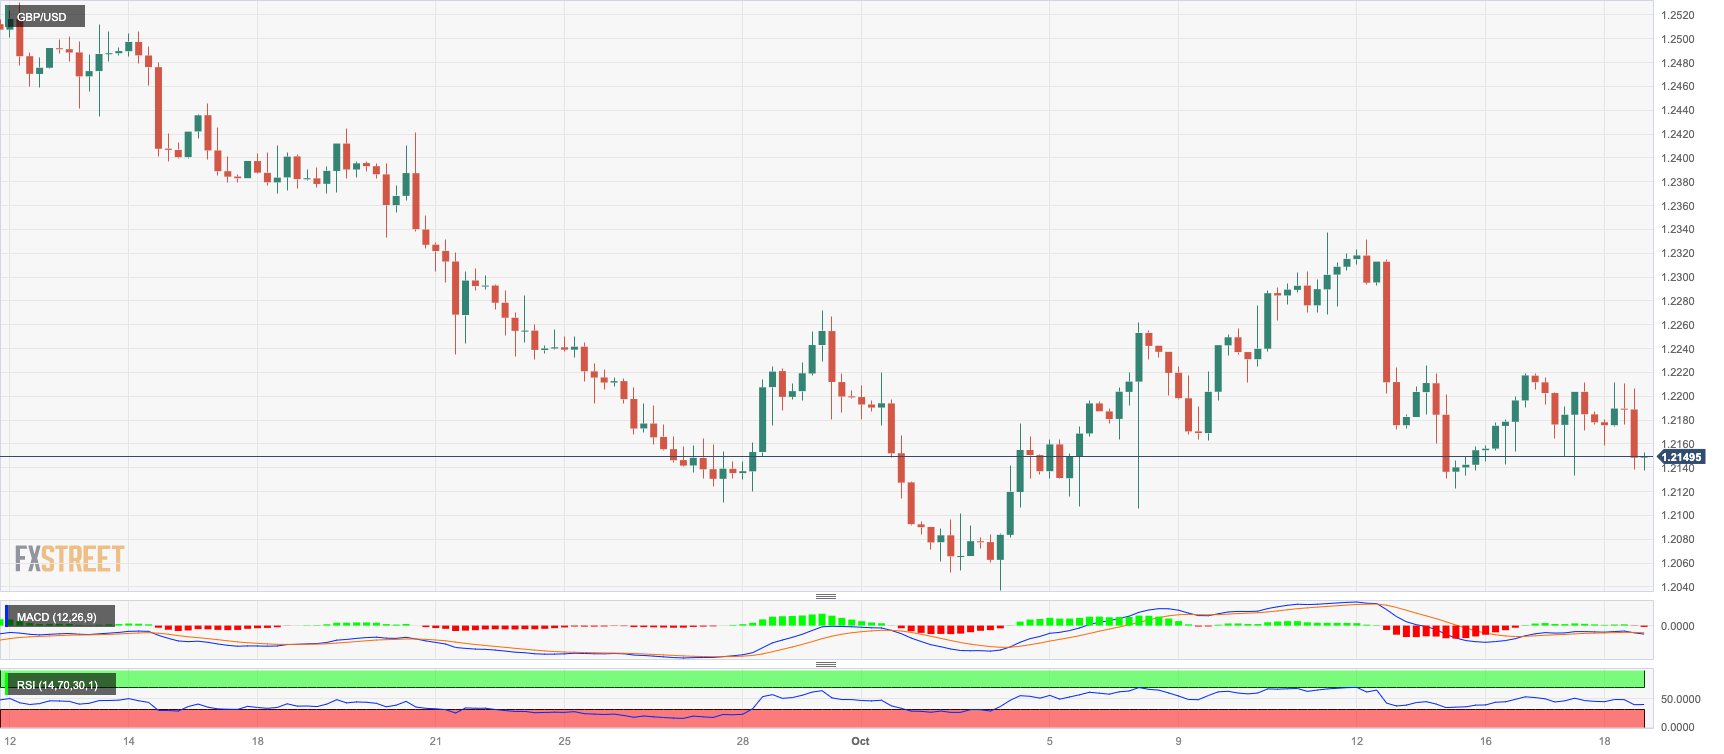
The resumption of demand for the greenback forced GBP/USD to add to the ongoing weekly leg lower and revisit the 1.2140 region on Wednesday.
In fact, the prevailing risk aversion lent fresh legs to the US dollar and the rest of the risk-linked galaxy, all against the backdrop of the increasingly deteriorating geopolitical landscape in the Middle East.
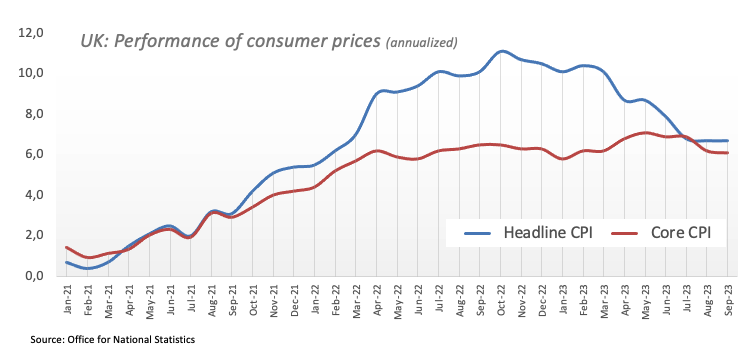
In the UK, higher-than-expected inflation figures during September failed to at least mitigate the selling pressure around the British pound after the headline CPI rose 6.7% from a year earlier and the Core CPI advanced 6.1% YoY over the last twelve months.
Further declines in the GBP/USD may drive the pair to the October low of 1.2037 (October 3), just ahead of the important round milestone of 1.2000 and the 2023 bottom of 1.1802 (March 8). The immediate up-barrier for Cable is the October high of 1.2337 (October 11), seconded by the 200-day SMA at 1.2442, which emerges just ahead of the intermediate 55-day SMA at 1.2456. North from here comes weekly tops of 1.2746 (August 30), followed by 1.2818 (August 10), and 1.2995 (July 27), all before the key 1.3000 threshold. The RSI for the day fell to the sub-40 zone.
Resistance levels: 1.2219 1.2337 1.2421 (4H chart)
Support levels: 1.2122 1.2105 1.2037 (4H chart)
AUDUSD
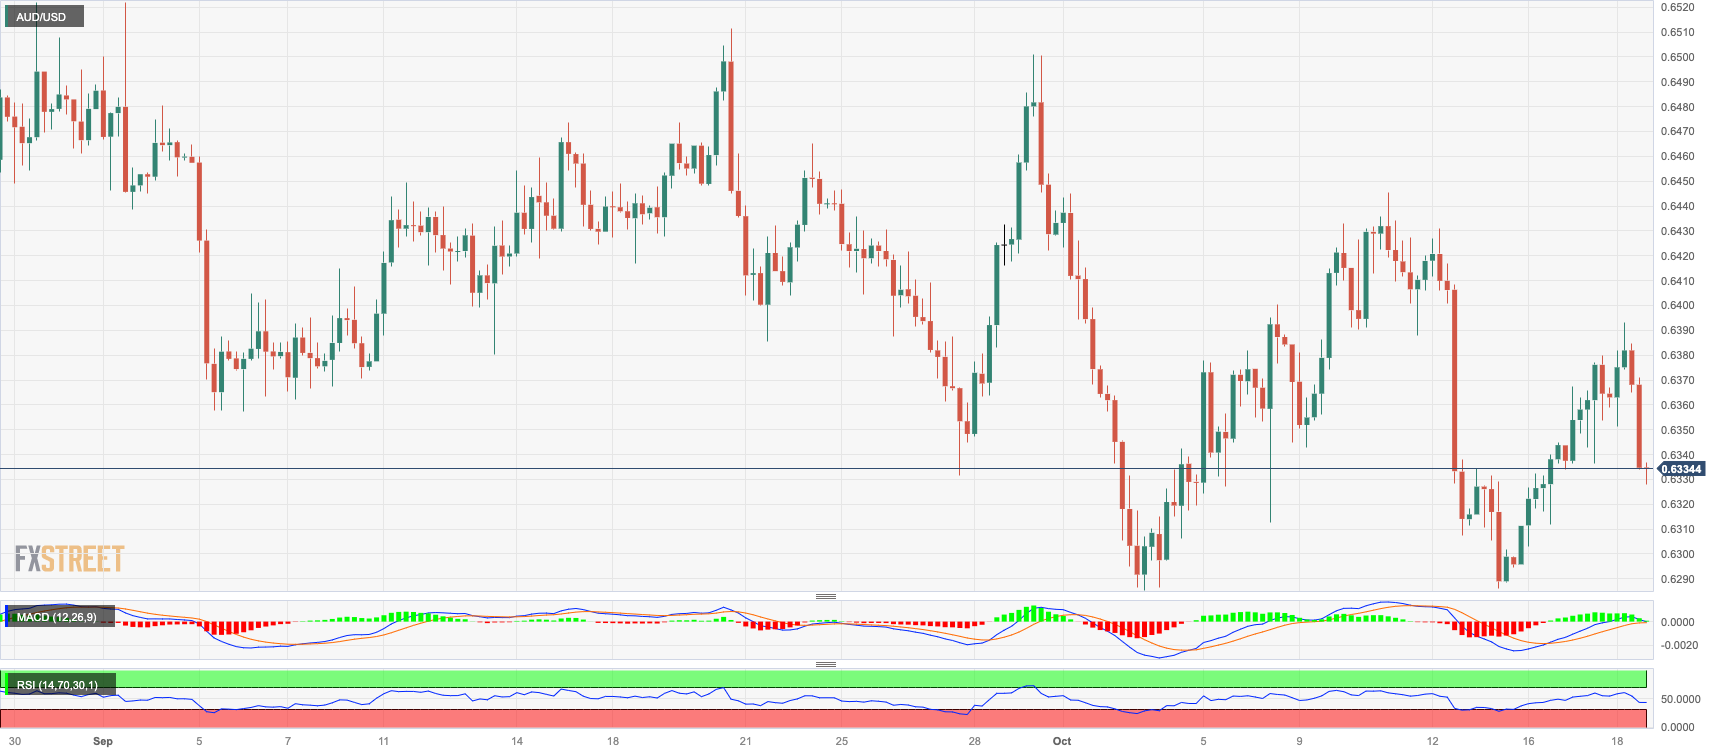
AUD/USD left behind a promising first half of the week and flirted with two-day lows near 0.6330 on Wednesday.
The robust bounce in the greenback amidst persistent geopolitics-driven risk aversion kept the risk-associated universe well depressed midweek, while the vacillating performance in the commodity galaxy and auspicious results from the Chinese docket also failed to lend some oxygen to the Aussie dollar.
In Oz, the Westpac Leading Index improved by 0.07% in September vs. the previous month.
The resurgence of the selling pressure could force AUD/USD to dispute the 2023 low of 0.6285 (October 3), ahead of the November 2022 low at 0.6272 (November 7) and the 2022 low at 0.6179 (October 13). On the flip side, the pair's initial resistance appears to be around the weekly high of 0.6445 (October 11), followed by another weekly top of 0.6522 (August 30). The breakout of the latter reveals the temporary 100-day SMA at 0.6557, prior to another weekly peak of 0.6616 (August 10), both of which are ahead of the 200-day SMA at 0.6659. Further gains might propel the pair to its July high of 0.6894 (July 14), followed by the June top of 0.6899 (June 16) and the critical 0.7000 level. The day-to-day RSI sank to the 44 area.
Resistance levels: 0.6393 0.6445 0.6501 (4H chart)
Support levels: 0.6285 0.6272 0.6210 (4H chart)
GOLD
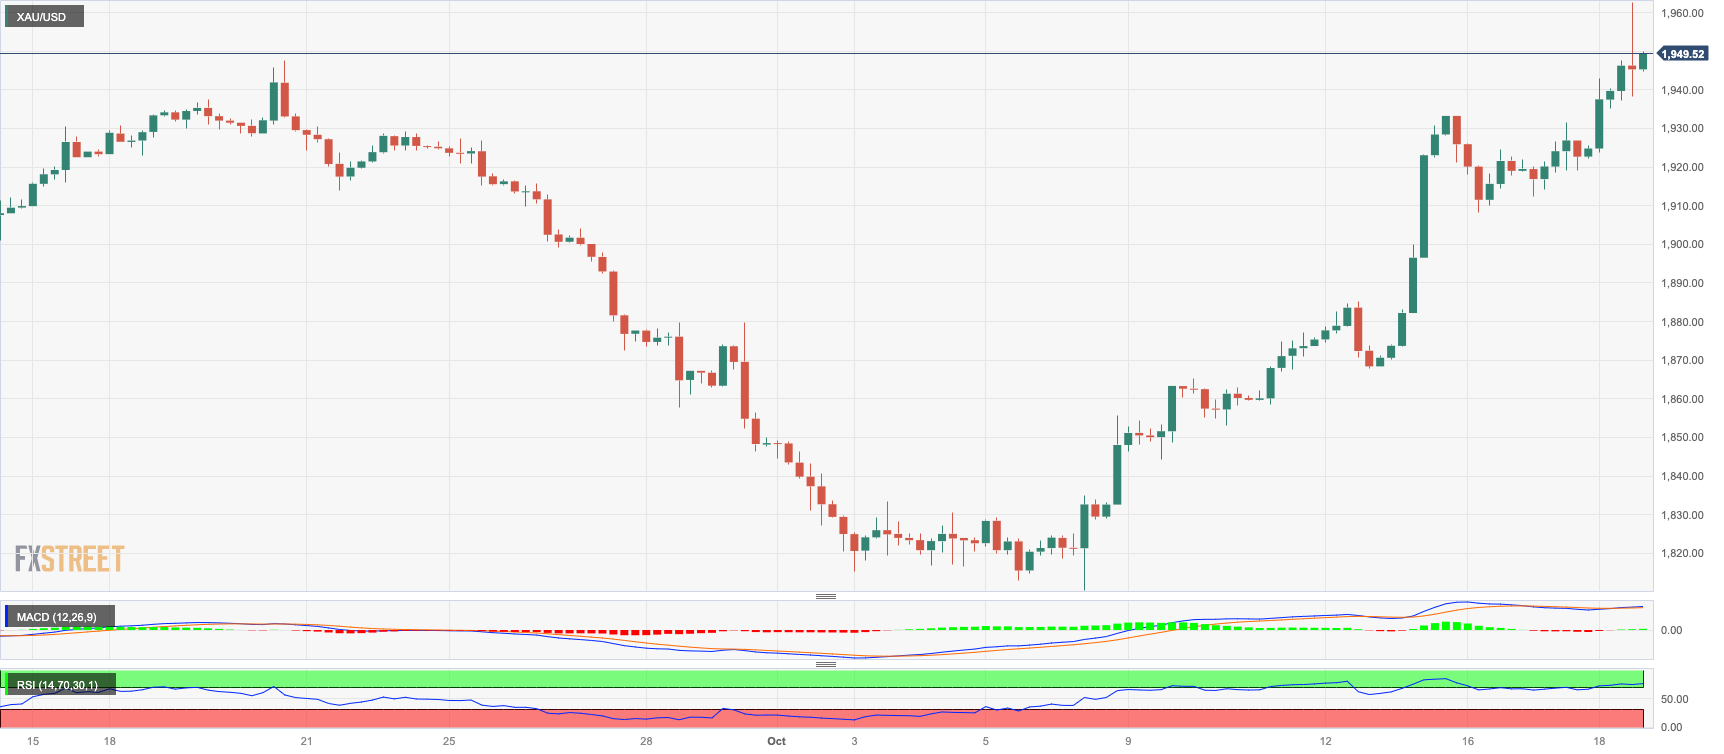
Gold prices extended further the monthly rebound and rose to new two-month tops past the $1960 region per troy ounce on Wednesday.
Increasing geopolitical concerns around the Middle East and its potential implication for other regions underpinned the fresh demand for the safe haven metal along with the better tone in the fixed-income space, while the solid performance of the US dollar appears to have dented part of the upside potential.
Gold prices should now aim for the October high of $1962 (October 18), which will be followed by the July top of $1987 (July 20) and the key $2000 barrier. From here, the 2023 peak of $2067 (May 4) might be challenged, seconded by the 2022 high of $2070 (March 8) and the all-time top of $2075 (August 7, 2020). On the contrary, there is an immediate contention at the October low of $1810 (October 6), which comes ahead of the 2023 bottom of $1804 (February 28) and just before the important support zone of $1800.
Resistance levels: $1962 $1982 $1987 (4H chart)
Support levels: $1908 $1896 $1867 (4H chart)
CRUDE WTI
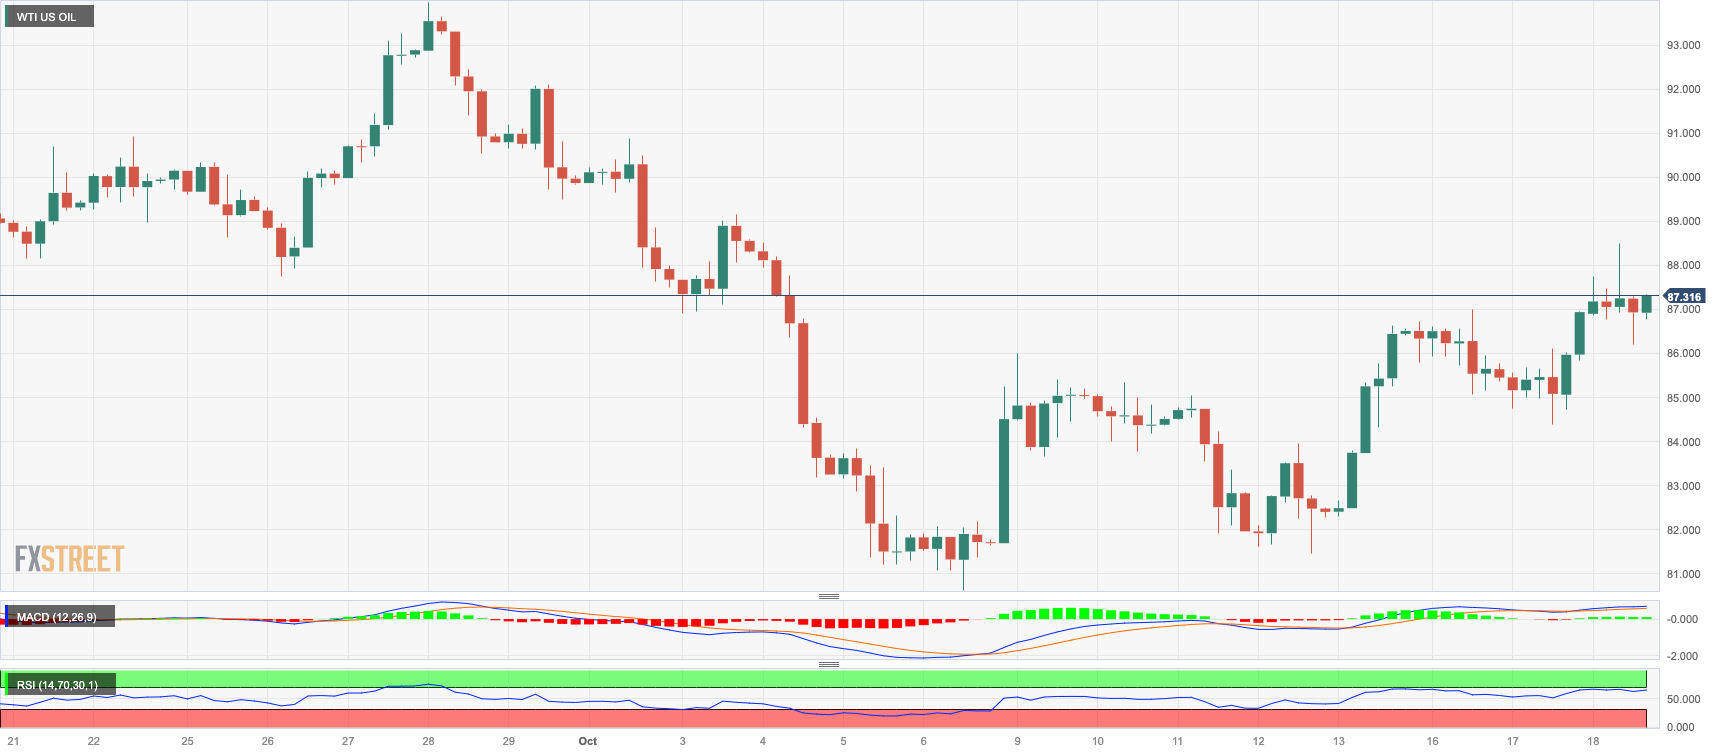
Increasing geopolitical tensions in the Middle East and their potential impact on the supply of crude oil, combined with the larger-than-expected drop in US crude oil inventories, lifted WTI prices to new two-week highs near the $90.00 mark per barrel on Wednesday.
Indeed, according to the EIA report, US crude oil inventories shrank by 4.491M barrels in the week to October 13, while supplies at Cushing dropped by 0.758M barrels, Weekly Distillate Stocks decreased by 3.185M barrels, and gasoline stockpiles went down by 2.371M barrels.
Also supporting the optimism among traders emerged the positive prints from the Chinese docket published during early trade.
WTI's weekly high of $89.83 (October 18) comes before the 2023 high of $94.99 (September 28) and the weekly high of $97.65 (August 30, 2022), all of which are ahead of the psychological $100.00 per barrel. Further declines, on the other hand, might retest the October low of $81.56 (October 6) before the important $80.00 level, as well as the August low of $77.64 (August 24), which appears to be supported by the 200-day SMA at $77.88. If the latter is surpassed, WTI may fall to the weekly low of $73.89 (July 17), followed by the June low of $66.85 (June 12), and the 2023 low of $63.61 (May 4), all before breaking through the critical $60.00 line per barrel.
Resistance levels: $89.83 $91.84 $93.06 (4H chart)
Support levels: $85.57 $82.27 $81.47 (4H chart)
GER40
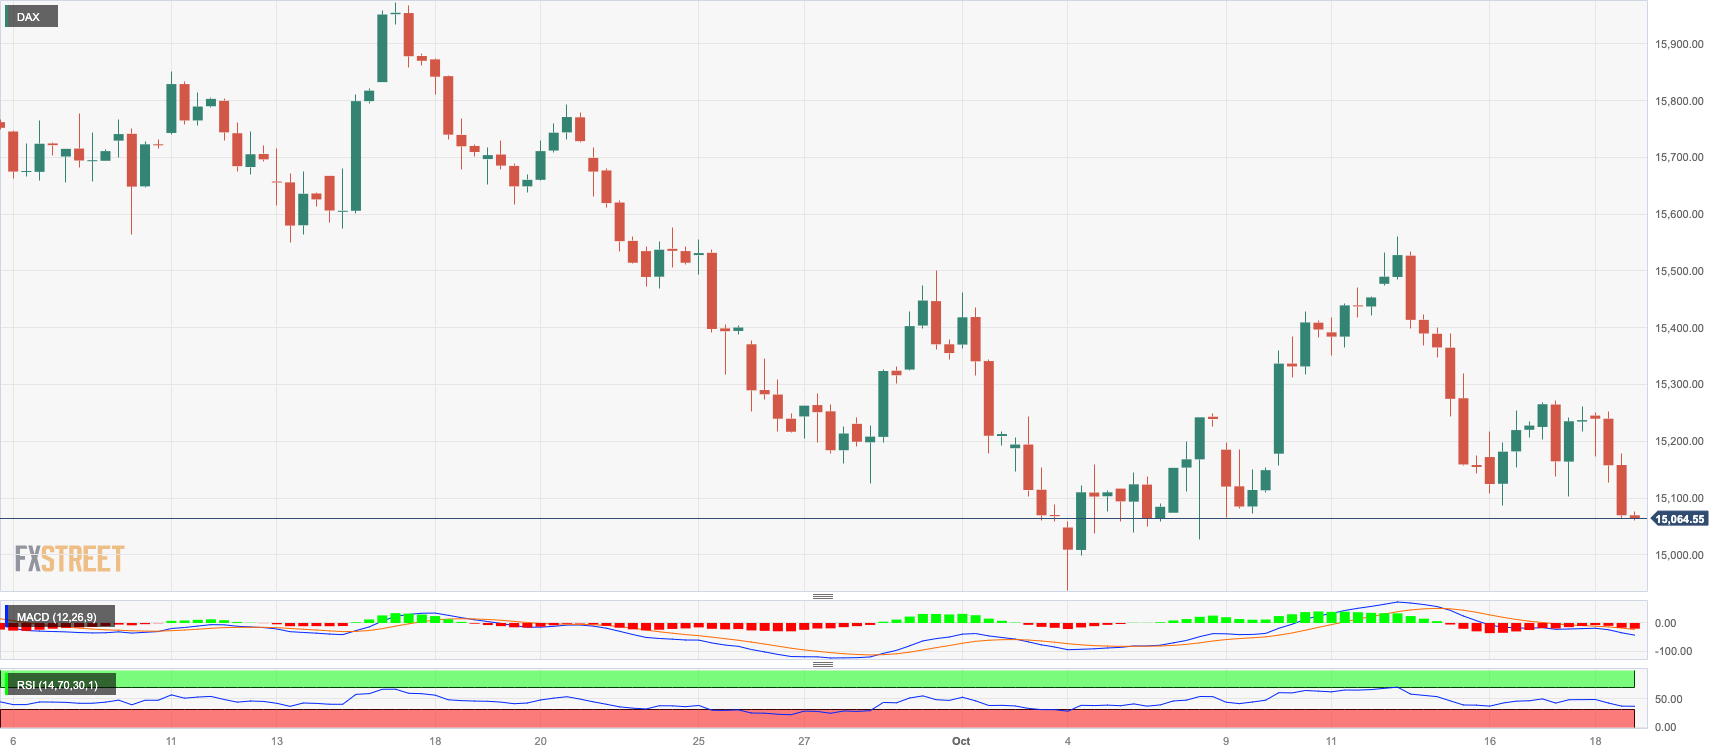
Germany’s benchmark DAX40 deflated to multi-session lows to levels near the 15000 threshold on Wednesday.
The resurgence of downside pressure in European stocks came amidst unabated effervescence in the Middle East coupled with the broad-based flight-to-safety stance.
Also contributing to the downbeat mood among market participants emerged poor results from earnings reports, which maintained any recovery attempt subdued on Wednesday.
In case bears push harder, the index may retest the October low of 14948 (October 4) before going on to the March low of 14458 (March 20) and the December 2022 low of 13791 (December 20), which comes before the 2022 low of 11862. (December 20). On the upside, there is initial resistance at the October high of 15575 (October 12) prior to the key 200-day SMA of 15650. Further up emerges the September top of 15989 (September 15), which is followed by weekly peaks of 16042 (August 31) and 16060 (August 10). A break above this level might bring the index back to its all-time high of 16528 (July 31). The daily RSI broke below the 40 yardstick.
Best Performers: Adidas, Hannover Rueck SE, Zalando SE
Worst Performers: Vonovia, Sartorius AG VZO, Heidelnergcement
Resistance levels: 15575 15729 15989 (4H chart)
Support levels: 15081 14948 14809 (4H chart)
NASDAQ
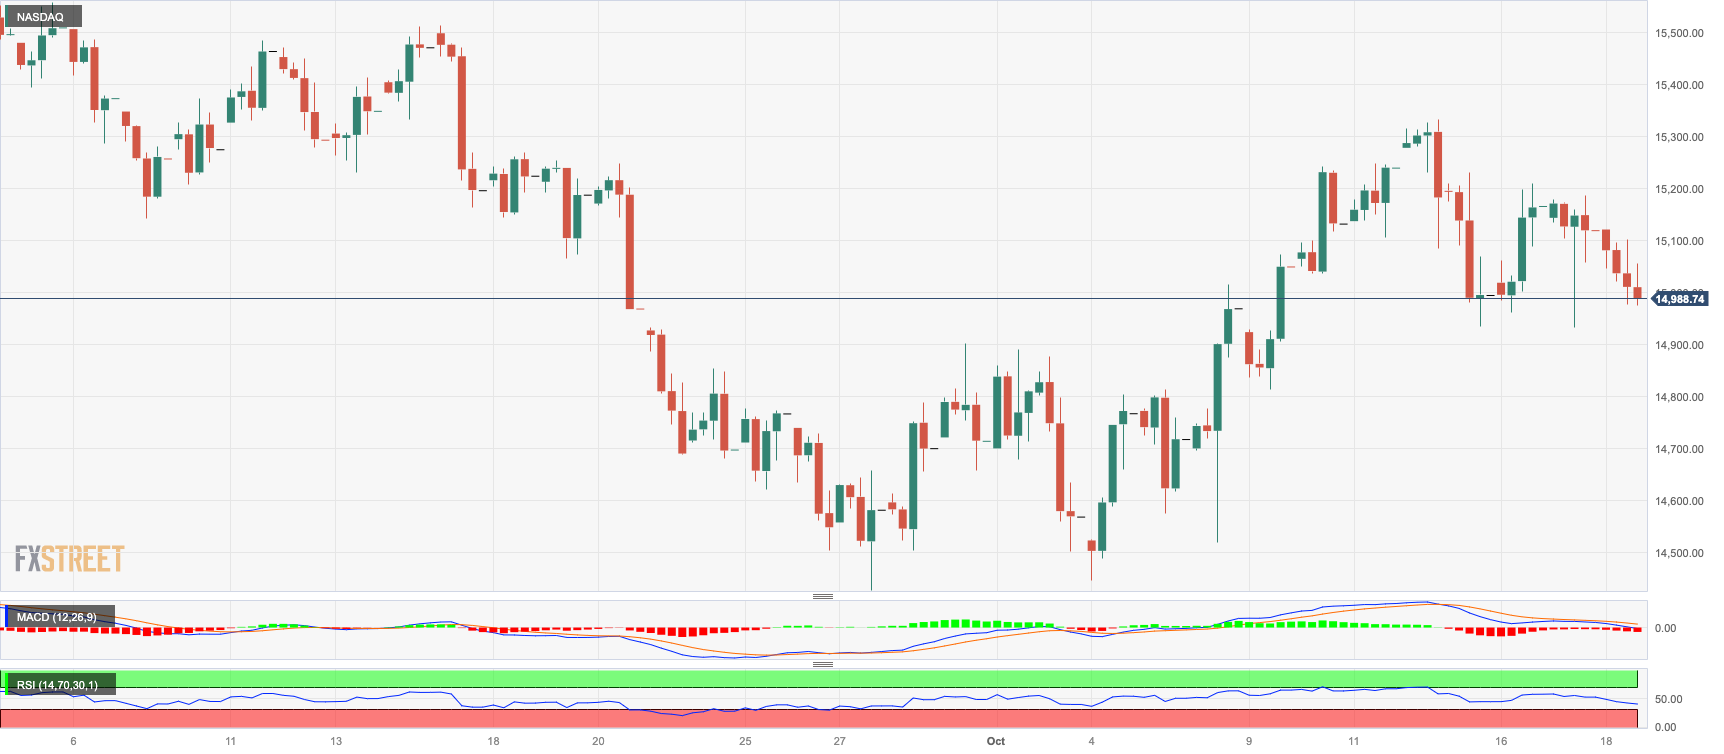
The downside momentum prevailed in the US tech sector for the second session in a row, dragging the reference Nasdaq 100 to the area below the key 15000 threshold once again on Wednesday.
The stronger greenback, the relentless march north in US yields across different time frames, and the generalized risk aversion context all weighed on tech equities, along with some disappointing corporate earnings reports.
A steeper decline may bring the Nasdaq 100 down to its September low of 14432 (September 27), which comes ahead of the weekly low of 14283 (June 7) and the 200-day SMA at 13806. In case this zone vanishes, the April low of 12724 (April 25) is expected to re-emerge, before the March low of 11695 (March 13) and the 2023 bottom of 10696 (January 6). However, additional advances might send the index over its October high of 15333 (October 12), followed by the September top of 15618 (September 1), all before the weekly peak of 15803 (July 31) and the 2023 high of 15932 (July 19), all before the round milestone of 16000. The everyday RSI fell to the sub-50 zone.
Top Gainers: DexCom, Palo Alto Networks, Adobe
Top Losers: Lucid Group, AstraZeneca ADR, Walgreen Boots
Resistance levels: 15333 15512 15618 (4H chart)
Support levels: 14432 14283 13520 (4H chart)
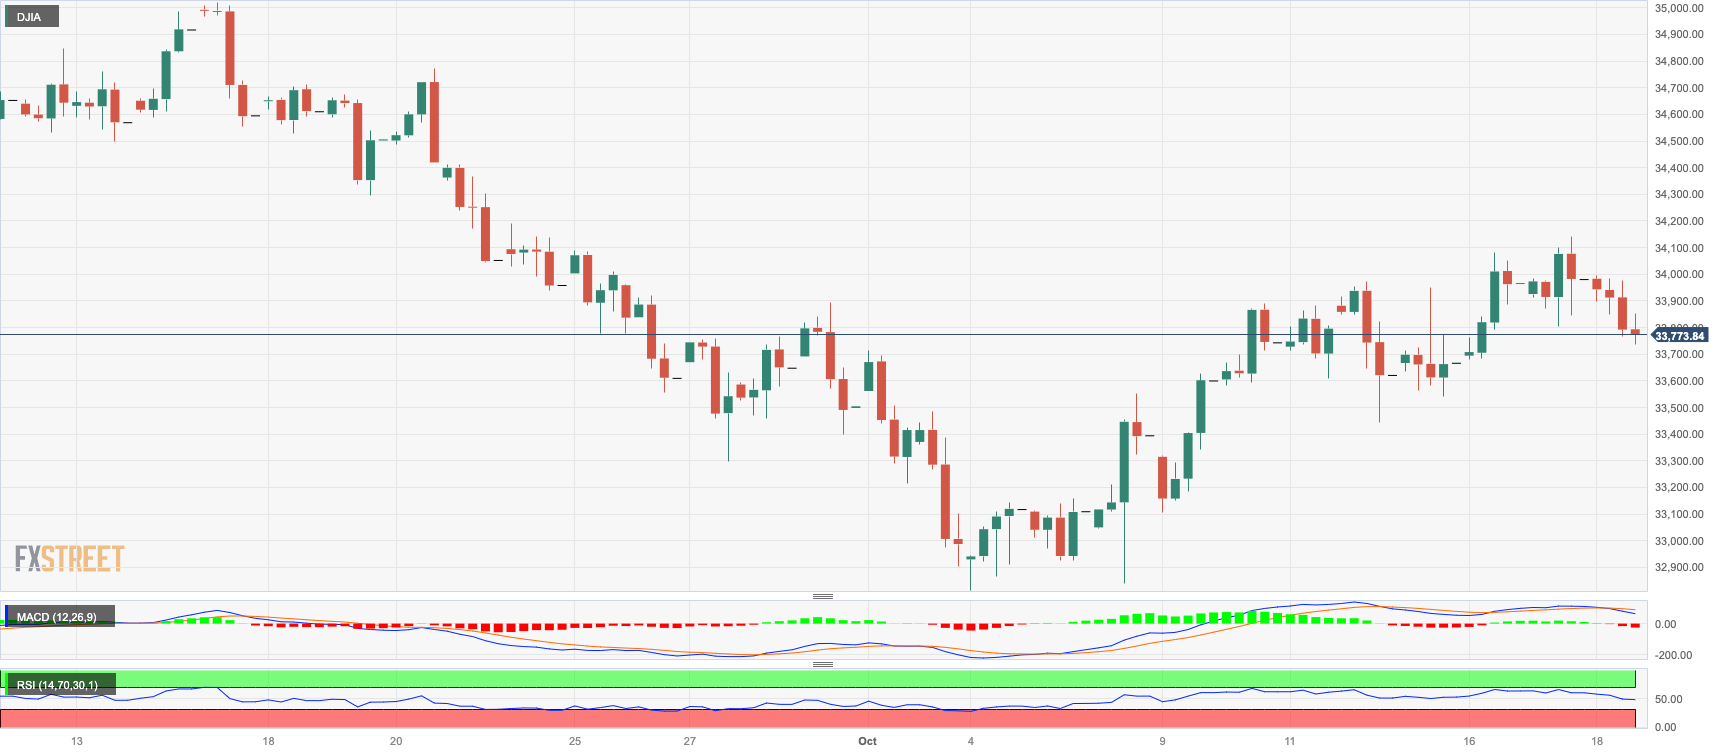
DOW JONES
The US blue-chip benchmark Dow Jones saw its positive streak come to a halt on Wednesday, retreating to fresh weekly lows in the 33700 region.
The renewed downside pressure around US equities came in response to investors’ disappointment over some corporate earnings results as well as increasing geopolitical concerns in the Middle East, which maintained the risk aversion well in place.
All in all, the Dow Jones retreated 0.67% to 33769, the S&P500 dropped 0.92% to 4333, and the tech-heavy Nasdaq Composite deflated 0.99% to 13397.
If the Dow Jones continues to increase, it may test the 100-day and 55-day SMA at 34315 and 34251, respectively, before reaching the September high of 34977 (September 14). North of here, the weekly high of 35070 (August 31) appears before the 2023 peak of 35679 (August 1). If the latter is surpassed, the 2022 high of 35824 (February 9) may be reached before the all-time top of 36952 is reached (January 5, 2022). A loss below the October low of 32873 (October 4) may reintroduce a test of the May low of 32586 (May 25) prior to the 2023 low of 31429. (March 15). The daily RSI dropped to the vicinity of 47.
Top Performers: Procter&Gamble, McDonald’s, Boeing
Worst Performers: Walgreen Boots, Caterpillar, Goldman Sachs
Resistance levels: 34147 34288 34977 (4H chart)
Support levels: 33455 32846 32586 (4H chart)
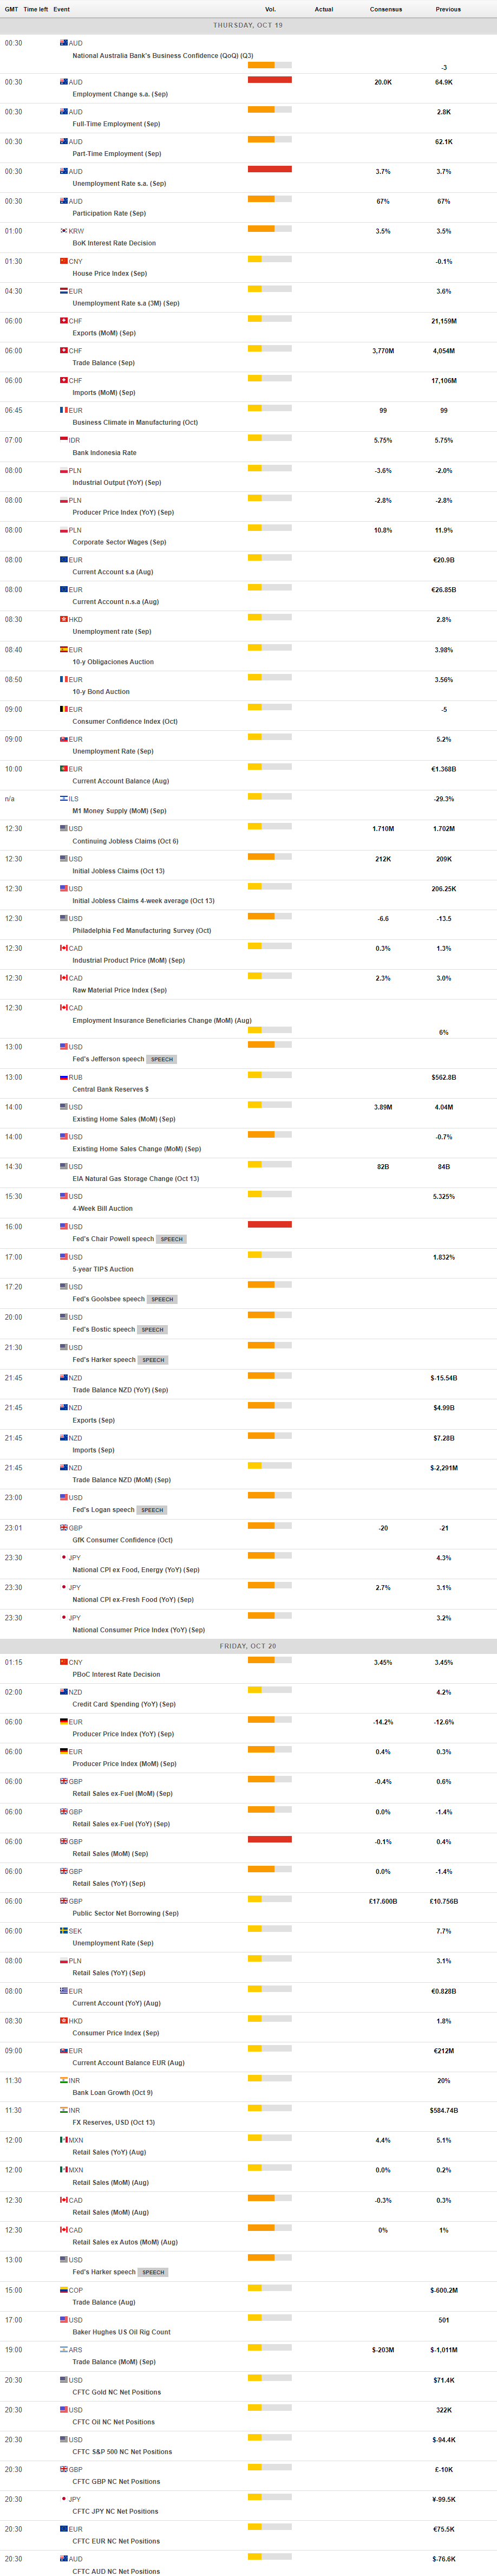
MACROECONOMIC EVENTS
All Information & Updates provided by:

All information relating to the financial markets available on this page has been prepared and issued by FXStreet (Forexstreet SL, Spain, Reg: B62498233) on the basis of publicly available information and all information believed to be reliable and does not conflict with Kuwaiti local laws, and all necessary care has been taken to before the company to ensure that the facts mentioned are correct from the source.
NCM Investment nor any of its directors or employees shall in any way be held responsible for the contents of this news, and the information contained on this page is intended only to provide clients with publicly available information and should not be construed as investment advice, report or analysis and/or constitute an offer or invitation to buy or sell financial instruments of any kind.
RISK WARNING: Forex and CFDs are highly risky leveraged products, as losses can exceed deposits. Please ensure you understand all the risks and take independent advice if necessary. NCM will segregate the clients based on the criteria of the regulator and its bylaws. NCM does not provide any advisory service; the material published does not constitute advice or a recommendation for a transaction in any financial instrument. NCM accepts no responsibility for any use of the content presented and any consequences of that use. Anyone acting on the information provided does so at their own risk.