Daily Market Updates
20 Oct 2023
USDJPY
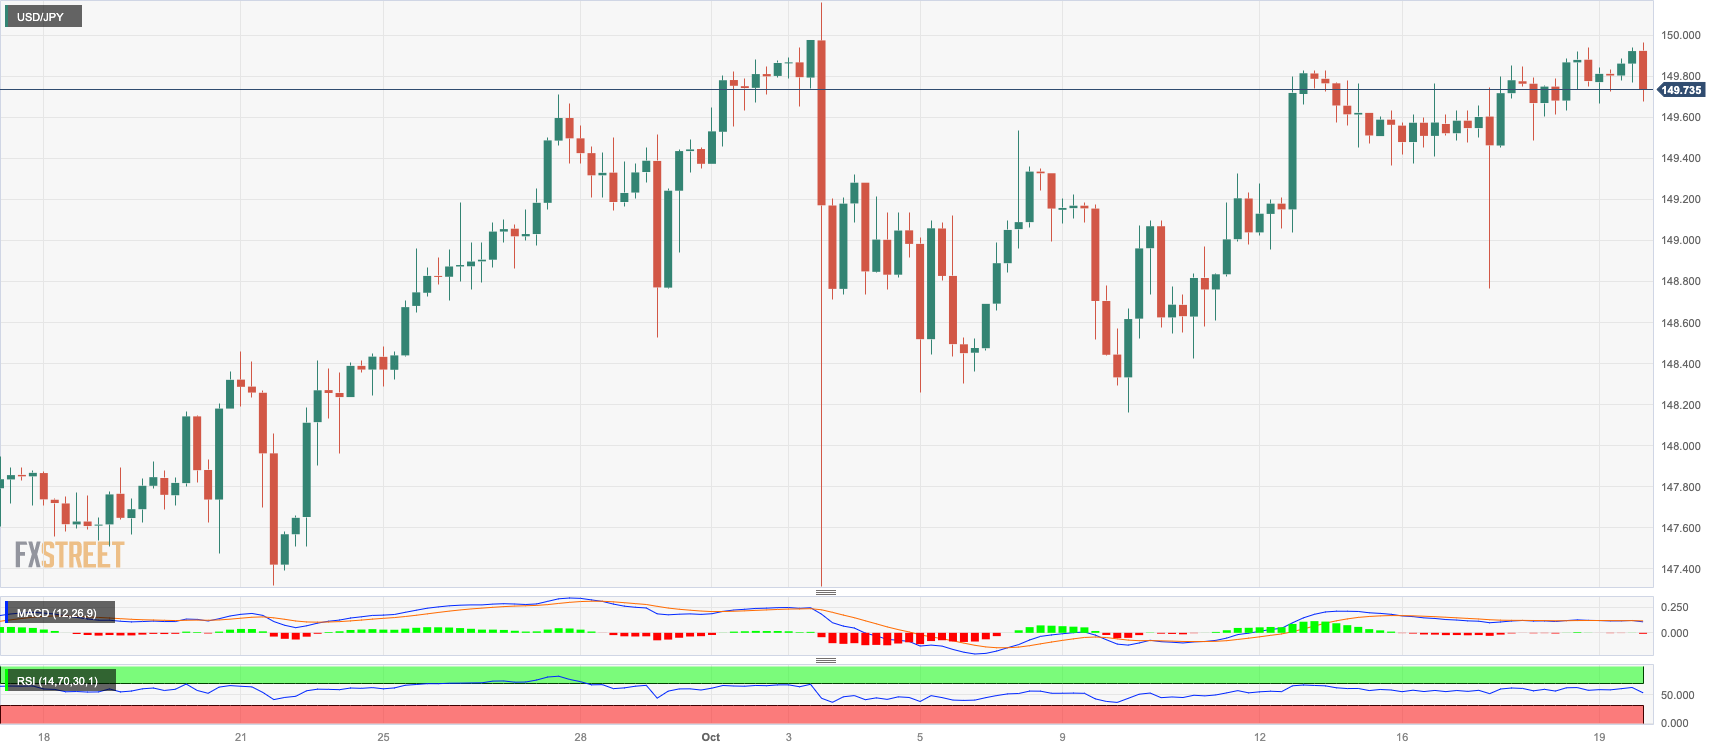
USD/JPY traded in an inconclusive fashion once again in levels just shy of the critical 150.00 region on Thursday.
The pair’s daily price action came amidst renewed selling pressure in the greenback and the continuation of the march north in both US and Japanese bond yields. On the latter, it is worth mentioning that the JGB 10-year yields rose to the 0.85% area for the first time since July 2013.
As spot closed in to the 150.00 zone, fears of FX intervention by the BoJ and the government are expected to lend support to the Japanese yen for the time being, keeping the pair’s potential upside somehow contained.
In Japan, the trade surplus came in at ¥62.4B in September, while Foreign Bond Investment increased by ¥794B in the week to October 14.
If the USD/JPY rises over the 2023 high of 150.16 (October 3), it may face the 2022 top of 151.94 (October 21) sooner rather than later. Having said that, the temporary 55-day SMA at 147.27 might give some short-term support before the weekly low at 145.89 (September 11). The collapse of the latter allows for a further decline to the September low of 144.43 (September 1), which appears to be supported by the intermediate 100-day SMA at 144.61. The August low of 141.50 (August 7) seems to emerge south of here, just ahead of the 200-day SMA at 139.21 and the July low of 137.23 (July 14). The daily RSI eased below the 61 yardstick.
Resistance levels: 149.93 150.16 151.94 (4H chart)
Support levels: 148.73 148.16 147.27 (4H chart)
GBPUSD
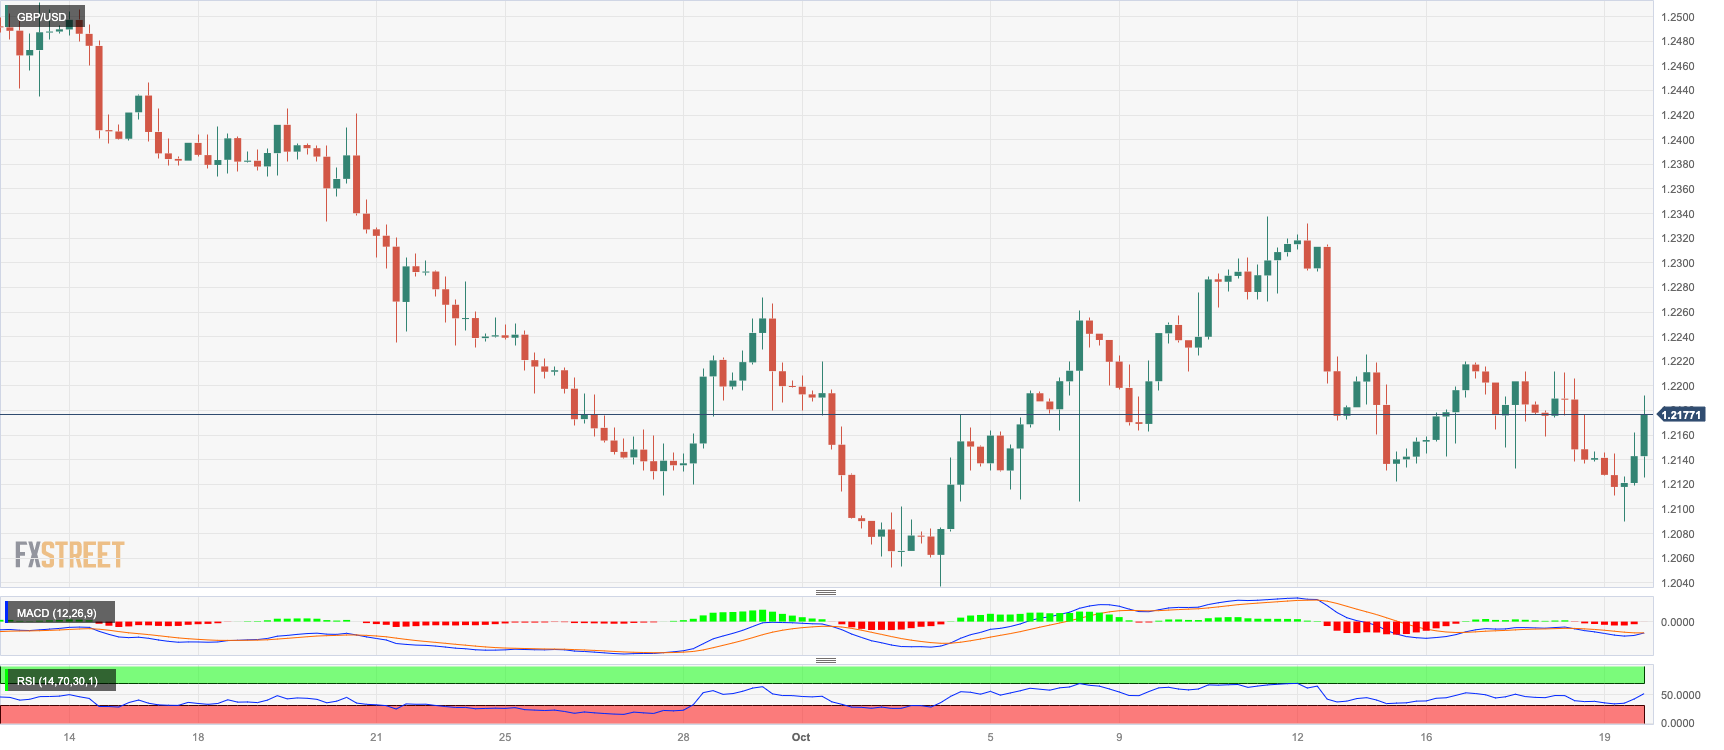
The buying pressure returned to the British pound, encouraging GBP/USD to reverse two consecutive daily pullbacks band on Thursday.
Indeed, Cable initially deflated to the sub 1.2100 region, although bulls returned to the market in response to the pronounced Powell-led sell-off in the greenback, prompting spot to left behind part of the recent weakness.
There were no data releases scheduled in the UK calendar on Thursday.
Further depreciation in GBP/USD could potentially push the pair down to the October low of 1.2037 (October 3). This level is just shy of the significant psychological mark of 1.2000 and the lowest point it reached in 2023, which was 1.1802 (March 8). Just the opposite, the immediate resistance level for Cable is represented by the October high of 1.2337 (October 11) followed by the 200-day SMA at 1.2442. Progressing beyond this level, the next resistance points are the weekly highs of 1.2746 (August 30), 1.2818 (August 10), and 1.2995 (July 27), all coming before the critical threshold of 1.3000. The RSI for the day surpassed the 40 level.
Resistance levels: 1.2219 1.2337 1.2421 (4H chart)
Support levels: 1.2089 1.2037 1.1802 (4H chart)
AUDUSD
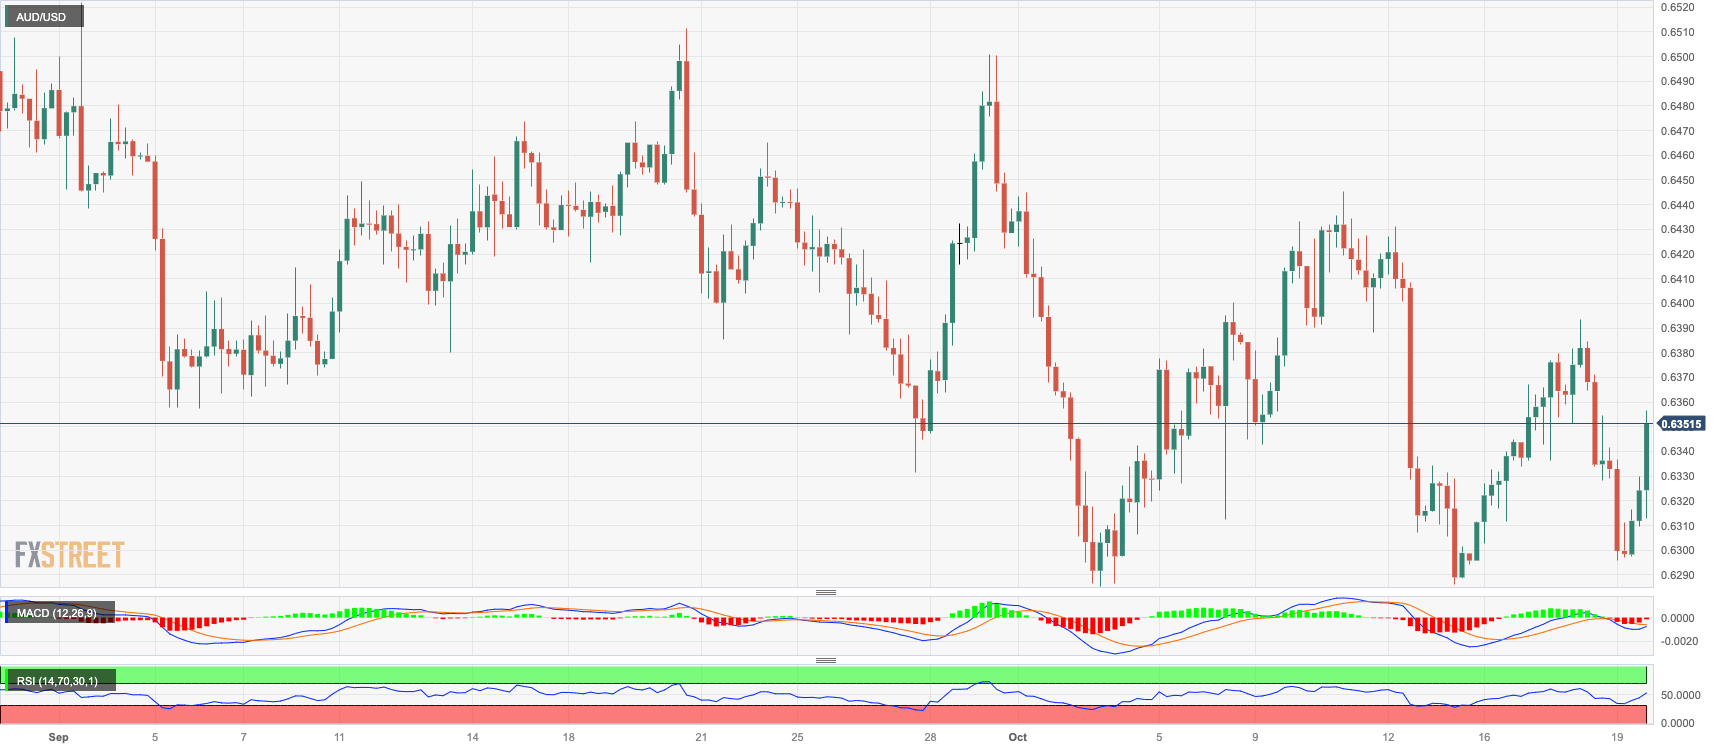
Despite the intense move lower in the greenback, AUD/USD traded in an inconclusive note on Thursday, this time briefly piercing the key 0.6300 support just to bounce towards the end of the NA session.
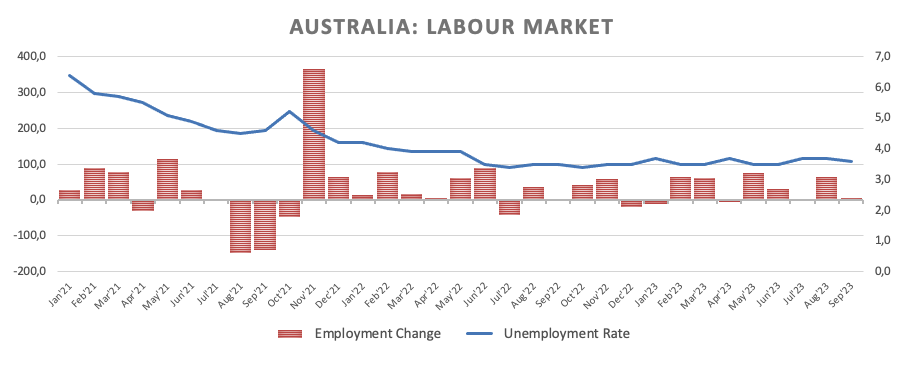
It seems that the absence of direction in the commodity complex, in combination with the somewhat disappointing jobs report in Australia, put the Aussie dollar under further pressure on Thursday, which only found some respite in the renewed and strong selling mood in the US dollar.
Back to the calendar, the jobless rate ticked lower to 3.6% in September, while the Employment Change increased less than expected by 6.7K individuals also during last month.
The revival of selling pressure might lead the AUD/USD to contest the 2023 low of 0.6285 (October 3), before the November 2022 low of 0.6272 (November 7) and the 2022 low of 0.6179 (October 13). The immediate up-barrier aligns at the weekly high of 0.6445 (October 11), seconded by another weekly top of 0.6522 (August 30). The breakout of the latter displays the temporary 100-day SMA at 0.6554, ahead of another weekly peak of 0.6616 (August 10), both of which are ahead of the 200-day SMA at 0.6655. Further increases may take the pair to its July high of 0.6894 (July 14), then to the June top of 0.6899 (June 16), and finally to the key 0.7000 barrier. The RSI looked stable around 44.
Resistance levels: 0.6393 0.6445 0.6501 (4H chart)
Support levels: 0.6295 0.6285 0.6272 (4H chart)
GOLD
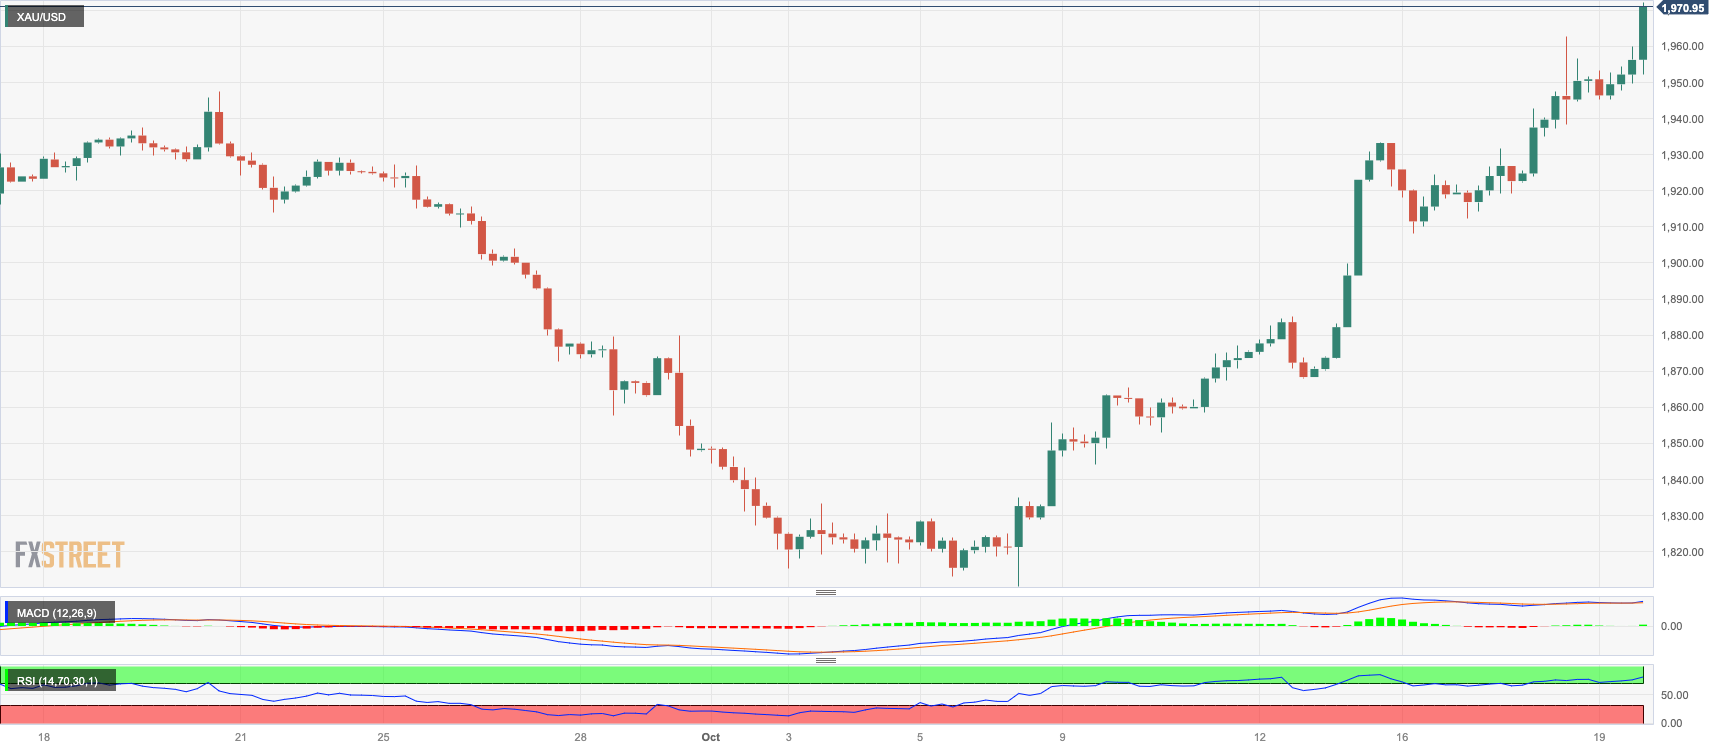
Gold prices kept the upside bias well in place and added to Wednesday’s uptick past the $1970 mark per troy ounce on Thursday.
The daily pullback in the greenback, in addition to some loss of momentum in US yields across the curve, seems to have underpinned the third consecutive session of gains in the precious metal, which managed to advance to fresh three-month peaks.
In the meantime, prices of the commodity are expected to remain supported by bouts of risk aversion derived from the geopolitical scenario in the Middle East, while the Fed’s tighter-for-longer stance emerges as an almost omnipresent headwind.
Gold prices should now aim for the October high of $1962 (October 18), followed by the July top of $1987 (July 20) and the critical $2000 level. The 2023 peak of $2067 (May 4) may be challenged from here, followed by the 2022 high of $2070 (March 8) and the all-time top of $2075 (August 7, 2020). On the contrary, there is immediate conflict at the October low of $1810 (October 6), which is ahead of the 2023 bottom of $1804 (February 28) and just before the critical support zone of $1800.
Resistance levels: $1972 $1982 $1987 (4H chart)
Support levels: $1908 $1896 $1867 (4H chart)
CRUDE WTI
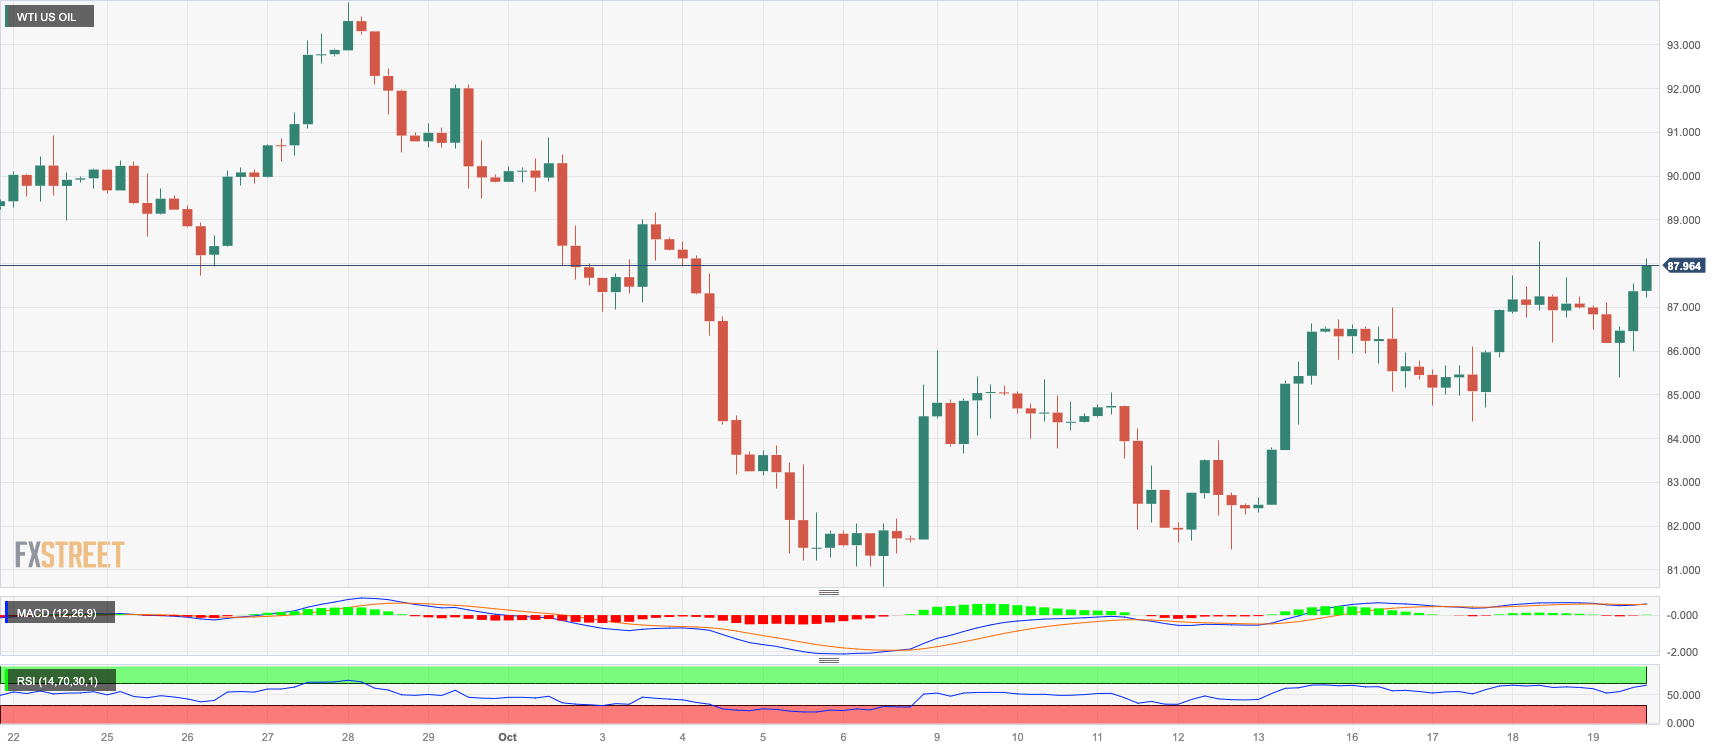
WTI prices gave away part of the two-day rebound and receded to the $85.50 zone, where the temporary 55-day SMA also sits and where they met an initial contention as well.
While concerns persist in the geopolitical landscape, putting a floor to occasional bouts of weakness in the commodity, traders perceived as bearish the recent news that the Biden administration eased sanctions against Venezuelan oil, allowing the Caribbean country to resume its oil production and eventual exports for the next six months.
Immediately to the upside for WTI aligns the weekly high of $89.83 (October 18) before the 2023 top of $94.99 (September 28) and the weekly peak of $97.65 (August 30, 2022), all of which are over the psychological $100.00 mark per barrel. Further falls, on the other hand, might retest the October low of $81.56 (October 6) before reaching the crucial $80.00 level, as well as the August low of $77.64 (August 24), which looks to be supported by the 200-day SMA at $77.94. If this zone is breached, WTI may fall to the weekly low of $73.89 (July 17), seconded by the June low of $66.85 (June 12), and the 2023 low of $63.61 (May 4), all prior to the key $60.00 mark per barrel.
Resistance levels: $89.83 $91.84 $93.06 (4H chart)
Support levels: $85.44 $82.27 $81.47 (4H chart)
GER40
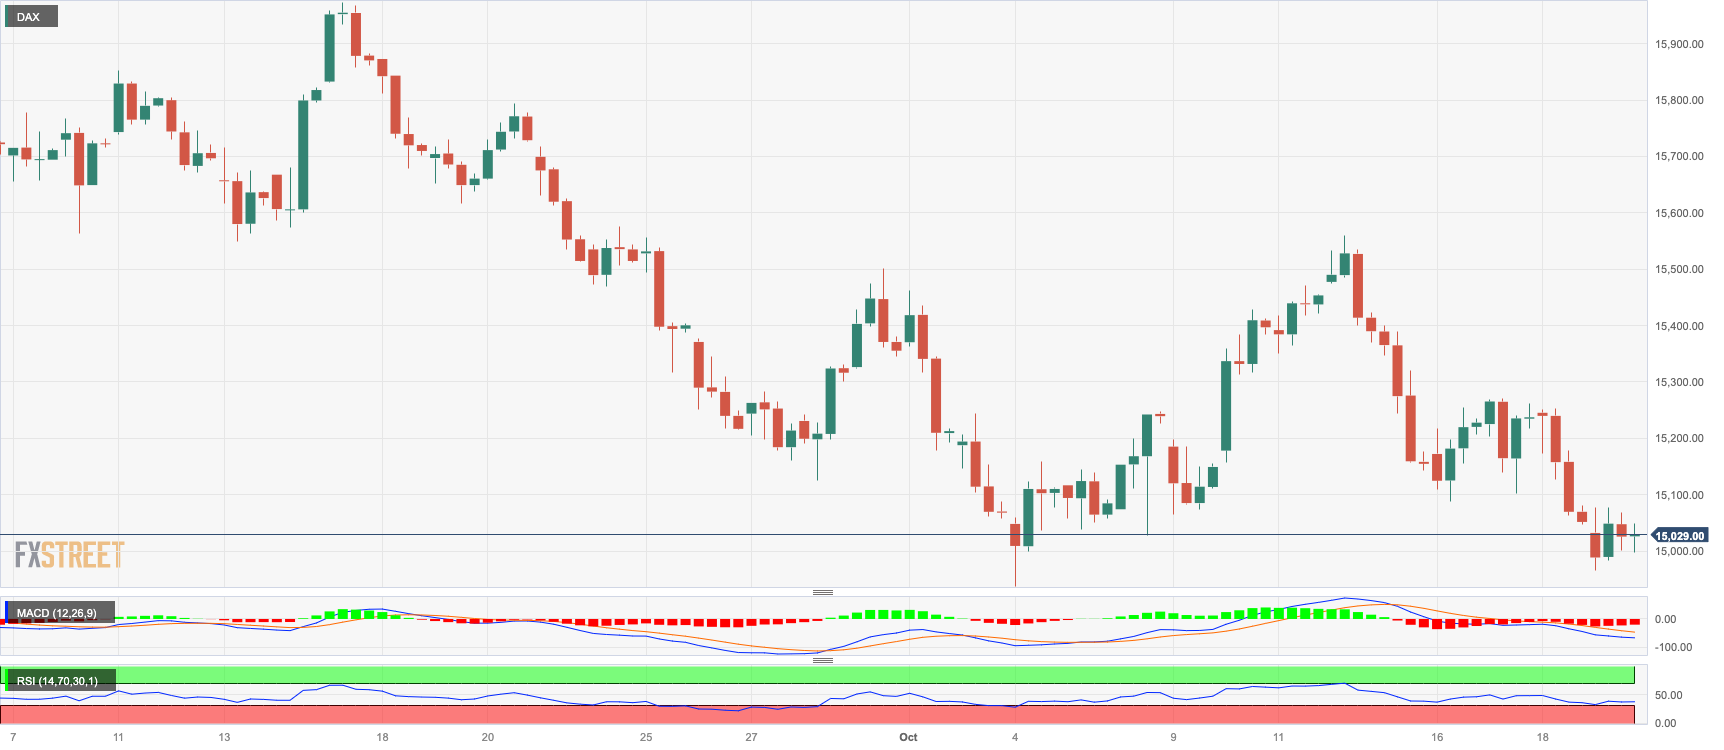
The German benchmark DAX40 added to Wednesday’s retracement and slipped back to the sub-15000 region on Thursday, or two-week lows.
The generalized pessimism surrounding the risk complex hurt investors’ mood and sponsored another session in the red for European stocks on Thursday. Indeed, rising fears stemming from the Middle East crisis contributed to the sell-off in stocks, while disappointing earnings reports also added to the downbeat sentiment.
If bears continue to press, the index may retest the October low of 14948 (October 4) before moving on to the March low of 14458 (March 20) and the December 2022 low of 13791 (December 20), which comes before the 2022 low of 11862 (December 20). On the upside, first resistance exists around the October high of 15575 (October 12), before hitting the critical 200-day SMA of 15651. Further up, the September high of 15989 (September 15) appears, followed by weekly tops of 16042 (August 31) and 16060 (August 10). A break over this level might return the index to its all-time peak of 16528 (July 31). The daily RSI deflated below the 38 yardstick.
Best Performers: SAP, Merck, RWE AG ST
Worst Performers: Vonovia, Continental AG, Infineon
Resistance levels: 15575 15729 15989 (4H chart)
Support levels: 14984 14948 14809 (4H chart)
NASDAQ
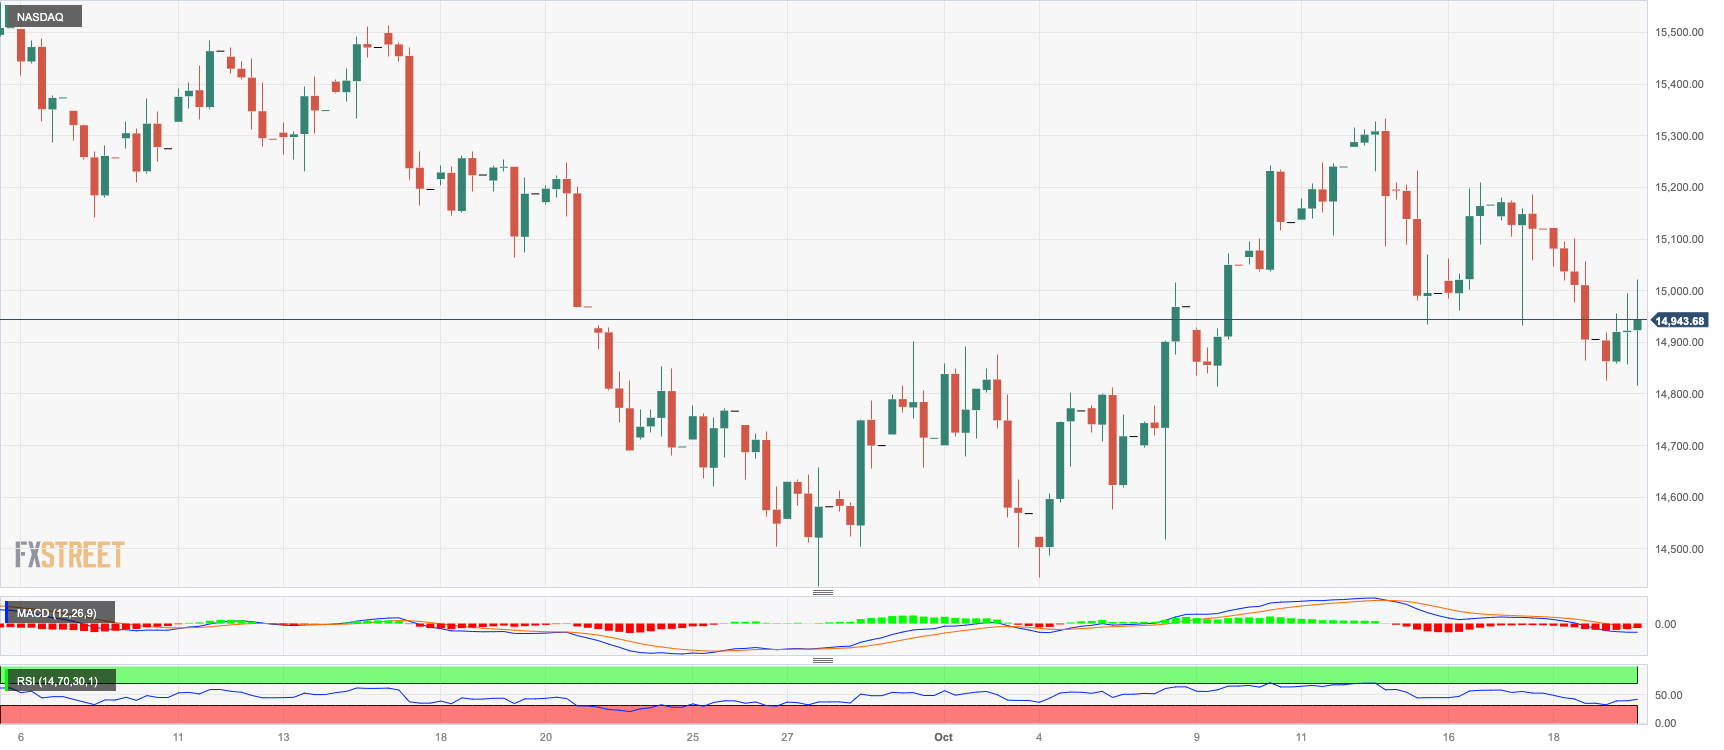
The key tech index Nasdaq 100 managed well to rebound from the earlier drop to the 14800 region, reclaiming the 15000 threshold as sentiment in the sector regained composure in the wake of Chief Powell’s comments at the Economic Club of New York on Thursday.
The perception that the Fed would refrain from hiking rates for the remainder of the year lent support to the US tech sector, which found another source of optimism from the marked sell-off in the greenback and hopes of auspicious results from upcoming corporate earnings reports.
The Nasdaq 100 closes in to its September low of 14432(September 27), which comes ahead of the weekly low of 14283 (June 7) and the 200-day SMA at 13806. In case this zone vanishes, the April low of 12724 (April 25) is expected to re-emerge, before the March low of 11695 (March 13) and the 2023 bottom of 10696 (January 6). Additional advances seem unlikely, yet those might send the index over its October high of 15333 (October 12), followed by the September top of 15618 (September 1), all before the weekly peak of 15803 (July 31) and the 2023 high of 15932 (July 19), all before the round milestone of 16000. The everyday RSI fell to the sub-50 zone.
Top Gainers: Netflix, DexCom, Globalfoundries
Top Losers: Tesla, Lam Research, Enphase
Resistance levels: 15333 15512 15618 (4H chart)
Support levels: 14432 14283 13520 (4H chart)
DOW JONES
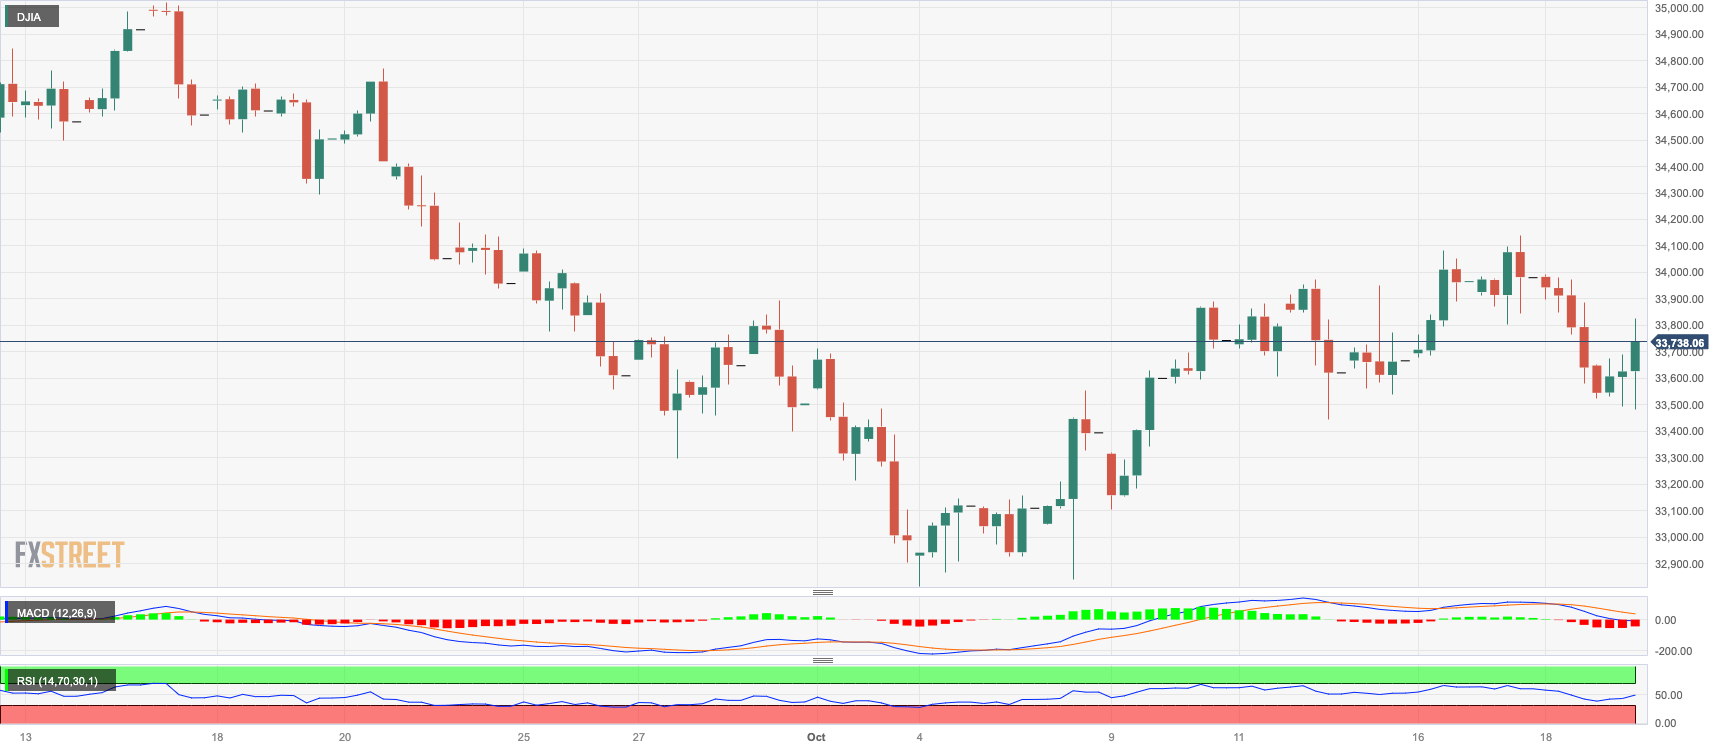
US equities measured by the Dow Jones reversed Wednesday’s pullback and printed decent gains on Thursday, revisiting once again the 33800 region, where the key 200-day SMA is located.
In fact, the index accelerated its bounce after Chair Powell hinted at the likelihood that the Federal Reserve will remain on the sidelines at the November 2 gathering, while investors re-shifted their attention to upcoming corporate earnings reports and the geopolitical scenario.
All in all, the Dow Jones gained 0.32% to 33812, the S&P500 advanced 0.42% to 4332, and the tech-reference Nasdaq Composite rose 0.44% to 13372.
If the Dow Jones rises further, it may test the October high of 34147 (October 17) ahead of the interim 100-day and 55-day SMAs, both around 34320. North from here comes the September top of 34977 (September 14) ahead of the weekly peak of 35070 (August 31) and the 2023 high of 35679 (August 1). If the latter is exceeded, the 2022 top of 35824 (February 9) may be achieved before the all-time peak of 36952 (January 5, 2022). On the flip side, a break below the October low of 32873 (October 4) might return a test of the May low of 32586 (May 25) before the 2023 low of 31429 (March 15). The daily RSI climbed past the 48 level.
Top Performers: Verizon, Salesforce Inc, McDonald’s
Worst Performers: Merck&Co, Travelers, Amgen
Resistance levels: 34147 34288 34977 (4H chart)
Support levels: 33455 32846 32586 (4H chart)
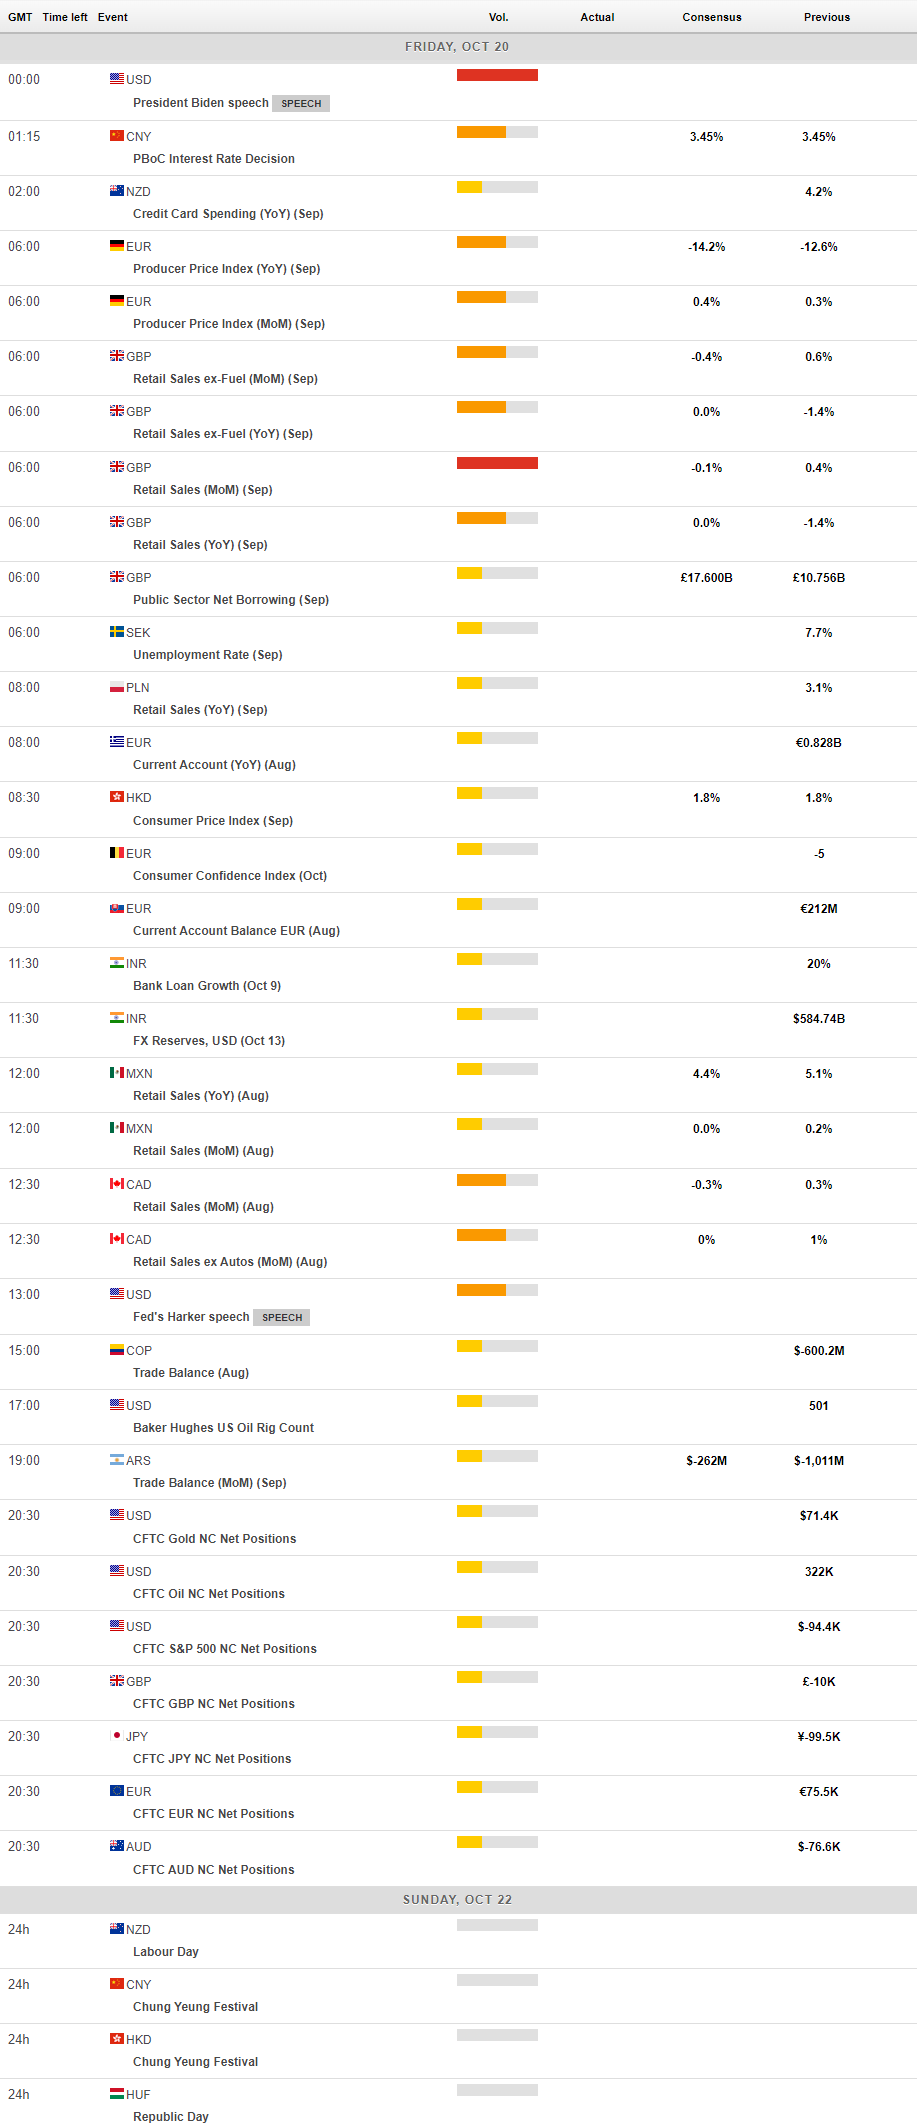
MACROECONOMIC EVENTS
